海南省统计年鉴2020社会经济发展指标:工业主要指标
合集下载
中国统计年鉴2020全国社会经济发展指标:按行业分规模以上工业企业产品和工艺创新情况2019
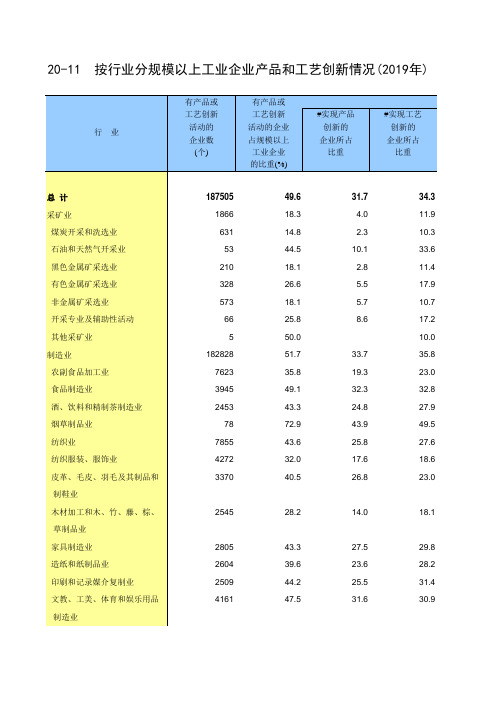
废弃资源综合利用业
696
36.5
14.8
23.2
金属制品、机械和设备修理业
199
43.1
21.0
30.7
电力、热力、燃气及水生产和
2811
20.5
2.6
13.0
供应业
电力、热力生产和供应业
1841
20.5
2.4
12.9
燃气生产和供应业
389
16.8
2.5
11.3
水的生产和供应业
581
24.0
3.5
15.2
12593
34.8
17.9
22.8
黑色金属冶炼和压延加工业
1946
38.1
21.0
26.6
有色金属冶炼和压延加工业
3653
50.4
30.6
35.5
金属制品业
12068
48.9
30.4
34.4
通用设备制造业
16205
65.4
46.5
46.5
专用设备制造业
13286
69.5
50.0
49.6
汽车制造业
9649
62.3
45.0
45.8
铁路、船舶、航空航天和其他
2918
62.0
43.0
44.4
运输设备制造业
电气机械和器材制造业
17306
68.5
50.6
49.8
计算机、通信和其他电子设备
13957
74.5
56.8
55.5
制造业
仪器仪表制造业
3935
80.4
63.1
56.7
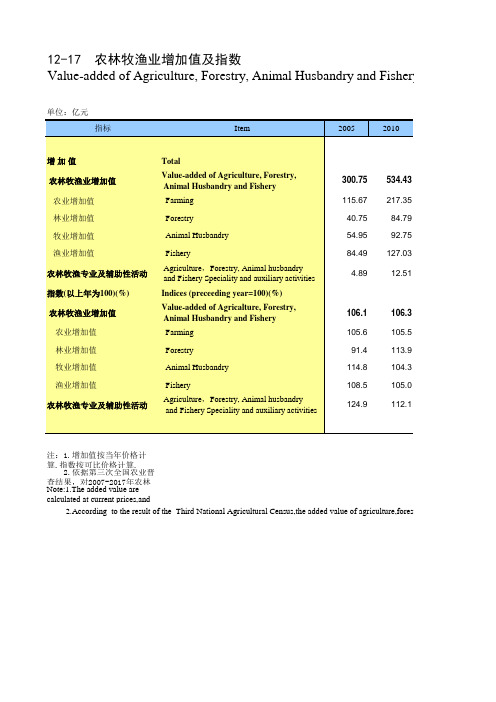
海南省统计年鉴2020社会经济发展指标:农林牧渔业增加值及指数
2.According to the result of the Third National Agricultural Census,the added value of agriculture,forestry,animal husbandry and
nd Fishery and Related Indices
104.2 104.7 103.9 103.2 103.5 109.5
103.8 105.7 102.5
99.4 103.0 110.0
104.1 105.1 105.6 103.9 101.2 110.0
102.7 105.5 105.5
94.0 100.7 110.3
riculture,forestry,animal husbandry and fishery were revised from 2007 to 2017.
12-17 农林牧渔业增加值及指数 Value-added of Agriculture, Forestry, Animal Husbandry and Fishery and Related In
单位:亿元 指标
Item
2005
2010
增加值 农林牧渔业增加值
农业增加值 林业增加值 牧业增加值 渔业增加值 农林牧渔专业及辅助性活动 指数(以上年为100)(%) 农林牧渔业增加值 农业增加值 林业增加值 牧业增加值 渔业增加值 农林牧渔专业及辅助性活动
Forestry
Animal Husbandry
Fishery Agriculture,Forestry, Animal husbandry and Fishery Speciality and auxiliary activities
海南省统计年鉴2020社会经济发展指标:电力收支情况表(2019)
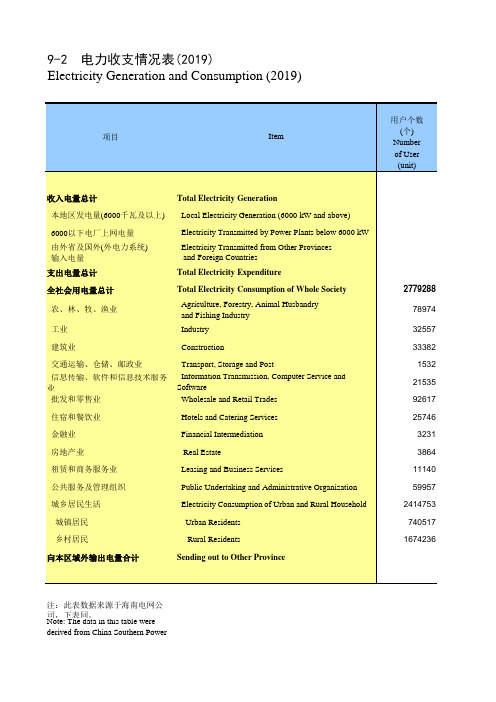
城乡居民生活
Electricity Consumption of Urban and Rural Household
城镇居民
Urban Residents
乡村居民
Rural Residents
向本区域外输出电量合计
Sending out to Other Province
2779288 78974 32557 33382 1532 21535 92617 25746 3231 3864 11140 59957
9-2 电力收支情况表(2019) Electricity Generation and Consumption (2019)
项目
用户个数
Item
(个)
Number
of User
(unit)
收入电量总计
Total Electricity Generation
本地区发电量(6000千瓦及以上) Local (6000 kW and above)
Hotels and Catering Services
金融业
Financial Intermediation
房地产业
Real Estate
租赁和商务服务业
Leasing and Business Services
公共服务及管理组织
Public Undertaking and Administrative Organization
2414753 740517
1674236
注:此表数据来源于海南电网公 司,下表同。 Note: The data in this table were derived from China Southern Power
海南省统计年鉴2020社会经济发展指标:全社会用电分类表(2019)
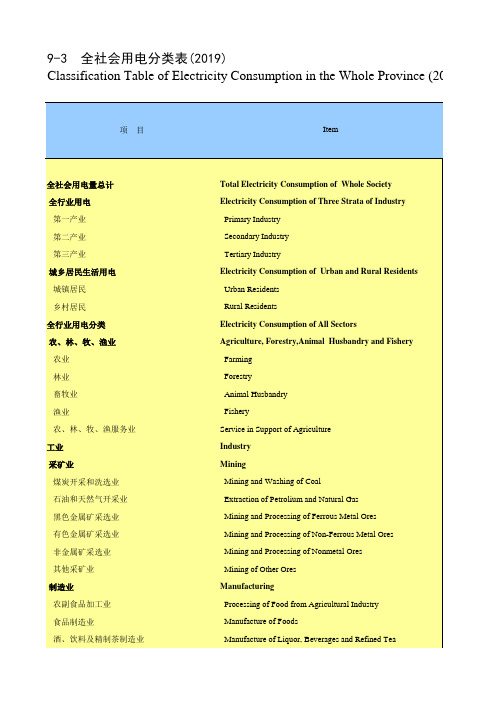
155660.23 1451162.76 1264682.97
677442.04 367983.53 309458.51 2871505.96 185601.26
47016.09 1195.64 9014.53
98433.97 29941.03 1357203.55 59842.35
738.66 1428.15 22060.64 8830.73 14700.53 12083.64 798656.05 43613.72 18040.31 6210.37
Total Electricity Consumption of Whole Society Electricity Consumption of Three Strata of Industry
Primary Industry Secondary Industry Tertiary Industry Electricity Consumption of Urban and Rural Residents Urban Residents Rural Residents Electricity Consumption of All Sectors Agriculture, Forestry,Animal Husbandry and Fishery Farming Forestry Animal Husbandry Fishery Service in Support of Agriculture Industry Mining Mining and Washing of Coal Extraction of Petrolium and Natural Gas Mining and Processing of Ferrous Metal Ores Mining and Processing of Non-Ferrous Metal Ores Mining and Processing of Nonmetal Ores Mining of Other Ores Manufacturing Processing of Food from Agricultural Industry Manufacture of Foods Manufacture of Liquor, Beverages and Refined Tea
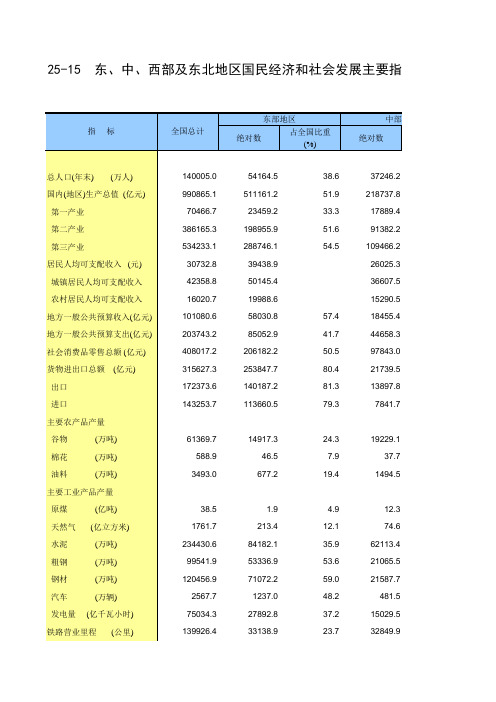
中国统计年鉴2020全国社会经济发展指标:东中西部及东北地区国民经济社会发展指标 2019
5.9
13.3
1325.9
8.2
411.9
2.5
21.4
30505.5
28.6
6225.0
5.8
26.0
711.0
26.5
258.0
9.6
27.7
799.3
26.4
251.9
8.3
23.5
10890.0
31.7
3305.0
9.6
24.2
98.9
25.6
29.6
7.7
25.8
199.1
29.0
63.1
本专科在校学生数 (万人)
医院数
(个)
执业(助理)医师 (万人)
医院床位数 (万张)
5012495.8 149571.2
1760435.7 4713624.4
16229.6 106810.7
2688.0 3031.5 34354.0
386.7 686.7
1178782.5 42743.8
635215.9 1809035.3
70466.7 386165.3 534233.1
30732.8 42358.8 16020.7 101080.6 203743.2 408017.2 315627.3 172373.6 143253.7
54164.5 511161.2
23459.2 198955.9 288746.1
39438.9 50145.4 19988.6 58030.8 85052.9 206182.2 253847.7 140187.2 113660.5
22471.0
31.9
6647.5
9.4
23.7
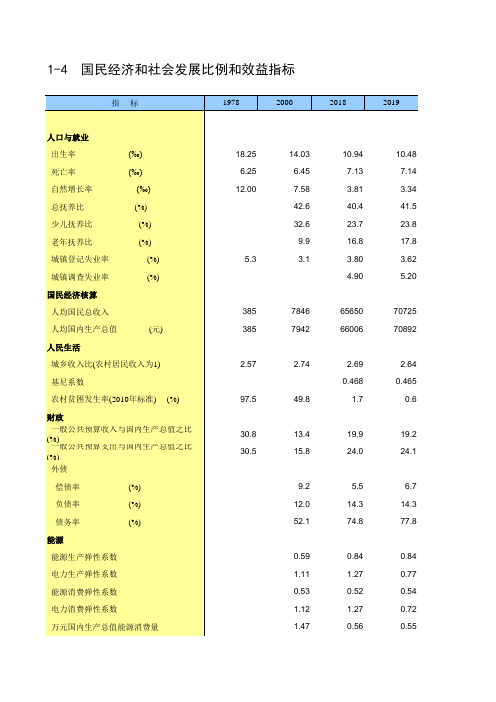
中国统计年鉴2020全国社会经济发展指标:1-4 国民经济和社会发展比例和效益指标
63.9
98.4
98.8
45.4
96.7
97.3
3.7
14.1
14.4
33.2
31.9
4753
6120
6272
445
1093
1819
1764
60.81 1.62 5.56
56.50 1.98 6.84
56.48 1.81 6.66
53.9 927.3
83.0 3885.6
137.1 5048.5
145.8 5221.3
0.4
19.1
126.0
128.0
0.0
6.7
112.2
农村贫困发生率(2010年标准) (%)
财政 一般公共预算收入与国内生产总值之比
(%一)般公共预算支出与国内生产总值之比 (%)
外债
偿债率
(%)
负债率
(%)
债务率
(%)
能源
能源生产弹性系数
电力生产弹性系数
能源消费弹性系数
电力消费弹性系数
万元国内生产总值能源消费量
18.25 6.25
12.00
5.3
385 385 2.57 97.5 30.8 30.5
医疗卫生机构病床使用率 (%)
城市市政建设
用水普及率
(%)
燃气普及率
(%)
人均公园绿地面积 (平方米)
注:计算万元国内生产总值能源消费量的 国内生产总值,2000年按2000年可比价计
2018年、2019年按2015年可比价计算 。
10.8
16.8
25.9
16.8
60.3
63.0
60.8
- 1、下载文档前请自行甄别文档内容的完整性,平台不提供额外的编辑、内容补充、找答案等附加服务。
- 2、"仅部分预览"的文档,不可在线预览部分如存在完整性等问题,可反馈申请退款(可完整预览的文档不适用该条件!)。
- 3、如文档侵犯您的权益,请联系客服反馈,我们会尽快为您处理(人工客服工作时间:9:00-18:30)。
2075.83 528.28
2489.75 572.52
2415.98 588.71
497 87
1381.25 354.80
1354.09 96.99
1322.83 1621.38
622.32 649.53 861.92 757.79 140.04
279.10 60.46 19.12 45.28 12.44
规模以上工业
Industrial Enterprises above Designated Size
企业单位数 (个)
Number of Enterprises (unit)
亏损企业数 (个)
Number of Loss-suffering Enterprises (unit)
工业总产值 (亿元)
Gross Industrial Output (100 million yuan)
13-1 工业主要指标 Major Indicators on Industry
指标
Item
全部工业
All Industrial Enterprises
工业总产值 (亿元)
Gross Industrial Output Value (100 million yuan)
工业增加值 (亿元)
Value-added of Industry (100 million yuan)
1668.92 2764.18
999.55 1315.46 1538.21 1225.97
101.87 25.59
284.12 75.76 23.63 85.69 9.78
335 83
1955.75 487.08
1858.02 207.17
1799.52 2858.40 1112.05 1090.45 1567.59 1286.55
工业增加值 (亿元)
Value-added of Industry (100 million yuan)
工业销售产值 (亿元)
Industrial Sales Value (100 million yuan)
出口交货值 (亿元)
Export Delivery Value (100 million yuan)
主营业务收入 (亿元)
Revenue from Principal Business (100 million yuan)
资产总计 (亿元)
Total Assets (100 million yuan)
流动资产合计 (亿元)
Total Current Assets (100 million yuan)
Total Profits (100 million yuan) Total Loss of Loss-suffering Enterprises (100 million yuan) Total Profits and Taxes (100 million yuan)
应交增值税 (亿元)
Value-added Tax Payable (100 million yuan.84 30.30 90.92 9.70
349 79
2272.69 507.62
2215.32 204.26
2200.74 3030.82 1271.13 1759.68 1692.14 1338.68
145.53 36.23
327.55 65.91 39.04
2005
548.52 176.92
646 265 473.06 148.47 468.18 25.12 449.76 791.28 285.11
437.44
6.62 70.22 25.34
2010
2015
2016
2017
2018
2019
1470.35 385.21
2000.93 485.85
1995.11 479.22
379 104 1877.63 448.95 1833.26 177.11 1661.72 2788.06 968.46 1222.10 1544.97 1242.62 103.61 23.45 285.42 72.84 23.83 85.96 11.51
337 67
1871.01 441.82
1765.10 193.55
固定资产原价 (亿元)
Total Fixed Assets (100 million yuan)
负债总计 (亿元)
Total Liabilities (100 million yuan)
所有者权益合计 (亿元) Owner's Equity (100 million yuan)
利润总额 (亿元) 亏损企业亏损额 (亿元) 利税总额 (亿元)
104.33 10.05
412 99
2216.31
2176.68 195.01
2275.43 3293.45 1485.12 2152.89 1767.61 1527.34
170.50 26.12
339.59 51.36 32.05
116.14 10.19
所得税费用 (亿元)
Incomne Tax Payable (100 million yuan)
本年应付职工薪酬(亿元) Total Wages Payable of Current Year (100 million yuan)
从业人员年平均人数(万人) Average Employed Employees (10000 persons)