收集flex CMM service data日志
品保术语

成为质量部一名合格的品管员应具备的条件------QA版1、首先应掌握品管员应具备的最基本的品质基础知识(1)现目前智迪公司所使用的抽样方案为:GB/T 2828.1-2003单次Ⅱ级抽样方案,等同于美国军用标准MIL-STD-105D。
(2)常见英文字母的含义AQL:接收质量限 QC:品质控制IQC:来料品质控制 IPQC:制程品质控制QA:品质保证 OQC:出货品质控制QST:品质体系小组 AC/RE:允收数/拒收数LCL:下控制限 UCL:上控制限BOM:物料清单 QFD:质量功能展开PMC:生产材料控制(即物控部) Quality:品质CR:严重不合格(致命缺陷) N:批量MAJ:主要不合格 n:样本量MIN:次要不合格(轻微不合格)(3)常见包装英文字母/单词含义NET Weight(N.W):净重 MEAS:尺寸 Order NO.:订单号Gross Weight(G.W):毛重 Customer:顾客/消费者 Carton NO.:卡通箱号Quantity(QTY):数量 Model NO.:型号 Color:颜色Made in china:中国制造 Wireless:无线的 PO NO.:客户单号Football mouse:足球鼠标 Keyboard:键盘 Receiver:接收器Black:黑色的 Red:红色的 Yellow:黄色的 Total:总数Supplier:供方 Phone:电话号码 Remark:备注(4)包装外箱图案含义产品中不含有毒有害物质或元素垃圾筒环保标识轻拿轻放可再生循环堆码层数堆码层数怕雨怕雨怕雨小心轻放向上向上不可脚踩不可脚踩易碎易碎不可使用小刀可循环利用2、名词解释(1)严重不合格:指在产品使用过程中、有明显存在不安全因素(对使用者构成电击或大灾害、意外伤害、危险或抵触行销国家的标准与法令等)、或不能符合客户特殊要求,以及产品完全无功能,有病毒之缺点。
RCP程序的日志收集与分析实践
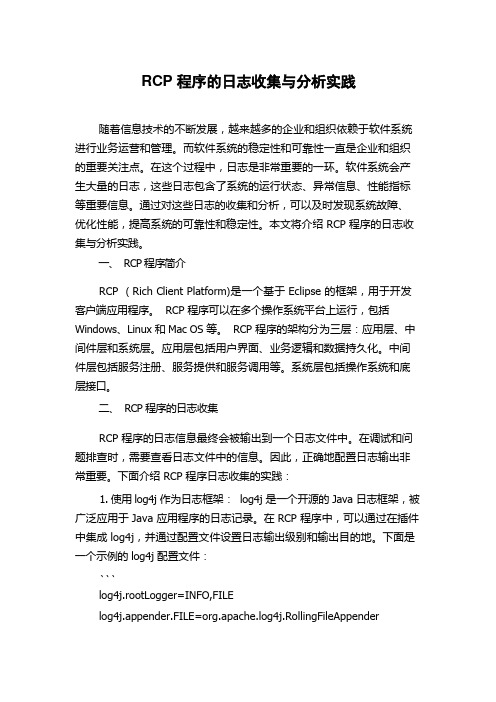
RCP随着信息技术的不断发展,越来越多的企业和组织依赖于软件系统进行业务运营和管理。
而软件系统的稳定性和可靠性一直是企业和组织的重要关注点。
在这个过程中,日志是非常重要的一环。
软件系统会产生大量的日志,这些日志包含了系统的运行状态、异常信息、性能指标等重要信息。
通过对这些日志的收集和分析,可以及时发现系统故障、优化性能,提高系统的可靠性和稳定性。
本文将介绍RCP 程序的日志收集与分析实践。
一、RCP 程序简介RCP ( Rich Client Platform)是一个基于Eclipse 的框架,用于开发客户端应用程序。
RCP 程序可以在多个操作系统平台上运行,包括Windows、Linux 和Mac OS 等。
RCP 程序的架构分为三层:应用层、中间件层和系统层。
应用层包括用户界面、业务逻辑和数据持久化。
中间件层包括服务注册、服务提供和服务调用等。
系统层包括操作系统和底层接口。
二、RCP 程序的日志收集RCP 程序的日志信息最终会被输出到一个日志文件中。
在调试和问题排查时,需要查看日志文件中的信息。
因此,正确地配置日志输出非常重要。
下面介绍RCP 程序日志收集的实践:1. 使用log4j 作为日志框架:log4j 是一个开源的Java 日志框架,被广泛应用于Java 应用程序的日志记录。
在RCP 程序中,可以通过在插件中集成log4j,并通过配置文件设置日志输出级别和输出目的地。
下面是一个示例的log4j 配置文件:```log4j.rootLogger=INFO,FILElog4j.appender.FILE=org.apache.log4j.RollingFileAppenderlog4j.appender.FILE.File=${workspace_loc}/logs/eclipse.loglog4j.appender.FILE.MaxFileSize=10MBlog4j.appender.FILE.MaxBackupIndex=5yout=org.apache.log4j.PatternLayoutyout.ConversionPattern=%d{yyyy-MM-dd HH:mm:ss,SSS} %p [%c] - %m%n```其中,rootLogger 设置日志输出级别为INFO,表示只输出INFO 级别及以上的日志信息;appender.FILE 设置输出目的为一个滚动式日志文件,文件大小不超过10MB,保留5 个备份文件;layout.ConversionPattern 设置日志输出格式。
IBM服务器日志搜集方法

IBM X-Server日志收集方法-------------------------------MemoryMinidump---------------------------------Minidump调试方法:1. 到/whdc/devtools/debugging/default.mspx下载dbg_x86_6.9.3.113.msi2. 建立临时目录c:\temp3. 启动windbg,打开file->symbol file path (ctrl+s),输入SRV*c:\temp*/download/symbols,确定4. 打开file->open crash dump (ctrl+d),打开%systemroot%\Minidump目录下dmp后缀的文件5. 在左下角状态提示“kd>”后,输入“!analyze -v”,回车,下面会出现分析结果-------------------------------BMC日志---------------------------------收集BMC日志需要您准备一台笔记本和一根交叉网线连接到服务器的网络1口。
一、BMC收集1. 到IBM网站(/systems/support/supportsite.wss/docdisplay?ln docid=MIGR-64636&brandind=5000008)下载一个压缩包osa_utl_smbr_2.0.24.1_anyos_noarch.zip,下载好之后解压,将windows下的SMBridge安装程序拷贝到笔记本中。
2. 在服务器BIOS中设置BMC的IP地址。
重启服务器,按F1进BIOS,依次选择Advanced Setup-> Baseboard Management Controller (BMC) Settings -> BMC Network Configuration,将IP地址获取方式改为静态,IP地址为10.1.1.97;子网掩码是255.255.255.0。
Lenovo ThinkSystem和System x服务器数据收集指南说明书

Collecting Service Data on Lenovo ThinkSystem and System x serversPlanning / ImplementationThis document provides the instructions for the various methods of collecting service data on Lenovo servers. Users might be asked to collect service data by Lenovo service personnel or from a qualified business partner when opening a service ticket. This is sometimes referred to as collecting First Failure Data Capture (FFDC).This guide provides instructions for users who are new to Lenovo ThinkSystem or System x servers. It will guide you to choose the right tool and then guide you to complete the task of collecting service data, which you can send to the qualified service personnel as the next step in the troubleshooting journey.Choosing the right toolIt is recommended that you understand all methods for collecting service data that Lenovo provides so that you can quickly collect the data before calling for technical support. This way, you can avoid or minimize workload disruption while capturing the critical information that is needed, at a decisive moment, for precise and efficient troubleshooting.However if you are in a hurry, the following table allows you to quickly jump to the section that best suits your current situation. Choose a row at the first column based on what you have access to, then choose one of the server brand columns to link to the right tool and steps.Table 1. Choose the right tool to collect service dataWhat access do you have?Lenovo ThinkSystemincluding ThinkSystembranded Flex and NeXtScaleserversLenovo System xincluding Lenovobranded Flex andNeXtScale serversIBM System xincluding IBMbranded Flex,BladeCenter andNeXtScale servers1) I have access to the BMC web management e XClarity Controller (XCC)Use IntegratedManagementModule (IMM)Use IntegratedManagement Module(IMM)2) I have access to the server OS* to run command line applications with root or Administrator e XClarity EssentialsOneCLIUse XClarityEssentials OneCLIUse Dynamic SystemAnalysis (DSA)Portable3) I have access to the server locally with KVM (keyboard & video) and I am able to reboot the e XClarity ProvisioningManager (LXPM)Use DynamicSystem Analysis(DSA) PrebootUse Dynamic SystemAnalysis (DSA) Preboot4) I am managing the servers with XClarity Administrator and would like to use it to collect service data on one or more e XClarity Administrator(LXCA)Use XClarityAdministrator(LXCA)Not supported5) I need to collect service data on Flex System CMM or components other than the compute e Chassis ManagementModule (CMM)Use ChassisManagementModule (CMM)Use ChassisManagement Module(CMM)* The OS here refers to a supported version of Windows and Linux on the server. Although VMware ESXi is also supported on the server, the support tool cannot be run directly in the hypervisor; in this case, the user can use the BMC, XClarity Administrator or local access to collect service data.Where to get the toolsFigure 1. XClarity Controller home pageClick Service > Download Service Data.Click OK when prompted.The process may take a few minutes to complete, then you will be prompted by the browser to save the file to your workstation.Additional information:The naming convention for the service data file is: MachineType+tzz, for example7X1925Z000_S4AAC123_xcc_190325-104024.tzzThe XCC service data file *.tzz cannot be extracted using a generic decompression tool, such as unzip or 7zip. Send the service data file to an authorized technical service personnel for further analysis. XClarity Essentials OneCLIFigure 2. Lenovo ThinkSystem server POST splash screen3. If you see text mode UEFI setup, as shown in the following figure, choose the option to Launch GraphicalSystem Setup which launches XClarity Provisioning Manager.4. In XClarity Provisioning Manager, click Diagnostics as in the following figure.5. Click Collect Service Data and then click the Next arrow as shown in the following figure.6. Wait until the task is completed then click on the right arrow as shown in the following figure.7. Choose a USB drive in the list; then click Save as shown in the following figure.Integrated Management Module (IMM)Figure 8. IMM home pageClick the button Download Now as shown in the following figure.Figure 9. IMM download service dataThis may take a few minutes to complete, then you will be prompted by the browser to save the file to your local workstation.Additional information:The naming convention for the service data file is:MachineType+Model_SerialNumber_imm2_date_time.tgz, for example5465AC1_06BMZEV_imm2_20190321_042452.tgzThe IMM service data file *.tgz cannot be extracted using a generic decompression tool, such as unzip or 7zip. Please send the service data file to an authorized technical service personnel for further analysis.Use the following steps to collect service data using Dynamic System Analysis (DSA) Preboot.1. Boot or reboot the server and when you see the POST splash screen, press F2 for Diagnostics as shown inthe following figure.Figure 10. Lenovo System x server POST splash screen2. You will be shown the Memory Test screen. Choose Quit > Quit to DSA.3. DSA will launch with a text screen prompt. Type gui and press Enter as shown in the following figure.Figure 11. DSA Preboot text screen prompt4. At the graphical DSA welcome page, click on Full Inventory Collection and Diagnosis as shown in thefollowing figure.5. Select a target location to save the service data file; then click Run Now as shown in the following figure.Figure 13. DSA Preboot run full collection and diagnostics6. The task will take a few minutes to complete. If you have not chosen a target location at the previous step,you can click on Save to as shown in the following figure.Dynamic System Analysis (DSA) PortableXClarity AdministratorUse the following steps to collect service data using XClarity Administrator.1. Log into the XClarity Administrator management interface..2. Click the menu Administration > Service and Support3. In the Service and Support page, navigate to Endpoint Actions as shown in the following figure.Figure 15. XClarity Administrator endpoint actions4. Select one or more endpoints on which you’d like to collect service logs, then click the menu All Actions >Collect Service Data, confirm the action when prompted.5. The task will be launched in the background and should take a few minutes to complete.6. To download the service data file to your workstation, navigate to Endpoint Service Data.7. Select one or more files then click on the toolbar button or the equivalent menu in All Actions > DownloadSelected Service Files, as shown in the following figure.Figure 16. XClarity Administrator endpoint service dataChassis Management Module (CMM)Chassis Management Module (CMM)Use the following steps to collect service data using Chassis Management Module (CMM) with Flex System.1. Log into the CMM web management interface.2. Click on the Service and Support menu, then Download Service Data, as shown in the following figure.Figure 17. CMM home page3. Click the button Download Mgmt Module Data Now, as shown in the following figure.Figure 18. CMM download service data4. This process will take a few minutes to complete then you will be prompted by the browser to save the file toyour workstation.TrademarksLenovo and the Lenovo logo are trademarks or registered trademarks of Lenovo in the United States, other countries, or both. A current list of Lenovo trademarks is available on the Web athttps:///us/en/legal/copytrade/.The following terms are trademarks of Lenovo in the United States, other countries, or both:Lenovo®BladeCenter®Dynamic System AnalysisFlex SystemNeXtScaleSystem x®ThinkSystem®XClarity®The following terms are trademarks of other companies:Linux® is the trademark of Linus Torvalds in the U.S. and other countries.Windows® is a trademark of Microsoft Corporation in the United States, other countries, or both.Other company, product, or service names may be trademarks or service marks of others.。
navisphere日志收集

Navisphere:
===========
1. 打开浏览器并通过CLARIION 处理器的IP登录到处理器上
2. 展开CLARIION的树形管理界面
3. 右键点击SPA并选择SPCOLLECT。
根据提示确认您需要生成SPCOLLECT并得到SUCCESS 的提示。
4. 等待5~10分钟,右键点击SPA,选择FILE TRANSFER MANAGER,并在弹出窗口的右侧子窗口选择您想将SPCollect存放至的目标文件夹。
在左侧子窗口选择最新生成的SPCOLLECT (文件名为本CLARIION阵列序列号和本日时间的组合的ZIP压缩文件,如CK200051200337_SPA_2009-12-09_14-32-30_14b00d_data.zip)。
选择它并点击窗口下方的TRANSFER按钮传送至您的目标文件夹
注意:如果你在操作第4步的时候发现最新的SPCOLLECT文件是以RUNLOG.TXT结尾的文件,表示SPCOLLECT没有生成完全,需要再等几分钟再次第4步操作。
5. 同样的操作请在SPB上重复一遍。
IBM pureflex(CMM 配置指南)
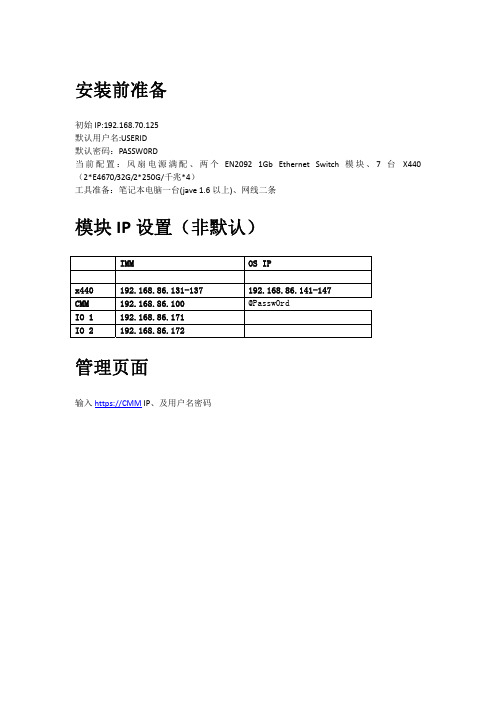
安装前准备初始IP:192.168.70.125默认用户名:USERID默认密码:PASSW0RD当前配置:风扇电源满配、两个EN2092 1Gb Ethernet Switch 模块、7台 X440(2*E4670/32G/2*250G/千兆*4)工具准备:笔记本电脑一台(jave 1.6以上)、网线二条模块IP设置(非默认)IMM OS IPx440 192.168.86.131-137 192.168.86.141-147CMM 192.168.86.100 @Passw0rdIO 1 192.168.86.171IO 2 192.168.86.172管理页面输入https://CMM IP、及用户名密码初始页面(可以看到前后视图及部件状态)系统组件任意选取一台服务器或者部件查看详细信息(日志、详细配置、微码),先看下CPU内存信息(可以显示哪些槽位有内存、每条内存的大小)系统信息Multi‐Chassis Monitor事件导出日志保存日志Services and support问题反馈Setting激活IBM远程支持(需要购买授权、方便没有管理员的企业使用)机箱管理chassisAir flowIdentification 下可以设置计算机的名称之类、不太常用。
Handware activity 下可以查看当前所有激活的服务器及模块。
Temperture可以查看当前的温度(满配20.50 度)还可以选择某一时间段温度的变化情况。
AIR FLOW节点控制当前服务器列表及状态如图所示:开始远程控制选择控制类型弹出如下JAVA 提示框,问啥都要继续了提供两种远程模式、Use the ActiveX Client /Use the Java Client 任选其一、单用户及多用户模式根据实际情况选其一。
又要提示、照例继续。
在上图点击RUN 后终于弹出服务器控制窗了我们来看看菜单有啥、第一项FILE 只有一个capture file 帮助大家来抓图第二项 view主要是帮大家设置显示效果、色彩、全屏之类第三项macros 主要是各种组合键、相当齐全、还嫌不够的话就自己选择soft key 去ADD 吧。
服务器日志的分析与利用
服务器日志的分析与利用随着互联网的快速发展,服务器日志成为了网络运营和管理中不可或缺的重要组成部分。
服务器日志记录了服务器上发生的各种活动和事件,通过对服务器日志的分析,可以帮助管理员了解服务器的运行状态、用户访问情况、异常事件等信息,从而及时发现问题、优化性能、提升安全性。
本文将介绍服务器日志的基本概念、常见类型以及如何进行有效的分析与利用。
### 一、服务器日志的基本概念服务器日志是服务器软件记录的一系列事件和活动的详细信息,包括用户访问记录、错误日志、系统日志等。
服务器日志通常以文本文件的形式存储在服务器的硬盘上,可以通过文本编辑器或专门的日志分析工具进行查看和分析。
服务器日志的记录内容丰富多样,可以包括以下信息:1. **访问日志**:记录用户对服务器的访问请求,包括访问时间、访问的页面或资源、用户的IP地址等信息。
2. **错误日志**:记录服务器发生的错误和异常事件,如页面无法访问、服务器崩溃等。
3. **安全日志**:记录服务器的安全事件,如登录尝试、恶意攻击等。
4. **系统日志**:记录服务器的系统运行状态,如CPU、内存、磁盘等资源的利用情况。
### 二、常见类型的服务器日志不同类型的服务器软件会生成不同格式的日志文件,常见的服务器日志包括:1. **Apache日志**:Apache是一种常用的Web服务器软件,其访问日志和错误日志是Web运营中必不可少的信息来源。
2. **Nginx日志**:Nginx是另一种流行的Web服务器软件,其日志格式与Apache有所不同,但同样记录了用户访问和服务器运行状态等信息。
3. **MySQL日志**:MySQL是一种常用的数据库软件,其日志记录了数据库的运行状态、查询请求等信息。
4. **系统日志**:包括Linux系统的syslog、Windows系统的Event Viewer等,记录了系统的各种事件和错误信息。
### 三、服务器日志的分析与利用服务器日志的分析与利用对于网络管理和安全监控至关重要,通过对服务器日志的分析可以实现以下目的:1. **监控服务器性能**:通过分析系统日志和资源利用日志,可以了解服务器的负载情况、磁盘空间使用情况等,及时调整服务器配置以提升性能。
品保术语

成为质量部一名合格的品管员应具备的条件------QA版1、首先应掌握品管员应具备的最基本的品质基础知识(1)现目前智迪公司所使用的抽样方案为:GB/T 2828.1-2003单次Ⅱ级抽样方案,等同于美国军用标准MIL-STD-105D。
(2)常见英文字母的含义AQL:接收质量限QC:品质控制IQC:来料品质控制IPQC:制程品质控制QA:品质保证OQC:出货品质控制QST:品质体系小组AC/RE:允收数/拒收数LCL:下控制限UCL:上控制限BOM:物料清单QFD:质量功能展开PMC:生产材料控制(即物控部)Quality:品质CR:严重不合格(致命缺陷)N:批量MAJ:主要不合格n:样本量MIN:次要不合格(轻微不合格)(3)常见包装英文字母/单词含义NET Weight(N.W):净重MEAS:尺寸Order NO.:订单号Gross Weight(G.W):毛重Customer:顾客/消费者 Carton NO.:卡通箱号Quantity(QTY):数量Model NO.:型号Color:颜色Made in china:中国制造Wireless:无线的PO NO.:客户单号Football mouse:足球鼠标Keyboard:键盘Receiver:接收器Black:黑色的Red:红色的Yellow:黄色的Total:总数Supplier:供方Phone:电话号码Remark:备注(4)包装外箱图案含义产品中不含有毒有害物质或元素垃圾筒环保标识轻拿轻放可再生循环堆码层数堆码层数怕雨怕雨怕雨小心轻放向上向上不可脚踩不可脚踩易碎易碎不可使用小刀可循环利用2、名词解释(1)严重不合格:指在产品使用过程中、有明显存在不安全因素(对使用者构成电击或大灾害、意外伤害、危险或抵触行销国家的标准与法令等)、或不能符合客户特殊要求,以及产品完全无功能,有病毒之缺点。
(2)主要不合格:指产品的使用性能不能达到所期望的目的,或者会降低其实用性能的缺点。