雅思写作满分范文:雅思图表作文怎样才能拿满分
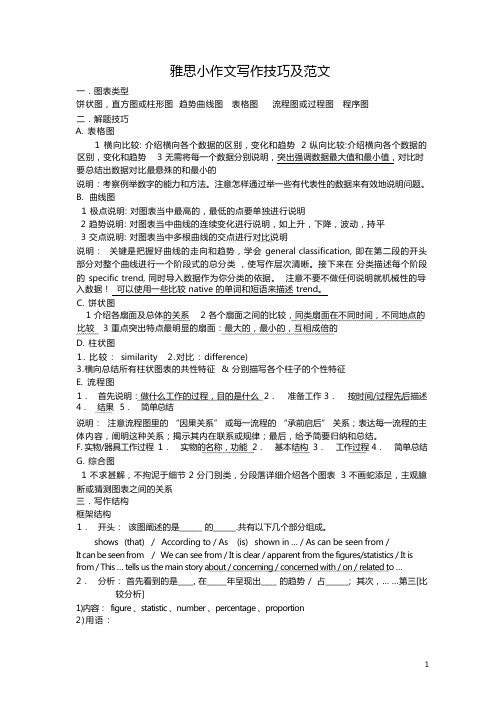
[雅思]3种常见雅思图表作文
![[雅思]3种常见雅思图表作文](https://img.taocdn.com/s3/m/beb24afc2f60ddccdb38a0c7.png)
1.柱状图:柱状图本质上就是前三种图的柱状形式,下面我们通过一个图来进行掩饰。
这张图看起来像三张饼图,等于四根曲线图,可以使用总分句,还等于一个3×4的表格题。
我们在写的时候可以使用一些表格题的写作方法,比如:This was the similarcase with the trend of foot.其实我们讲,考试中虽然有4种图,但题型本质上就分动态图和静态图,动态图最好使用曲线图的整体写作模式,就是All trends加天龙八部的微观和宏观结合,静态图则是静态表格的写作模式,通常用纯比较的写作模式。
所以我们在写作中要记住,语言不用新学了,完全借鉴前三种中的句型。
柱状图特殊的要求一,对类比和反比非常重视,因为它主要是向前三种图借鉴,也就是它不再强调每一种题型的要求,它不必强调趋势或者数字,它对每个图的当中共性和差异的开发是比较重视,所以柱状图中的文字性的部分可以多一些。
二,柱状图对语法的要去很高,很多柱状图属于静态图,这样写作的时候要求主语和句型的多样性。
三,它要求我们掌握一个概念,即隐藏特征的概念,它是柱状图特有的,后来引入到其他图,所谓隐藏特征即隐藏在数据背后的客观性事实,首先它是不明显的,要看你个人的分析能力,第二它是客观性事实,千万不要夹杂个人观点,如果在雅思中发表个人观点,一定5分以下。
另外隐藏特征要在结尾段写,它有自己的默认格式:What is worth mentioning is that since…, it indicates the fact that…,这个应该算高分的最后一击。
雅思Task1的高分关键在于:一,变化多端的wording,句式和体系,这就说明了你词汇的词汇的使用能力,包括句型的变化,这个用的好的话,5分是一定的;二,清晰宏观的分类,all trends的总分句;三,7.5分以上需要有力得体的隐藏特征,这是一个加分,找不到不扣分,找到有0.5分的加分。
雅思小作文技巧及范文
雅思小作文写作技巧及范文一.图表类型饼状图,直方图或柱形图趋势曲线图表格图流程图或过程图程序图二.解题技巧A. 表格图1 横向比较: 介绍横向各个数据的区别,变化和趋势2 纵向比较:介绍横向各个数据的区别,变化和趋势3 无需将每一个数据分别说明,突出强调数据最大值和最小值,对比时要总结出数据对比最悬殊的和最小的说明:考察例举数字的能力和方法。
注意怎样通过举一些有代表性的数据来有效地说明问题。
B. 曲线图1 极点说明: 对图表当中最高的,最低的点要单独进行说明2 趋势说明: 对图表当中曲线的连续变化进行说明,如上升,下降,波动,持平3 交点说明: 对图表当中多根曲线的交点进行对比说明说明:关键是把握好曲线的走向和趋势,学会 general classification, 即在第二段的开头部分对整个曲线进行一个阶段式的总分类,使写作层次清晰。
接下来在分类描述每个阶段的 specific trend, 同时导入数据作为你分类的依据。
注意不要不做任何说明就机械性的导入数据!可以使用一些比较 native 的单词和短语来描述 trend。
C. 饼状图1 介绍各扇面及总体的关系2 各个扇面之间的比较,同类扇面在不同时间,不同地点的比较3 重点突出特点最明显的扇面:最大的,最小的,互相成倍的D. 柱状图1. 比较 : similarity2.对比 : difference)3.横向总结所有柱状图表的共性特征 & 分别描写各个柱子的个性特征E.流程图1.首先说明:做什么工作的过程,目的是什么 2.准备工作 3.按时间/过程先后描述4.结果 5.简单总结说明:注意流程图里的“因果关系” 或每一流程的“承前启后” 关系;表达每一流程的主体内容,阐明这种关系;揭示其内在联系或规律;最后,给予简要归纳和总结。
F. 实物/器具工作过程 1.实物的名称,功能 2.基本结构 3.工作过程 4.简单总结G. 综合图1 不求甚解,不拘泥于细节2 分门别类,分段落详细介绍各个图表3 不画蛇添足,主观臆断或猜测图表之间的关系三.写作结构框架结构1.开头:该图阐述的是______ 的______.共有以下几个部分组成。
雅思作文满分范文(5篇)
雅思作文满分范文(5篇)(经典版)编制人:__________________审核人:__________________审批人:__________________编制单位:__________________编制时间:____年____月____日序言下载提示:该文档是本店铺精心编制而成的,希望大家下载后,能够帮助大家解决实际问题。
文档下载后可定制修改,请根据实际需要进行调整和使用,谢谢!并且,本店铺为大家提供各种类型的经典范文,如工作总结、工作计划、合同协议、条据文书、策划方案、句子大全、作文大全、诗词歌赋、教案资料、其他范文等等,想了解不同范文格式和写法,敬请关注!Download tips: This document is carefully compiled by this editor. I hope that after you download it, it can help you solve practical problems. The document can be customized and modified after downloading, please adjust and use it according to actual needs, thank you!Moreover, our store provides various types of classic sample essays for everyone, such as work summaries, work plans, contract agreements, doctrinal documents, planning plans, complete sentences, complete compositions, poems, songs, teaching materials, and other sample essays. If you want to learn about different sample formats and writing methods, please stay tuned!雅思作文满分范文(5篇)雅思作文满分范文第1篇下面给大家讲解一下小作文的心得和训练方法:小作文(A类)心得:为考的是A类,这里只说A类,留学生的话也建议考A类,平时写报告其实就是在练小作文,尤其是理工科。
雅思 图表作文写作技巧范文

声明:本讲义为GARY 呕心制作,GARY 享有独家版权,禁止转发、出售本讲义或将其用于其他商业用途!Task1 图表作文写作技巧(一)一、认识图表作文20 分钟 150 单词,占写作考试总分值的三分之一,描述一个或几个图表。
线性图(line graph/chart );柱状图(bargraph/chart );饼状图(pie graph/chart );表格( table );流程图(process diagram ) Table:Fig. 1 Pie chart and line graph: sales and share prices for Coca-ColaFig.2 Preferred leisure activities of Australian childrenFig. 3 Underground Railways Systems in Six Cities二、图表作文审题要素1. 描述对象整个图表的数据都是针对描述对象的。
图表的上方标题一般会指示描述对象。
弄清描述对象非常重要,因为在行文时,需要频繁地用到它。
如:sales of Coca Cola,share price of Coca Cola,the preferred leisure activities of Australian kids aged 5-14, wages growth rate。
2. 描述单位对于有 X 轴(horizontal axis)和 Y 轴(vertical axis)的图表,描述单位一般在 Y 轴以符号的形式标明。
弄清描述单位对于数据的准确描述非常关键,把握不准的话就容易被当做跑题。
一般要弄清数字 ( number )和百分比( percentage; proportion )的区别。
另外,记住几个常用的单位缩写符号:$:dollarbn:billionm: million 或 metrekm: kilometre%: percentage / proportion 区别: per cent,000s: thousand比如,第一页的描述单位: bottle / percentage (pie chart), dollar (line chart), percentage (bar chart) 三、图表作文标准结构Part 1 开头段,介绍写作目的,需包含四个要素:图表类型主要描述动词describe,show,present,depict,indicate,representcompare / make a comparison between …描述对象背景信息(地点 + 时间)例如:The line graph gives some detailed information about the wages growth rate of some country over adecade from 1993 to 2003.The pie charts below show the percentage of men and women who smoked in Australia during a 40-yearperiod, between 1960 and 2000.Part 2 主体段:1 + N 结构1: 一句话概括总趋势或总特征( general trend or feature )套句:… have shown striking changes/differences.N: N 段 ( N≥1 )细节描述( striking trends or features )Part 3 结尾段结尾段给出结论。
雅思英语图表作文范文(必备3篇)

雅思英语图表作文范文第1篇A类雅思各类图表作文要点及范文一.曲线图解题关键1曲线图和柱状图都是动态图,解题的切入点在于描述趋势。
2在第二段的开头部分对整个曲线进行一个阶段式的总分类,使写作层次清晰,同时也方便考官阅卷。
接下来再分类描述每个阶段的specifictrend,同时导入数据作为分类的依据。
3趋势说明。
即,对曲线的连续变化进行说明,如上升、下降、波动、持平。
以时间为比较基础的应抓住“变化”:上升、下降、或是波动。
题中对两个或两个以上的变量进行描述时应在此基础上进行比较,如变量多于两个应进行分类或有侧重的比较。
4极点说明。
即对图表中最高的、最低的点单独进行说明。
不以时间为比较基础的应注意对极点的描述。
5交点说明。
即对图表当中多根曲线的交点进行对比说明。
6不要不做任何说明就机械地导入数据,这不符合雅思的考试目的。
曲线图常用词汇动词—九大运动趋势一:表示向上:increase,rise,improve,grow,ascend,mount,aggrandize,goup,climb, take off, jump,shoot up暴涨,soar,rocket, skyrocket雅思英语图表作文范文第2篇It is said that countries are becoming similar to each other because of the global spread of the same products, which are now available for purchase almost anywhere. I strongly believe that this modern development is largely detrimental to culture and traditions worldwide.A country’s history, language and ethos are all inextricably bound up in its manufactured artefacts. If the relentless advance of international brands into every corner of the world continues, these bland packages might one day completely oust the traditional objects of a nation, which would be a loss of richness and diversity in the world, as well as the sad disappearance of t he manifestations of a place’s character. What would a Japanese tea ceremony be without its specially crafted teapot, or a Fijian kava ritual without its bowl made from a certain type of tree bark?Let us not forget either that traditional products, whether these be medicines, cosmetics, toy, clothes, utensils or food, provide employment for local people. The spread of multinational products can often bring in its wake a loss of jobs, as people urn to buying the new brand,perhaps thinking it more glamorous than the one they are used to. This eventually puts old-school craftspeople out of work.Finally, tourism numbers may also be affected, as travelers become disillusioned with finding every place just the same as the one they visited previously. To see the same products in shops the world over is boring, and does not impel visitors to open their wallets in the same way that trinkets or souvenirs unique to the particular area too.Some may argue that all people are entitled to have access to the same products, but I say that local objects suit local conditions best, and that faceless uniformity worldwide is an unwelcome and dreary prospect.Heres my full answer:The line graphs show the average monthly amount that parents in Britain spent on their children’s s porting activities and the number of British children who took part in three different sports from 2008 to is clear that parents spent more money each year on their children’s participation in sports over the six-year period. In terms of the number of children taking part, football was significantly more popular than athletics and 2008, British parents spent an average of around £20 per month on their children’s sporting activities. Parents’ spending on children’s sports increased gradually over the followi ng six years, and by 2014 the average monthly amount had risen to just over £ at participation numbers, in 2008 approximately 8 million British children played football, while only 2 million children were enrolled in swimming clubs and less than 1 million practised athletics. The figures for football participation remained relatively stable over the following 6 years. By contrast, participation in swimming almost doubled, to nearly 4 million children, and there was a near fivefold increase in the number of children doing athletics.剑桥雅思6test1大作文范文,剑桥雅思6test1大作文task2高分范文+真题答案实感。
雅思写作满分范文:雅思图表作文怎样才能拿满分
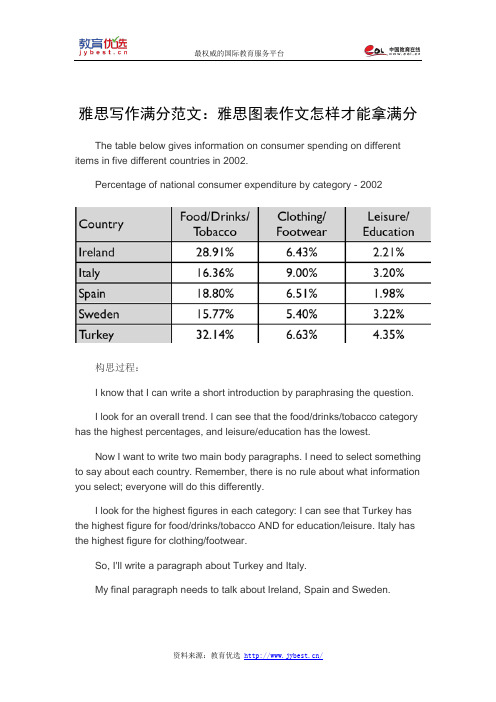
雅思写作满分范文:雅思图表作文怎样才能拿满分The table below gives information on consumer spending on different items in five different countries in 2002.Percentage of national consumer expenditure by category - 2002构思过程:I know that I can write a short introduction by paraphrasing the question.I look for an overall trend. I can see that the food/drinks/tobacco category has the highest percentages, and leisure/education has the lowest.Now I want to write two main body paragraphs. I need to select something to say about each country. Remember, there is no rule about what information you select; everyone will do this differently.I look for the highest figures in each category: I can see that Turkey has the highest figure for food/drinks/tobacco AND for education/leisure. Italy has the highest figure for clothing/footwear.So, I'll write a paragraph about Turkey and Italy.My final paragraph needs to talk about Ireland, Spain and Sweden.Maybe I'll point out that Ireland has a high figure for the first category, Spain has the lowest figure for education/leisure, and Sweden has the lowest figures for the first AND second categories.I don't need a conclusion because I have already mentioned a general trend in point 2.满分范文:The table shows percentages of consumer expenditure for three categories of products and services in five countries in 2002.It is clear that the largest proportion of consumer spending in each country went on food, drinks and tobacco. On the other hand, the leisure/education category has the lowest percentages in the table.Out of the five countries, consumer spending on food, drinks and tobacco was noticeably higher in Turkey, at 32.14%, and Ireland, at nearly 29%. The proportion of spending on leisure and education was also highest in Turkey, at 4.35%, while expenditure on clothing and footwear was significantly higher in Italy, at 9%, than in any of the other countries.It can be seen that Sweden had the lowest percentages of national consumer expenditure for food/drinks/tobacco and for clothing/footwear, at nearly 16% and just over 5% respectively. Spain had slightly higher figures for these categories, but the lowest figure for leisure/education, at only 1.98%.。
雅思写作之图表题答题技巧
雅思写作之图表题答题技巧
1.仔细审题
在开始写作之前,要认真阅读题目要求,明确图表的主题和要求,确保理解图表中的数据和信息。
2.确定图表类型
根据题目要求,确定图表类型,如柱状图、折线图、饼图等。
不同类型的图表有不同的写作要点和技巧,要熟悉每种类型的图表特点和写作方法。
3.概括图表主要特征
在描述图表之前,要概括图表的主要特征,如总体趋势、重要数据点等。
这有助于把握图表的整体情况,为后续的写作提供思路和方向。
4.描述图表细节
在描述图表时,要注意细节的描述,如数据的最大值、最小值、数据的波动情况等。
这些细节有助于让读者更好地理解图表中的数据和信息。
1
5.使用适当的图表语言
在描述图表时,要使用适当的图表语言,如“随着时间的推移”、“比例”、“增加”、“减少”等。
这些语言可以帮助读者更好地理解图表中的数据和趋势。
6.注意比较和对比
在描述图表时,要注意比较和对比不同数据点之间的关系和差异,这有助于突出数据的重点和特点。
7.总结和展望
在描述完图表后,可以总结图表中的信息和重点,并展望未来的趋势和发展。
这有助于让读者更好地理解图表的意义和价值。
以上是雅思写作图表题的答题技巧,考生可以在备考过程中多做练习,提高自己的图表分析和写作能力。
同时,也要注意积累词汇和表达方式,以便更好地应对不同类型的图表题目。
2。
雅思小作文图表题的分析技巧
雅思小作文图表题的分析技巧第一篇:雅思小作文图表题的分析技巧雅思小作文图表题的分析技巧柱状图:“比较”(找出similarity)和“对比”(找出difference),是写作的关键,既要横向总结所有柱状图表的共性特征,也要分别描写各个柱子的个性特征。
饼图:是所有图表题中最好写的一种,值得注意的是要处理好怎样丰富百分比的表达和“占”的表达。
不要一直用数字加百分比的格式,如25%。
特定的数字可以采取多样性的表达,如25%=a quarter of, 50%=half of, >50%=a,or the majority of。
曲线图:关键是把握好曲线的走向和趋势,学会general classification,即在第二段的开头部分对整个曲线进行一个阶段式的总分类,使写作层次清晰。
接下来在分类描述每个阶段的specific trend,同时导入数据作为你分类的依据。
注意不要不做任何说明就机械性的导入数据!可以使用一些比较native的单词和短语来描述trend。
表格题:考察例举数字的能力和方法。
注意怎样通过举一些有代表性的数据来有效地说明问题。
流程图:注意流程图里的“因果关系”或每一流程的“承前启后”关系;表达每一流程的主体内容,阐明这种关系;揭示其内在联系或规律;最后,给予简要归纳和总结。
以上美联英语学习网为各位考生整理了雅思小作文图表题的分析技巧,供考生们参考使用。
第二篇:雅思小作文---TASK1图表题雅思小作文TASK1图表题规律注意事项:1.Task1是客观写作,要求客观真实。
2.客观性:不应该有任何图里没有而靠自己主观想象加入的成分。
结尾段针对图形做出的总结性结论也应该是根据图表的实际内容做出的符合逻辑的总结。
准确性:图表里面的数据介绍要力求精确,不能抄错数字。
但当一个特征点没有落在一个准确的坐标值上时,允许进行合理的目测或估计一个大概数值。
详尽性:要有层次感,并不需要把所有的数字都推到文章里。
雅思写作饼图小作文满分
雅思写作饼图小作文满分雅思写作饼图小作文满分范文(通用20篇)饼图写作也是雅思写作常见的作文类型之一。
下面,店铺就为大家送上两篇雅思写作饼图小作文满分范文,希望对大家有用。
雅思写作饼图小作文满分篇1The pie charts compare visitors’ responses to a survey about customer service at the Parkway Hotel in 2005 and in 2010.It is clear that overall customer satisfaction increased considerably from 2005 to 2010. While most hotel guests rated customer service as satisfactory or poor in 2005, a clear majority described the hotel’s service a s good or excellent in 2010.Looking at the positive responses first, in 2005 only 5% of the hotel’s visitors rated its customer service as excellent, but this figure rose to 28% in 2010. Furthermore, while only 14% of guests described customer service in the hotel as good in 2005, almost three times as many people gave this rating five years later.With regard to negative feedback, the proportion of guests who considered the hotel’s customer service to be poor fell from 21% in 2005 to only 12% in 2010. Similarly, the proportion of people who thought customer service was very poor dropped from 15% to only 4% over the 5-year period. Finally, a fall in the number of ‘satisfactory’ ratings in 2010 reflects the fact that more people gave positive responses to the survey in that year. 雅思写作饼图小作文满分篇2The charts compare Korea, Sweden and the UK in terms of the methods used in each country to dispose of harmful waste.It is clear that in both the UK and Sweden, the majority of dangerous waste products are buried underground. By contrast,most hazardous materials in the Republic of Korea are recycled.Looking at the information in more detail, we can see that 82% of the UK’s dangerous waste is put into landfill sites. This disposal technique is used for 55% of the harmful waste in Sweden and only 22% of similar waste in Korea. The latter country recycles 69% of hazardous materials, which is far more than the other two nations.While 25% of Sweden's dangerous waste is recycled, the UK does not recycle at all. Instead, it dumps waste at sea or treats it chemically. These two methods are not employed in Korea or Sweden, which favour incineration for 9% and 20% of dangerous waste respectively.雅思写作饼图小作文满分篇3Dear Sir or Madam,I’m writing in response to the advertisement you placed in Shanghai Daily for the position of overseas mechanical engineer on Mon. Feb.23.I would like to apply for this post. I graduated with a Master’s degree in Machine-Building and Electronics Industries in Tsinghua University in 1999 and began my career in Zhongshan ABB Company as a young mechanical engineer. In 20XX, I was promoted to be the chief engineer, taking charge of the projects in Southeast Asia. I have been seeking for chances overseas in my majored domain in the hope that I can develop my potential further.If possible, I would like to choose a mechanical company with good reputation located in Chicago. I would also prefer small private companies which allow me to enjoy a larger space of promotion.The reason I made the decision above is that my husbandhas recently been relocated to Chicago by his company and I am, therefore, seeking a position in the same area in Chicago.I have enclosed my resume that outlines in detail my qualifications and experience as well as an open letter of recommendation from my former employer.Please give me a feedback at your earliest convenience if my qualifications meet your requirements.I look forward to hearing from you soon.Yours sincerely,Lucy Liu雅思写作饼图小作文满分篇4As a result of constant media attention, sports professionals in my country have become stars and celebrities, and those at the top are paid huge salaries. Just like movie stars, they live extravagantlifestyles with huge houses and cars.Many people find their rewards unfair, especially when comparing these super salaries with those of top surgeons or research scientists, or even leading politicians who have the responsibilityof governing the country. However, sports salaries are not determined by considering the contribution to society a person makes, or the level of responsibility he or she holds. Instead, they reflect the public popularity of sport in general and the level of public support that successful stars can generate. So the notion of ‘fairness’ is not the issue.Those who feel that sp orts stars’ salaries are justified might argue that the number of professionals with real talent are very few, and the money is a recognition of the skills and dedication a person needs to be successful. Competition is constant and a player is tested every time they perform. in their relatively short career. The pressure from the media is intense and there is littleprivacy out of the spotlight. So all of thesefactors may justify the huge earnings.Personally, I think that the amount of money such sports stars make is more justified than the huge earnings of movie stars, but at the same time, it indicatesthat our society places more value on sport than on more essential professions and achievements.译文在媒体不断地推波助澜下,我国的许多职业运动员已成为了明星和名人。
雅思写作流程图满分写法(参考模板)
雅思写作流程图满分写法朗阁海外考试研究中心丁仡然很多同学常常对雅思小作文流程图的写法感到困扰,虽然市场上有很多关于雅思流程图指导的书,但是笔者想要强调的是我们还是要用好剑桥1-10这十本最官方的书,仔细研究其中的考官范文就不难发现,其实流程图只是一只纸老虎,没有同学们想象的那么可怕。
本文中,朗阁海外考试研究中心的专家就为各位考生分析一篇剑桥10考官所写的最新流程图满分范文,希望借这篇文章对大家的雅思小作文有一定的帮助和提升!我们来看一下小作文题目(剑桥雅思10, Test 4, P101)The diagrams below show the life cycle of a species of large fish called the salmon.该图表描述了某一种大型鱼(三文鱼)的生命循环过程。
解题步骤:在写流程图的时候,大家首先要把题干看三遍,然后一定要花时间分析一下这幅图,一定要把图中每个步骤都看懂,然后深入理解每一步骤要表现的内容是什么。
注意:1. 图中所有的信息点都要讲到,不然会被重点扣分;2. 图中的信息千万不能写偏,不能写出和图中描述不符合的信息;3. 不要在小作文里面写自己的观点,这是很大的忌讳之处;4. 流程图也要写overview, 这点非常重要!这篇文章总体分为三段:第一段写了最上面的那个图:也就是三文鱼在上游时候最初的形态。
第二段写了中间和下面那个图:也就是三文鱼在下游和游到大海里,以及最后游回到出生地的过程。
第三段:整篇文章总体的overview和三幅图之间的比较和差异。
考官范文分析:在第一段里面考官在一开始就写到:salmon begin life as eggs on a pebbly riverbed, hidden among reeds in the slow-moving upper reaches of a river. 大家注意考官写的这句话是一种9分的流程图表达方式:就是用一句话把图中的好几个信息点都串进去,我们可以看到,这句话里面:图中有的salmon eggs, small stones, upper river slow moving都写进去了,所以从这句话中考生们可以学习一种技能,就是尽量一句话中多串几个图中的信息点。
- 1、下载文档前请自行甄别文档内容的完整性,平台不提供额外的编辑、内容补充、找答案等附加服务。
- 2、"仅部分预览"的文档,不可在线预览部分如存在完整性等问题,可反馈申请退款(可完整预览的文档不适用该条件!)。
- 3、如文档侵犯您的权益,请联系客服反馈,我们会尽快为您处理(人工客服工作时间:9:00-18:30)。
雅思写作满分范文:雅思图表作文怎样才能拿满分
The table below gives information on consumer spending on different items in five different countries in 2002.
Percentage of national consumer expenditure by category - 2002
构思过程:
I know that I can write a short introduction by paraphrasing the question.
I look for an overall trend. I can see that the food/drinks/tobacco category has the highest percentages, and leisure/education has the lowest.
Now I want to write two main body paragraphs. I need to select something to say about each country. Remember, there is no rule about what information you select; everyone will do this differently.
I look for the highest figures in each category: I can see that Turkey has the highest figure for food/drinks/tobacco AND for education/leisure. Italy has the highest figure for clothing/footwear.
So, I'll write a paragraph about Turkey and Italy.
My final paragraph needs to talk about Ireland, Spain and Sweden.
Maybe I'll point out that Ireland has a high figure for the first category, Spain has the lowest figure for education/leisure, and Sweden has the lowest figures for the first AND second categories.
I don't need a conclusion because I have already mentioned a general trend in point 2.
满分范文:
The table shows percentages of consumer expenditure for three categories of products and services in five countries in 2002.
It is clear that the largest proportion of consumer spending in each country went on food, drinks and tobacco. On the other hand, the leisure/education category has the lowest percentages in the table.
Out of the five countries, consumer spending on food, drinks and tobacco was noticeably higher in Turkey, at 32.14%, and Ireland, at nearly 29%. The proportion of spending on leisure and education was also highest in Turkey, at 4.35%, while expenditure on clothing and footwear was significantly higher in Italy, at 9%, than in any of the other countries.
It can be seen that Sweden had the lowest percentages of national consumer expenditure for food/drinks/tobacco and for clothing/footwear, at nearly 16% and just over 5% respectively. Spain had slightly higher figures for these categories, but the lowest figure for leisure/education, at only 1.98%.。