Characterization of T-DNA insertion patterns in the genome
PA 随机扩增DNA基因分型步骤

PA 随机扩增DNA基因分型步骤
一、煮沸法制备DNA模板
1.将菌体复活后接种于哥伦比亚血平板上,37℃过夜培养。
2.从哥伦比亚血平板上取适量菌落溶于1ml灭菌双蒸水中,调整菌体浊度为5个麦氏单位;
3. 100℃水煮10min;
4.12000rpm,离心5min;
5.取上清至1.5mL管中,作为DNA模板,保存于-20℃。
回收得到的DNA片段可用琼脂糖凝胶电泳和紫外分光光度计检测浓度与纯度。
DNA应在OD260处有显著吸收峰,OD260值为1相当于大约50μg/ml双链DNA、40μg/ml单链DNA。
OD260/OD280比值应为1.7~1.9,如果洗脱时不使用洗脱缓冲液,而使用去离子水,比值会偏低,因为pH值和离子会影响光吸收值,但并不表示纯度低。
二、用引物扩增整合子PCR反应体系:
93℃预变性2min,然后按93℃30s →65℃ 30s→ 72℃ 60s共循环35个周期,最后1个72℃延长至2min,纯水为阴性对照,产物长度为300bp。
三、结果观察
取10μl扩增产物,点样于2%琼脂糖凝胶(含0.5mg/L的溴已啶)中,以80V电压电泳30min,用紫外投射反射分析仪照相保存。
【精品】HI-TAIL-PCR完整版

RB-1a:ACGATGGACTCCAGTCCGGCCTGTTGCCGGTCTTGCGATGATTATCA
produce a suppression-PCR effect
RB-2a:GTAATGCATGACGTTATTTATGAGATGGGTT
2.2 Rationale of hiTAIL-PCR
LAD-1: ACGATGGACTCCAGAGCGGCCGC(G/C/A)N(G/C/A)NNNGGAA
16nt tail
AC1: ACGATGGACTCCAGAG
NotⅠ
six or seven four fixed degenerate nucleotides nucleotides
RB-0a: GGCAATAAAGTTTCTTAAGATTGAATCCTGT
secondary TAIL-PCR • Primer: RB-2a AC1
6-7 super cycles
3. Application of hiTAIL-PCR
3.1 hiTAIL-PCR for amplification of unknown flanking sequences
Figure 1. Primers used for high-efficiency thermal asymmetric interlaced PCR (hiTAIL-PCR). RB-0a, RB-1a, and RB-2a are specific to pCAMBIA binary vectors (such as pCAMBIA-1305.1) having the Nos terminator sequence adjacent to RB. RB-0b, RB-1b, and RB-2b are specific to pCAMBIA-1300. In the sequence tag of RB-1a (RB-1b), two bases (underlined) were designed to differ from the 3′ end of AC1 in order to avoid the priming of AC1 on this sequence tag in the secondary TAIL-PCR, and in sequencing of the primary TAIL-PCR products from the AC1-end with AC1 as the sequencing primer.
拟南芥T-DNA插入突变
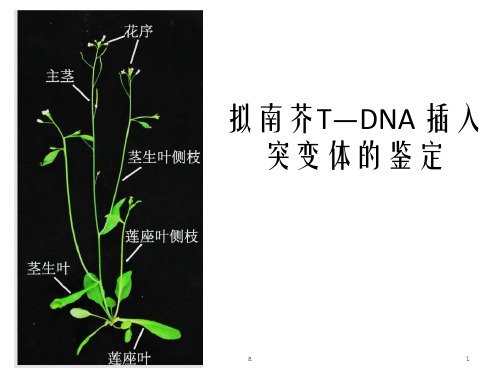
Virulence proteins recognise the border sequences (LB、RB)that define the T-DNA.
a
12
(3)筛选纯和合突变体 实1、验实方验案方设案计设计
• 1.确定所要研究的基因 通过生物信息学的方法推测出一些可能具 有赤霉素糖基转移酶的基因。
• 2.获得种子 进入如下网站/index.jsp,输入
种子基因型号。
a
13
(3)筛选纯和 合突变体
实验方案设计
a
6
2、反向遗传学的重要手段——T-DNA插入突变技术
the mechanism of T-DNA insertion
• In the plant cell, the T-DNA is coated with the single-stranded DNA-binding protein, VirE2.
•
在多个生长阶段发挥作用的基因,其突变可能导致早期胚 致死效应,因而也无法鉴定。
• 瞬间表达的基因、低水平表达的基因,以及在少数细胞中 表达的基因,都很难用基因敲除突变体鉴定。
(Patrick J. Krysan et al,1999 )
(赵霞,周波等,2009)
a
33
(4)表型鉴定
表型鉴定应对策略
a
11
• 目前已经完成测序的植物有三种:拟南芥 、水稻、毛果杨(Populus trichocarpa)。
Activation Tagging Identifies a Conserved MYB Regulator of
The Plant Cell, Vol. 12, 2383–2393, December 2000, © 2000 American Society of Plant Physiologists Activation Tagging Identifies a Conserved MYB Regulator of Phenylpropanoid BiosynthesisJustin O. Borevitz,a,1 Yiji Xia,a,b,1 Jack Blount,b Richard A. Dixon,b and Chris Lamb a,2a Plant Biology Laboratory, Salk Institute for Biological Studies, La Jolla, California 92037b Plant Biology Division, Samuel Roberts Noble Foundation, Ardmore, Oklahoma 73401Plants produce a wide array of natural products, many of which are likely to be useful bioactive structures. Unfortu-nately, these complex natu ral produ cts u su ally occu r at very low abu ndance and with restricted tissu e distribu tion,thereby hindering their evaluation. Here, we report a novel approach for enhancing the accumulation of natural prod-ucts based on activation tagging by Agrobacterium-mediated transformation with a T-DNA that carries cauliflower mo-saic virus 35S enhancer sequences at its right border. Among ف5000 Arabidopsis activation-tagged lines, we found a plant that exhibited intense purple pigmentation in many vegetative organs throughout development. This upregulationof pigmentation reflected a dominant mu tation that resu lted in massive activation of phenylpropanoid biosyntheticgenes and enhanced accumulation of lignin, hydroxycinnamic acid esters, and flavonoids, including various anthocya-nins that were responsible for the purple color. These phenotypes, caused by insertion of the viral enhancer sequencesadjacent to an MYB transcription factor gene, indicate that activation tagging can overcome the stringent genetic con-trols regulating the accumulation of specific natural products during plant development. Our findings suggest a func-tional genomics approach to the biotechnological evaluation of phytochemical biodiversity through the generation ofmassively enriched tissue sources for drug screening and for isolating underlying regulatory and biosynthetic genes. INTRODUCTIONEthnobotany and limited screens of medicinal plants indi-cate that the huge repertoire of chemical diversity in plants contains many potentially useful bioactive structural princi-ples for developing novel drug s, flavors, frag rances, and other specialty chemicals. Unfortunately, these complex natural products usually occur in very low abundance and with a restricted tissue distribution. Moreover, almost all of this phytochemical biodiversity resides in exotic, unculti-vated species. Whereas drug s such as taxol, vinblastine, and vincristine illustrate the potential of plants as sources of new drugs, the development of rational approaches for the g eneration of useful amounts of complex natural products for industrial evaluation remains an unsolved problem. In particular, an intense 30-year effort using cell and tissue cul-tures from medicinal plants has failed to g enerate useful quantities of complex products for the commercial produc-tion of established drugs in vitro or for high-throughput, mul-tiplex screening of phytochemicals (Facchini and Deluca, 1995; McCaskill and Croteau, 1998). This failure probably reflects the string ent spatial and temporal transcriptional controls governing the biosynthesis of specific natural prod-ucts during plant development (Fowler, 1983; Robins, 1994; Facchini and Deluca, 1995). Transg enic manipulation to override these genetic controls thus may provide the key to enhancing natural product biosynthesis for industrial evalu-ation and exploitation.Activation tagging with the enhancer from the cauliflower mosaic virus 35S transcript promoter (35Se) is an emerging technology in plant functional genomics (Weigel et al., 2000). This approach, based on Agrobacterium-mediated transfor-mation, can create transgenic plants in which the T-DNA car-rying 35Se at its right border is spliced into the plant genome at random sites. In each independent transgenic line, 35Se strongly activates the plant gene to which, by chance, it lies adjacent. Activation of a gene in this fashion may lead to ob-servable effects on the modified plant, providing important clues about the function of the activated g ene. Screening larg e collections of independent, activation-tag g ed lines thus represents a powerful way of surveying the g enome and isolating genes that affect traits of interest.Using activation tagging, we have isolated a bright-purple mutant, pro ductio n o f antho cyanin pigment 1-Dominant (pap1-D), in which genes encoding enzymes involved in the biosynthesis of phenylpropanoid natural products exhibit massive and widespread activation throughout plant de-velopment. The pap1-D phenotype, which is caused by1These authors contributed equally to this work.2To whom correspondence should be addressed. E-mail mb @; fax 44-1603-456844.2384The Plant CellFigure 1.pap1-D Phenotypes.(A)pap1-D (left) and Col-0 (right) flowers.(B) Roots of pap1-D (left) and Col-0 (right) plants.(C) Six-week-old adult pap1-D (front) and Col-0 (back) plants.Activation Tagging of PAP12385 overexpression of a g ene encoding an MYB transcriptionfactor, indicates that activation tagging can be used to over-come the stringent genetic controls regulating the develop-mental accumulation of specific natural products. Thesefindings suggest a new approach for the systematic biotech-nological evaluation of phytochemical biodiversity through theg eneration of massively enriched tissue sources for drugscreening and for isolation of the underlying regulatory andbiosynthetic genes.RESULTSMutant CharacterizationApproximately 5000 activation-tagged primary lines of Ara-bidopsis ecotype Columbia (Col-0) were generated by usingpSKI015, which contains four copies of 35Se at the rig htborder of the T-DNA, pBluescript KSϩ for plasmid rescue,and the BAR g ene for Basta resistance as a selectablemarker (Kardailsky et al., 1999; Weigel et al., 2000). A singlebright-purple plant was observed in this collection, and itsseed was collected for prog eny analysis. T2 plants seg re-g ated for the purple coloration characteristic of anthocya-nins in a 3:1 ratio, which is consistent with this trait being determined by a single dominant allele, an allele we named pap1-D (see above). The whole plant, including the roots, stems, leaves, primary and secondary branches, and cauline leaves as well as sepals, anthers, and carpels, ex-hibited purple pigmentation (Figures 1B and 1C). The purple coloration was more pronounced when plants were grown under high-intensity light or other stress conditions, such as droug ht and pathog en infection (data not shown). Under these conditions, leaves and stems of wild-type plants also show a slig ht pig mentation, sug g esting that the pap1-D phenotype might in part reflect enhancement of an endoge-nous stress response. However, we never observed pig-mentation in the roots of wild-type plants—in marked contrast to the strong pigmentation at the base of pap1-D roots (Fig ure 1B). Except for very weak pig mentation in flower petals (Figure 1A), enhanced pigmentation in pap1-D was observed throughout development. No other morpho-logical phenotypes were observed.Because anthocyanins are a subclass of flavonoid natural products derived from the phenylpropanoid skeleton, we examined the expression of phenylpropanoid biosynthetic g enes and the accumulation of natural products. RNA g el blot analysis showed massive enhancement of the expres-sion of phenylpropanoid biosynthetic g enes in pap1-D plants (Figure 2). The amounts of transcripts encoding chal-cone synthase (CHS), the entry point enzyme into the fla-vonoid branch pathway, and dihydroflavonol reductase, an enzyme of flavonoid biosynthesis specific for anthocyanins, were greater in pap1-D plants than in wild-type Col-0 plants.Transcripts encoding g lutathione S-transferase, which has been implicated in the transport of anthocyanins into the vacuole (Alfenito et al., 1998), also were expressed in in-creased amounts. Moreover, the accumulation of tran-scripts that encode phenylalanine ammonia-lyase (PAL), the first enzyme of the overall phenylpropanoid biosynthetic pathway, also was markedly enhanced, indicating that tran-scriptional activation was not confined to the flavonoid branch.To determine the extent of changes in anthocyanins and other phenylpropanoid-derived compounds in pap1-D, we extracted and analyzed soluble and cell wall–bound phe-nolic compounds by HPLC. Analysis of the soluble fraction, which was obtained by extraction in acetone, revealed sev-eral quantitative differences between pap1-D and wild-type Col-0 plants—in particular, increased concentrations of cer-tain flavonol g lycosides, including Glc-rhamnose (Rha)-quercetin, Glc-Rha-kaempferol, and unidentified conjugates of kaempferol and quercetin (Figures 3A and 3B). After alka-line hydrolysis of the residue that was obtained after ace-tone extraction, one portion was freeze-dried for analysis of anthocyanidins (anthocyanin aglycones); the remainder was partitioned into ethyl acetate for determination of cell wall–bound hydroxycinnamic acids. Anthocyanidins were present in g reater concentrations in pap1-D than in Col-0 (Fig ures 3C and 3D), as were coumaric and sinapic acids measured in alkaline hydrolysates of the wall-bound phenolic fraction (Fig ures 3E and 3F). Thus, pap1-D is characterized by strongly increased concentrations of glycosylated anthocya-nins, flavonols, and cell wall–esterified hydroxycinnamic acidsin comparison with wild-type Col-0.Figu re 2.Enhanced Expression of Phenylpropanoid Biosynthetic Genes in pap1-D.RNA g el blot hybridization was conducted with total RNA isolated from 6-week-old pap1-D and Col-0 wild-type plants. DFR, dihydrofla-vonol reductase; GST, glutathione S-transferase; UBQ, ubiquitin.2386The Plant CellThe observation of increased wall-bound hydroxycin-namic acids in pap1-D prompted us to measure the content and composition of lignin, which is derived from hydroxycin-namic acid precursors. Lig nin was analyzed by derivati-zation followed by reductive cleavag e, which helps to determine the absolute amounts of guaiacyl (G, monomethyl-ated) and syringyl (S, dimethylated) lignin monomers (Lu and Ralph, 1997). The results in Table 1 indicate increases in both total G and total S residues in the cell wall fraction of pap1-D compared with those in Col-0, but the S/G ratio var-ied little. The change in lignin monomers could reflect an in-crease in lignin content or a change in composition that led to more efficient monomer extractability.Changes in lignin content and composition have been en-g ineered in transg enic plants by downreg ulation of PAL,caffeic acid O -methyltransferase, and caffeoyl-CoA O -meth-yltransferase, enzymes of the lig nin branch of phenylpro-panoid biosynthesis (Atanassova et al., 1995; Zhong et al.,1998). PAL activity in stems of pap1-D plants was approxi-mately twice that found in stems of wild-type plants,whereas the activities of the two O -methyltransferases dif-fered little between the two (Table 1). Thus, the changes in lig nin composition and increased concentrations of wall-bound sinapic acid in pap1-D reflect the change in PAL ac-tivity but do not appear to be associated with increases in lignin O -methyltransferase activities.The Arabidopsis transparent testa glabra1-1 ( ttg1-1 ) mu-tation blocks anthocyanin accumulation and trichome for-mation (Koornneef, 1981). TTG1 encodes a WD40 repeat protein homolog ous with an AN11-encoded protein from petunia, which also controls anthocyanin production (deVetten et al., 1997; Walker et al., 1999). To test the geneticFigure 3.Effect of pap1-D Mutation on Accumulation of Phenylpropanoid Products.(A) to (F) HPLC profiles of phenylpropanoid metabolites in extracts from wild-type Col-0 ([A], [C], and [E]) and pap1-D ([B], [D], [F]) plants.(A) and (B) Soluble phenolics: peak 1, rhamnose (Rha)-Glc-Rha-quercetin; peak 2, quercetin conjugate; peak 3, Rha-Glc-Rha-kaempferol; peak 4, Glu-Rha-quercetin; peak 5, Rha-Rha-quercetin; peak 6, Glc-Rha-kaempferol; peaks 7 and 8, kaempferol conjugates; peak 9, sinapic acid;peak 10, Rha-Rha-kaempferol.(C) and (D) Anthocyanidins; the inset in (D) shows the UV light absorption spectrum of the major anthocyanidin eluting at 21.5 min.(E) and (F) Wall-bound phenolics: peak 1, trans -4-coumaric acid; peak 2, sinapic acid; peak 3, cis -4-coumaric acid.Activation Tagging of PAP12387relationship between TTG1 and PAP1, we crossed ttg1-1 with pap1-D. The pap1-D allele was tracked by Basta resis-tance, and the ttg1-1 mutation was scored visibly. The dou-ble mutant F2 plants failed to accumulate anthocyanins, indicating that TTG1 is required for the production of antho-cyanins mediated by PAP1 overexpression and acts either downstream from or at the same step as PAP1.Cloning of PAP1In a population of Ͼ100 seg reg ating T2 plants, each plant that had the pap1-D phenotype showed resistance to Basta, and all plants with a wild-type phenotype (i.e., lacking purple pig mentation) were sensitive to Basta, indicating that the mutation was tightly linked to the T-DNA insert. Moreover, hybridization of DNA gel blots of pap1-D genomic DNA that had been digested with EcoRI or KpnI showed that the 35Se sequences were localized to single fragments of 10 and 12 kb, respectively (data not shown), indicating that the mutant contained a single, simple insertion. The 12-kb KpnI and 10-kb EcoRI fragments were cloned by plasmid rescue (Weigel et al., 2000), g enerating pPAP1-K1 and pPAP1-E1, respec-tively. Nucleotide sequencing and restriction analysis showed that the 12-kb KpnI frag ment fully overlapped the smaller EcoRI frag ment. Probing the Arabidopsis CD4-7 cDNA li-brary at high stringency with pPAP1-K1 resulted in isolation of a single 956-bp cDNA, which defined three exons in the genomic DNA of pPAP1-K1 encoding an MYB transcription factor (Figures 4A and 4B). In the pap1-D line, the 35Se se-quences had inserted 5.1 kb 3Ј to the start of this gene, des-ignated PAP1, and RNA gel blot hybridization with the PAP1 cDNA revealed a sing le 1-kb transcript, which was mas-sively overexpressed in the pap1-D mutant (Figure 4C).To confirm that overexpression of PAP1 caused the pap1-D phenotype, we cloned a 3-kb g enomic frag ment spanning the three PAP1 exons and flanking sequences into pMN20-2, which contains two copies of 35Se (Weig el et al., 2000), thereby creating pMN-PAP1. Transformation of wild-type Col-0 with this construct, which mimics the g enomic con-text of the pap1-D allele, generated multiple transgenic lines with the characteristic purple phenotype (Fig ure 5B). As would be expected from position effects, these transgenic lines represented an allelic series ranging from the wild type to an even more intense phenotype than pap1-D, in some cases having strong purple pigmentation in the petals (Fig-ure 5E). In contrast, transformation with pMN20-2 as an empty vector control gave no enhanced pigmentation phe-notype (Figures 5A and 5D).Sequence alig nments with the Arabidopsis databases showed that PAP1 is a member of the R2, R3 MYB family, which is estimated to have Ͼ100 members in Arabidopsis (Kranz et al., 1998; Romero et al., 1998) and Ͼ80 membersin maize (Rabinowicz et al., 1999). PAP1 is identical to ATMYB75 (Kranz et al., 1998) except that ATMYB75 con-tains a sequencing error (1-bp deletion at position 695), cre-ating an early stop codon. The PAP1 protein shares hig h homology with other MYB-like transcription factors that reg-ulate anthocyanin production (Figures 4B and 4D). PAP1 is closely related to the product of the petunia AN2 g ene, showing 82% identity throug h the MYB reg ion and 50% identity overall. The products of the maize anthocyanin MYB genes C1 and pl are 64% identical through the MYB region, with 38% identity overall. The MYB transcription factor GLABAROUS1 from Arabidopsis and MIXTA from snap-dragon both control trichome development (Oppenheimer et al., 1991; Glover et al., 1998) and are each 58% identical to PAP1 in the MYB domain and 33% identical overall. A phy-log enetic tree constructed with these full-leng th MYB pro-teins shows that PAP1 belong s to a branch involved in anthocyanin biosynthesis (Figure 4D).The PAP1 gene was mapped to 0.2 centimorgan (cM) up from mi303 at 83.7 cM on chromosome 1 by using an Xba1 restriction frag ment leng th polymorphism and the Col/Ler recombinant inbred lines (Nottingham University Stock Cen-tre, Nottingham, UK). The sequencing project recently came to PAP1 on bacterial artificial chromosome F25P12 just be-low mi303 at 85 cM.PAP2Also discovered in the Arabidopsis database was 193M15, an expressed sequence tag with very hig h homolog y withTable 1.Enhanced PAL Activity and Lignin Levels in pap1-D PlantsPlant PAL Activity(mkat/g FW)aStemCOMT b Activity(kat/g FW)StemCCOMT c Activity(pkat/g FW)StemLignin CompostionTotal G(mol/g)Total S(mol/g)Total G and S(mol/g)S/GWild type30.544.250.421.6 2.524.10.12 pap1-D70.344.460.630.6 5.035.60.16a FW, fresh weight; kat, katal.b COMT, caffeic acid O-methyltransferase.c CCOMT, caffeoyl-CoA O-methyltransferase.2388The Plant CellFigure 4.Molecular Characterization of PAP1.Activation Tagging of PAP12389PAP1. 193M15 encodes a protein with 93% identity to PAP1 in the MYB domain and 77% identity overall. To test whether overexpression of 193M15 also could cause the production of anthocyanin pig ments, we made a 35S pro-moter::cDNA fusion construct, pCHF3-PAP2. Transgenic plants containing pCHF3-PAP2 had purple leaves and stems (Fig-ure 5C), althoug h the pig mentation was somewhat weaker than that of the pap1-D mutant or some pMN-PAP1 lines. In view of the sequence similarity between the PAP1 protein and that encoded by 193M15 (Figures 4B and 4D) and similar overexpression phenotypes (Fig ure 5C), we named the 193M15 cDNA PAP2. PAP2 is on bacterial artificial chromo-some T27F4 near mi424 on chromosome 1, ف9 cM below PAP1. PAP2 is also a member of the Arabidopsis MYB family reported as ATMYB90 (Kranz et al., 1998).Overexpression of PAP1 and PAP2 in TobaccoTo test whether PAP1 and PAP2 could enhance pigmenta-tion in other plants, we transformed tobacco cv xanthi with pCHF3-PAP1 and pCHFS-PAP2. Both constructs g ener-ated purple tobacco plants, indicating that the Arabidopsis PAP1 and PAP2 genes could activate production of antho-cyanin pig ments in another species (Fig ures 5G and 5H). These transgenic tobacco plants also produced flowers with much more pig mentation than did the pCHF3 transg enic control plants (Figures 5I and 5J). Tobacco transformed with pCHF3 as an empty vector control did not have an in-creased pigmentation phenotype (Figures 5F and 5I). DISCUSSIONAccumulation of phenylpropanoid products during develop-ment is under tight transcriptional regulation, and the pap1-D phenotype represents a striking override of these g enetic controls. Thus, specific tranches of the overall pathway ap-pear to be controlled by separate sets of transcription fac-tors. For example, the maize myb g enes C1 and pl are involved in the reg ulation of anthocyanin synthesis from CHS onward but do not regulate PAL and other genes of the upstream central pathway (Cone et al., 1993a, 1993b; Mol et al., 1996), whereas P independently controls the 3-deoxy flavonoid branch pathway (Grotewold et al., 1994). In con-trast, the pap1-D phenotype, which results from overex-pression of the PAP1 MYB transcription factor, reflects massively enhanced expression of PAL as well as CHS, the g ene encoding dihydroflavonol reductase, and the g lu-tathione S-transferase gene. This broad transcriptional acti-vation of the overall pathway is accompanied by a corresponding ly broad pattern of enhanced product accu-mulation with increases in lig nin, wall-bound hydroxycin-namic acid esters, flavonols, and anthocyanins. Moreover, pathway activation in pap1-D was observed in all vegetative organs and maintained throughout development, in marked contrast to activation in wild-type plants of individual branch pathways at defined developmental stages and with charac-teristic cell-type, tissue-type, and organ specificities (Graham, 1991; Grotewold et al., 1994). The relatively modest in-crease in lig nin content probably reflects a major control point at the polymerization stag e (Bate et al., 1994) with consequent spillover of lig nin monomers and their precur-sors, which contributes to the marked accumulation of wall-bound hydroxycinnamic acid esters in pap1-D.MYB genes contribute to the control of flavonoid biosyn-thesis in a wide range of plant species, often in combination with other regulatory genes. The extensive sequence simi-larity with AN2, c1, and pl, together with the overexpression phenotypes, suggests that PAP1 and PAP2 may be the Ara-bidopsis orthologs of these petunia and maize myb genes, with genetically defined functions in phenylpropanoid regu-lation. In maize, c1 and pl but not P require R and B, encod-ing basic helix-loop-helix proteins, to activate transcription of maize flavonoid biosynthetic genes (Mol et al., 1996). Ba-sic helix-loop-helix proteins and MYB proteins also function together in the control of flower pigmentation in snapdragon (Goodrich et al., 1992) and petunia (Quattrocchio et al., 1998). Moreover, the WD40 proteins TTG1 and AN11 are re-quired for MYB control of flavonoid biosynthesis in bothFigure 4.(continued).(A) Genomic context of T-DNA insertion in pap1-D and structure of pMN-PAP1. Basta r, Basta resistance; Kan r, Kanamycin resistance; LB, left border; pBS, pBluescript KSϩ plasmid; RB, right border; 4 ϫ 35S denotes four copies of 35Se.(B) Sequence homology of R2R3 MYB. Proteins were aligned using the ClustalW software program. Red shading denotes 100% conserved res-idues, and yellow shading denotes matching residues with PAP1. R2 and R3 MYB domains are shown. GenBank accession numbers PAP1 (AF325123), PAP2 (AF325124), AN2 (AAF66727), C1 (AAA33482), P1 (AAB67720), P (AAC49394), GL1 (P27900), Mixta (CAA55725), and c-myb (AAA52031).(C) Gel blot hybridization of total RNA from 4-week-old pap1-D and Col-0 plants.1.0 denotes transcript size in kilobases.(D) Neighbor-joining phylogenetic tree built by using full-length proteins, showing the anthocyanin MYB family branch. The human gene c-myb is used as an outgroup.2390The Plant CellArabidopsis and petunia (de Vetten et al., 1997; Larkin et al.,1999; Walker et al., 1999), and the pap1-D phenotypes re-quire the WD40 gene TTG1. Despite the stringent and often complex g enetic control of phenylpropanoid biosynthesis,strong overexpression of PAP1 in the pap1-D line was suffi-cient to hyperactivate the pathway, which is reminiscent of the enhancement of flavonoid biosynthesis by deliberate ectopic expression of P in suspension cultures of maize cells (Grotewold et al., 1999). The pap1-D phenotypes may reflect involvement of PAP1 as the limiting factor in a novel reg ulatory circuit with atypically broad control functions in phenylpropanoid biosynthesis or may indicate functional spillover from one regulatory circuit to related circuits when PAP1 is massively overexpressed.A recent report describes the use of activation tagging in Catharanthus cell cultures to isolate ORCA3, a jasmonate-responsive transcriptional regulator of primary and second-ary metabolism, the upregulation of which promotes biosyn-thesis of indole alkaloids (Van der Fits and Memelink, 2000).These data, along with the present finding s, indicate that activation tag g ing can be used to g enerate novel g ain-of-function mutations that affect complex biosynthetic path-ways under polygenic control; as such, this presents a po-tentially powerful new approach for isolating the genes that reg ulate biosynthesis of plant natural products. Loss-of-function screens for transparent testa have been saturated,and no mutations map to the PAP1 or PAP2 loci (Shirley et al., 1995). Moreover, examination of Ͼ100 PAP1 antisense lines showed no visible phenotype (data not shown). The similar overexpression phenotypes of PAP1 and PAP2 sug-gest that these genes may be functionally redundant, such that only activation tagging or some other gain-of-function screen could have readily revealed their key attributes.Activation tag g ing as a g ene discovery tool based on g ain-of-function is intrinsically oriented toward biotechno-logical utility, and the ability to activate a biosynthetic path-way that will lead to the enhanced accumulation of several distinct subclasses of natural products has several impor-tant potential applications. Thus, hyperactivated tissues or org ans provide massively enriched sources for passag e through multiplex drug screens with the potential for discov-ery of novel activities based on what combinatorial effectsFigure 5.Overexpression of PAP1 or PAP2 Enhances Pigmentation in Arabidopsis and Tobacco.(A) to (E) Arabidopsis plants transformed with pMN20-2 ([A] and [D]), pMN-PAP1 ([B] and [E]), and pCHF3:PAP2 (C). (A) to (C) show six-week-old plants. (D) and (E) show flowers on 12-week-old plants.(F) to (J) Tobacco plants transformed with pCHF3 ([F] and [I]), pCHF3:PAP1 (G), and pCHF3:PAP2 ([H] and [J]). Plantlets in (F) to (H) were pho-tographed at age 4 weeks, and flowers in (I) and (J) at 10 weeks after transfer to soil. pCHF3-PAP1 plants had brilliant flower pigmentation, iden-tical to that of pCHF3-PAP2 (data not shown).Activation Tagging of PAP12391might arise from complex mixtures as well as allowing con-venient isolation and characterization of individual bioactive components. This approach in principle could be aug-mented by feeding studies using pathway intermediates or synthetic derivatives. Moreover, activation of phenylpro-panoid biosynthesis in pap1-D reflects massively enhanced expression of g enes encoding pathway enzymes; hence, these tissues provide a correspondingly enriched source for isolating the cDNAs that encode key biosynthetic enzymes not readily identified by biochemical approaches.Although the plant kingdom has a remarkable diversity of natural products, the underlying pathway regulatory mecha-nisms appear to be at least partially conserved between species (Mol et al., 1996; Quattrocchio et al., 1998). For ex-ample, the maize anthocyanin reg ulatory g ene R functions appropriately when expressed in Arabidopsis or tobacco (Lloyd et al., 1992). Likewise, ectopic expression of PAP1 or PAP2 in transg enic tobacco caused phenotypes similar to those observed in Arabidopsis. Therefore, convenient, readily transformed genetic model species, such as Arabi-dopsis, can be used to isolate candidate regulatory genes for direct evaluation in medicinal plants and other exotic species or as a platform for the identification of ortholog s and potentially useful, related genes in target species.The serendipitous discovery of pap1-D among a larg e collection of activation-tag g ed lines was possible because activation of PAP1 enhanced the accumulation of anthocya-nin pigments, which was easily scored. Several other plant natural products, such as the isoprenoids lycopene and car-otene and the alkaloid sang uinarine, also are colored. Hence, genetic activation of these tranches of plant metab-olism also could be scored by visual inspection, but this is not a generally applicable approach. In principle, activation-tag g ed lines with enhanced accumulation of natural prod-ucts of interest could be identified by high-throughput meta-bolic profiling. However, a more promising general strategy may be to make transg enic plants that express easily screened marker genes under the control of promoters from g enes encoding enzymes involved in the biosynthesis of natural products of interest.METHODSPlant Growth and TransformationArabidopsis thaliana ecotype Columbia (Col-0) plants were grown in growth rooms at 22ЊC in long days (16 hr of light) or short days (9 hr of light) and received 250 E from three 35-W cool white bulbs and one 35-W Sylvania GrowLux bulb (Osram Sylvania, Danvers, MA). Nico tiana tabacum cv xanthi plants were reg enerated under 24-hr-light conditions at 25ЊC and then transferred to the greenhouse. Tobacco and Arabidopsis transformation was performed as previ-ously described (Neff et al., 1999; Weig el et al., 2000) except that 0.02% Silwet-L77 (Lehle Seeds, Round Rock, TX) was used for the latter. Basta was obtained from AgrEvo (Montvale, NJ).Gel Blot HybridizationDNA and RNA gel blot hybridizations were performed according to standard procedures (Sambrook et al., 1989). RNA samples used in the gel blot analysis shown in Figure 2 were from vegetative leaves of pap1-D and Col-0 plants g rown under short-day conditions for 4 weeks and long-day conditions for 2 weeks. Probes were full-length cDNA fragments of PAP1, the glutathione S-transferase gene, and the g ene encoding ubiquitin. The chalcone synthase (CHS) probe was a polymerase chain reaction product amplified by using the primers 5Ј-TGGTCTCCGTCCTTCCGTCAA and 5Ј-CCCTCAAATGTCCGT-CTATGGAA. The phenylalanine ammonia-lyase (PAL) probe was am-plified by using the primers 5Ј-CTATACGCTTACCTACCAACAAAC and 5Ј-TCTCCGATGAGAAGTAGCACCAA, and the dihydroflavonol reductase probe was amplified with primers 5Ј-AAAAAGATGACA-GGATGGGT-3Ј and 5Ј-CCCCTGTTTCTGTCTTGTTA-3Ј.Enzyme AssaysPAL activity was measured by using a microcuvette spectrophoto-metric assay (Blount et al., 2000). Caffeic acid O-methyltransferase and caffeoyl-CoA O-methyltransferase activities were assayed by standard methods (Inoue et al., 1998). Protein concentrations were determined by the procedure of Bradford (1976).Phenylpropanoid AnalysisSoluble and wall-bound phenolics in whole-plant extracts as well as extracts of individual tissues were analyzed by HPLC (Blount et al., 2000). The aqueous phase, which remained after ethyl acetate ex-traction of the wall-bound phenolics, was lyophilized and resus-pended in 70% methanol for analysis. The HPLC eluates were monitored by absorbance at 270, 310, and 550 nm, and the peaks were identified by comparing their retention times and UV light spec-tra with those of known standards. Lignin was assayed by derivatiza-tion followed by reductive cleavage (Lu and Ralph, 1997).pMN-PAP1, pCHFS-PAP1, and pCHFS-PAP2 ConstructsA PAP1 genomic fragment was amplified by using 5Ј-AACTACTGC-AGCTAGAGCGTAGAGG-3Ј and 5Ј-TCAAACTGCAGAAACTAAGCC-CA-3Ј to construct 5Ј and 3Ј Pst sites. This fragment was cloned into pMN20-2 (Weigel et al., 2000), which contains two copies of 35Se to create pMN-PAP1. PCHF3-PAP1 was created by amplifying the PAP1 cDNA with primers 5Ј-ACTGGTACCTTTTACAATTTGTTTA-3Јand 3Ј-AAGGGATCCTATACACAAACGCA-5Ј and cloning it into the KpnI and BamHI sites of pCHF3, a pPZP211-based plant expression vector carrying the cauliflower mosaic virus 35S promoter and a pea ribulose 1,5-bisphosphate carboxylase/oxyg enase terminator (C. Fankhauser, K. Hanson, and J. Chory, unpublished data). The PAP2 cDNA was excised from expressed sequence tag clone 193M15 with KpnI and BamHI and was cloned into pCHF3 to create pCHF3-PAP2.ACKNOWLEDGMENTSWe thank the following (all at Salk Institute unless otherwise noted): Tseg aye Dabi for help with transg enic tobacco; Mary Anderson at。
为什么NCCN指南对20外显子插入突变提示可能耐药

monthss u r v i v a l d i s t r i b u t i o n f u n c t i o n EGFR mutation median PFS (range)A763_Y764insFQEA 5.5 months (3.9-18)other exon 20 insertions 1 month (0.8-9)一个问题 为什么NCCN 指南对20外显子插入突变提示“可能预测临床对TKIs 耐药”?EGFR 20 外显子插入突变通常认为对TKI 耐药,NCCN 指南并没有给出一个完全耐药的提示。
下面两个研究会使我们对这一位点有更准确的理解。
一项来自2013年发表在《Sci Transl Med 》对肺癌中20外显子 插入突变的结构、生化和临床特征的研究。
先来看下20外显子插入在EGFR 结构上的位置,20外显子在激酶结构域上构成C-螺旋和环,即图1黄色螺旋和后面紫色环状。
再直观看下20外显子不同插入位点所处结构位置,见图1右图所示。
这些不同类型的20外显子插入位点对TKI 药物反应如何呢?研究者分析了19例不同20外显子插入类型经吉非替尼或厄罗替尼治疗的患者。
其中3例携带EGFR A763_Y764insFQEA 的患者2例部分缓解,1例稳定,见图2。
尽管患者总数少, A763_Y764insFQEA 的RR 达到了66.6% (2/3),对比其他C-螺旋上或以外的位点RR 为0%(0/16;p=0.0175),同样A763_Y764insFQEA 患者的PFS 比其他类型20外显子插入的也更长(5.5月vs 1.0月),见图3。
图2.不同20外显子插入位点患者对TKI 的疗效:黄色表示部分缓减(PR ),蓝色表示疾病稳定(SD ),红色表示疾病进展(PD ),*表示患者PD 但病灶无法测量。
右表是每一个患者对TKI 的响应情况。
图3. Kaplan-Meier PFS曲线分析。
atac技术原理

atac技术原理English: ATAC (Assay for Transposase-Accessible Chromatin) is a powerful technique used to analyze the accessibility of chromatin and identify regions of open chromatin. The ATAC method involves the use of Tn5 transposase, which inserts sequencing adapters into regions of open chromatin. The transposed DNA fragments can then be PCR amplified and sequenced to identify regions of open chromatin. The basic principle of ATAC lies in the fact that regions of open chromatin are more accessible to the transposase enzyme and will therefore have a higher frequency of transposase insertion events. This allows researchers to identify and map regions of open chromatin, which are associated with gene regulation and transcription. ATAC-seq has become a popular method for studying chromatin accessibility and has been used in a wide range of biological studies, including the identification of regulatory elements, transcription factor binding sites, and the characterization of epigenetic changes.中文翻译:ATAC(转座酶可及染色质分析)是一种用于分析染色质可及性并识别开放染色质区域的强大技术。
人苯丙氨酸羟化酶基因克隆及其原核表达质粒的构建

人苯丙氨酸羟化酶基因克隆及其原核表达质粒的构建作者:张志,黄宗青,沈琪,刘洪涛,邓英太,李爱东,周国强,汪华侨,何蕴韶【摘要】【目的】克隆健康人苯丙氨酸羟化酶基因全长cDNA 序列,构建并鉴定其原核表达质粒pTrcHisB/PAH。
【方法】采用RT-PCR方法从人肝组织中扩增 PAH基因全长cDNA,T/A 克隆到pMD18-T载体中,双酶切后将cDA亚克隆入pTrcHisB载体,构建pTrcHisB/PAH质粒,经限制性内切酶鉴定并测序。
【结果】人PAH 基因cDNA正确克隆入pTrcHisB表达载体,与Genebank中PAH基因序列一致。
【结论】成功构建pTrcHisB/PAH表达质粒,为进一步进行研究PAH蛋白表达和重组蛋白活性鉴定奠定基础。
【关键词】苯丙酮尿症;苯丙氨酸羟化酶;克隆;原核表达质粒[J SUN Yat-sen Univ(Med Sci), 2007, 28(3):288-291] 苯丙酮尿症(phenylketonuria, PKU)是神经科常见氨基酸代谢障碍的常染色体隐性遗传病。
98%~99%是由于苯丙氨酸羟化酶(phenylalanine hydroxylase, PAH)基因突变导致肝脏苯丙氨酸羟化酶活性降低而致病[1]。
当前的基因治疗为本病治疗提供了崭新的思路[2]。
国外学者已经在PKU小鼠模型上用腺病毒载体转导PAH进行基因治疗获得一定的成功,但是始终未能解决生物安全和如何长期稳定表达等问题[3,4],阻碍了这种方法的临床推广和应用。
本研究旨在通过体外原核表达活性PAH蛋白,开发新型PKU基因治疗药物,改进当前PKU治疗单纯依靠饮食控制的现状。
我们采用基因工程重组技术从健康人肝细胞中定向克隆出人PAH基因,构建pTrcHisBPAH原核表达质粒并进行鉴定,为以后PAH蛋白的体外表达打下基础,结果报道如下。
1 材料与方法1.1 材料1.1.1 主要材料和试剂新鲜肝脏标本来自中山大学附属第一医院肝胆外科肝血管瘤病人手术;pTrcHisB、TOP10 (Invitrogen), pMD18-T Vector (TaKaRa),Trizol (GIBCO)、RevertAidTM First Strand cDNA Synthesis Kit (#1621)、EcoRI、Kpn I (MBI Fermentas), QIA quick Gel Extraction Kit、QIA Spin Miniprep Kit (QIAGene)、T4?鄄DNA Ligase (Invitrogen)。
MPI TITAN RF Probe Selection Guide

MPI Probe Selection GuideWith a critical understanding of the numerous measurement challenges associated with today’s RF ap-plications, MPI Corporation has developed TITAN™ RF Probes, a product series specifically optimized for these complex applications centered upon the requirements of advanced RF customers.TITAN™ Probes provide the latest in technology and manufacturing advancements within the field of RF testing. They are derived from the technology transfer that accompanied the acquisition of Allstron, then significantly enhanced by MPI’s highly experienced RF testing team and subsequently produced utilizing MPI’s world class MEMS technology. Precisely manufactured, the TITAN™ Probes include matched 50 Ohm MEMS contact tips with improved probe electrical characteristics which allow the realization of unmat -ched calibration results over a wide frequency range. The patented protrusion tip design enables small passivation window bond pad probing, while significantly reducing probe skate thus providing the out -standing contact repeatability required in today’s extreme measurement environments. TITAN TM Probes with all their features are accompanied by a truly affordable price.The TITAN™ Probe series are available in single-ended and dual tip configurations, with pitch range from 50 micron to 1250 micron and frequencies from 26 GHz to 110 GHz. TITAN™ RF Probes are the ideal choice for on-wafer S-parameter measurements of RF, mm-wave devices and circuits up to 110 GHz as well as for the characterization of RF power devices requiring up to 10 Watts of continuous power. Finally, customers can benefit from both long product life and unbeatable cost of ownership which they have desired foryears.Unique design of the MEMS coplanar contacttip of the TITAN™ probe series.DC-needle-alike visibility of the contact point and the minimal paddamage due to the unique design of the tipAC2-2 Thru S11 Repeatability. Semi-Automated System.-100-80-60-40-200 S 11 E r r o r M a g n i t u d e (d B )Frequency (GHz)Another advantage of the TITAN™ probe is its superior contact repeatability, which is comparable with the entire system trace noise when measured on the semi-automated system and on gold contact pads.CROSSTALKCrosstalk of TITAN™ probes on the short and the bare ceramic open standard of 150 micron spacing compared to conventional 110 GHz probe technologies. Results are corrected by the multiline TRL calibration. All probes are of GSG configuration and 100 micron pitch.-80-60-40-200Crosstalk on Open. Multiline TRL Calibration.M a g (S21) (d B )Frequency (GHz)-80-60-40-200Crosstalk on Short. Multiline TRL Calibration.M a g (S21) (d B )Frequency (GHz)The maximal probe c ontac t repeatability error of the c alibrate S11-parameter of the AC2-2 thru standard by T110 probes. Semi-automated system. Ten contact circles.Cantilever needle material Ni alloy Body materialAl alloy Contact pressure @2 mils overtravel 20 g Lifetime, touchdowns> 1,000,000Ground and signal alignment error [1]± 3 µm [1]Planarity error [1] ± 3 µm [1]Contact footprint width < 30 µm Contact resistance on Au < 3 mΩThermal range-60 to 175 °CMechanical CharacteristicsAC2-2 Thru S21 Repeatability. Manual TS50 System.-100-80-60-40-200S 21 E r r o r M a g n i t u d e (d B )Frequency (GHz)MECHANICAL CHARACTERISTICSThe maximal probe c ontac t repeatability error of the c alibrate S21-parameter of the AC2-2 thru standard by T50 probes. Manual probe system TS50.26 GHZ PROBES FOR WIRELESS APPLICATIONSUnderstanding customer needs to reduce the cost of development and product testing for the high competitive wireless application market, MPI offers low-cost yet high-performance RF probes. The specifically developed SMA connector and its outstanding transmission of electro-magnetic waves through the probe design make these probes suitable for applications frequencies up to 26 GHz. The available pitch range is from 50 micron to 1250 micron with GS/SG and GSG probe tip configurations. TITAN™ 26 GHz probes are the ideal choice for measurement needs when developing components for WiFi, Bluetooth, and 3G/4G commercial wireless applications as well as for student education.Characteristic Impedance 50 ΩFrequency rangeDC to 26 GHz Insertion loss (GSG configuration)1< 0.4 dB Return loss (GSG configuration)1> 16 dB DC current ≤ 1 A DC voltage ≤ 100 V RF power, @10 GHz≤ 5 WTypical Electrical Characteristics26 GHz Probe Model: T26Connector SMAPitch range50 µm to 1250 µm Standard pitch step from 50 µm to 450 µm from 500 µm to 1250 µm25 µm step 50 µm stepAvailable for 90 µm pitch Tip configurations GSG, GS, SG Connector angleV-Style: 90-degree A-Style: 45-degreeMechanical CharacteristicsT26 probe, A-Style of the connectorTypical Electrical Characteristics: 26 GHz GSG probe, 250 micron pitchPROBES FOR DEVICE AND IC CHARACTERIZATION UP TO 110 GHZTITAN™ probes realize a unique combination of the micro-coaxial cable based probe technology and MEMS fabricated probe tip. A perfectly matched characteristic impedance of the coplanar probe tips and optimized signal transmission across the entire probe down to the pads of the device under test (DUT) result in excellent probe electrical characteristics. At the same time, the unique design of the probe tip provides minimal probe forward skate on any type of pad metallization material, therefo -re achieving accurate and repeatable measurement up to 110 GHz. TITAN™ probes are suitable for probing on small pads with long probe lifetime and low cost of ownership.The TITAN™ probe family contains dual probes for engineering and design debug of RF and mm-wave IC’s as well as high-end mm-wave range probes for S-parameter characterization up to 110 GHz for modeling of high-performance microwave devices.Characteristic Impedance 50 ΩFrequency rangeDC to 40 GHz Insertion loss (GSG configuration)1< 0.6 dB Return loss (GSG configuration)1> 18 dB DC current ≤ 1 A DC voltage ≤ 100 V RF power, @10 GHz≤ 5 WTypical Electrical Characteristics40 GHz Probe Model: T40Connector K (2.92 mm)Pitch range50 µm to 500 µmStandard pitch step For GSG configuration:from 50 µm to 450 µm from 500 µm to 800 µmFor GS/SG configuration:from 50 µm to 450 µm 25 µm step 50 µm stepAvailable for 90 µm pitch25 µm stepAvailable for 90/500 µm pitch Tip configurations GSG, GS, SG Connector angleV-Style: 90-degree A-Style: 45-degreeMechanical CharacteristicsTypical Electrical Characteristics: 40 GHz GSG probe, 150 micron pitchT40 probe, A-Style of the connectorCharacteristic Impedance50 ΩFrequency range DC to 50 GHz Insertion loss (GSG configuration)1< 0.6 dB Return loss (GSG configuration)1> 17 dBDC current≤ 1 ADC voltage≤ 100 VRF power, @10 GHz≤ 5 W Typical Electrical Characteristics Connector Q (2.4 mm)Pitch range50 µm to 250 µm Standard pitch stepFor GSG configuration: from 50 µm to 450 µm For GS/SG configuration: from 50 µm to 450 µm 25 µm stepAvailable for 90/500/550 µm pitch 25 µm stepAvailable for 90/500 µm pitchTip configurations GSG, GS, SG Connector angle V-Style: 90-degreeA-Style: 45-degreeMechanical CharacteristicsT50 probe, A-Style of the connectorTypical Electrical Characteristics: 50 GHz GSG probe, 150 micron pitchCharacteristic Impedance50 ΩFrequency range DC to 67 GHz Insertion loss (GSG configuration)1< 0.8 dB Return loss (GSG configuration)1> 16 dBDC current≤ 1 ADC voltage≤ 100 VRF power, @10 GHz≤ 5 W Typical Electrical Characteristics Connector V (1.85 mm)Pitch range50 µm to 250 µm Standard pitch stepFor GSG configuration: from 50 µm to 400 µm For GS/SG configuration: from 50 µm to 250 µm 25 µm step Available for 90 µm pitch25 µm step Available for 90 µm pitchTip configurations GSG Connector angle V-Style: 90-degreeA-Style: 45-degreeMechanical CharacteristicsT67 probe, A-Style of the connectorTypical Electrical Characteristics: 67 GHz GSG probe, 100 micron pitchCharacteristic Impedance 50 ΩFrequency rangeDC to 110 GHz Insertion loss (GSG configuration)1< 1.2 dB Return loss (GSG configuration)1> 14 dB DC current ≤ 1 A DC voltage ≤ 100 V RF power, @10 GHz≤ 5 WTypical Electrical CharacteristicsMechanical CharacteristicsTypical Electrical Characteristics: 110 GHz GSG probe, 100 micron pitchT110 probe, A-Style of the connectorCharacteristic impedance50 ΩFrequency range DC to 220 GHz Insertion loss (GSG configuration)1< 5 dB Connector end return loss(GSG configuration)1> 9 dBTip end return loss(GSG configuration)1> 13 dBDC current≤ 1.5 ADC voltage≤ 50 V Typical Electrical CharacteristicsConnector Broadband interface Pitch range50/75/90/100/125 µm Temperature range -40 ~ 150 ºC Contact width15 µmquadrant compatible(allowing corner pads)Yes recommended pad size20 µm x 20 µm recommended OT (overtravel)15 µmcontact resistance(on Al at 20 ºC using 15 µm OT)< 45 mΩlifetime touchdowns(on Al at 20 ºC using 15 µm OT)> 200,000Mechanical CharacteristicsT220 probe, broadband interface Typical Performance (at 20 ºC for 100 µm pitch)BODY DIMENSIONS PROBES Single-Ended V-StyleT220 GHz Probe1.161.1628.328437.455.6512.5527.73Single-Ended A-StyleCALIBRATION SUBSTRATESAC-series of calibration standard substrates offers up to 26 standard sets for wafer-level SOL T, LRM probe-tip cali -bration for GS/SG and GSG probes. Five coplanar lines provide the broadband reference multiline TRL calibration as well as accurate verification of conventional methods. Right-angled reciprocal elements are added to support the SOLR calibration of the system with the right-angled configuration of RF probes. A calibration substrate for wide-pitch probes is also available.Material Alumina Elements designCoplanarSupported calibration methods SOLT, LRM, SOLR, TRL and multiline TRL Thickness 635 µmSizeAC2-2 : 16.5 x 12.5 mm AC3 : 16.5 x 12.5 mm AC5 : 22.5 x 15 mm Effective velocity factor @20 GHz0.45Nominal line characteristic impedance @20 GHz 50 ΩNominal resistance of the load 50 ΩTypical load trimming accuracy error ± 0.3 %Open standardAu pads on substrate Calibration verification elements Yes Ruler scale 0 to 3 mm Ruler step size100 µmCalibration substrate AC2-2Probe Configuration GSGSupported probe pitch100 to 250 µm Number of SOL T standard groups 26Number of verification and calibration lines5Calibration substrate AC-3Probe Configuration GS/SG Supported probe pitch50 to 250 µm Number of SOL T standard groups 26Number of verification and calibration lines5Calibration substrate AC-5Probe Configuration GSG, GS/SG Supported probe pitch250 to 1250 µm Number of SOL T standard groups GSG : 7GS : 7SG : 7Open standardOn bare ceramic Number of verification and calibration linesGSG : 2GS : 1Typical characteristics of the coplanar line standard of AC2-2 calibration substrate measured using T110-GSG100 probes, and methods recommended by the National Institute of Standard and Technologies [2, 3].2468(d B /c m )F requency (G Hz)α-6-4-202I m a g (Z 0) ()F requency (G Hz)AC2-2 W#006 and T110A-GSG100Ω2.202.222.242.262.282.30 (u n i t l e s s )F requency (G Hz)β/βо4045505560R e a l (Z 0) ()F requency (G Hz)ΩTypical Electrical CharacteristicsMPI QAlibria® RF CALIBRATION SOFTWAREMPI QAlibria® RF calibration software has been designed to simplify complex and tedious RF system calibration tasks. By implementing a progressive disclosure methodology and realizing intuitive touch operation, QAlibria® provides crisp and clear guidance to the RF calibration process, minimizing con-figuration mistakes and helping to obtain accurate calibration results in fastest time. In addition, its concept of multiple GUI’s offers full access to all configuration settings and tweaks for advanced users. QAlibria® offers industry standard and advanced calibration methods. Furthermore, QAlibria® is integrated with the NIST StatistiCal™ calibration packages, ensuring easy access to the NIST mul-tiline TRL metrology-level calibration and uncertainty analysis.MPI Qalibria® supports a multi-language GUI, eliminating any evitable operation risks and inconvenience.SpecificationsRF AND MICROWAVE CABLESMPI offers an excellent selection of flexible cables and acces-sories for RF and mm-wave measurement applications forcomplete RF probe system integration.CablesHigh-quality cable assemblies with SMA and 3.5 mm connectorsprovide the best value for money, completing the entry-level RFsystems for measurement applications up to 26 GHz. Phase stab-le high-end flexible cable assemblies with high-precision 2.92, 2.4, 1.85 and 1 mm connectors guarantee high stability, accuracy and repeatability of the calibration and measurement for DC applications up to 110 GHz.MPI offers these cable assemblies in two standard lengths of 120 and 80 cm, matching the probe system’s footprint and the location of the VNA.Cables Ordering InformationMRC-18SMA-MF-80018 GHz SMA flex cable SMA (male) - SMA (female), 80 cmMRC-18SMA-MF-120018 GHz SMA flex cable SMA (male) - SMA (female), 120 cmMRC-26SMA-MF-80026 GHz SMA flex cable SMA (male) - SMA (female), 80 cmMRC-26SMA-MF-120026 GHz SMA flex cable SMA (male) - SMA (female), 120 cmMRC-40K-MF-80040 GHz flex cable 2.92 mm (K) connector, male-female, 80 cm longMRC-40K-MF-120040 GHz flex cable 2.92 mm (K) connector, male-female, 120 cm longMRC-50Q-MF-80050 GHz flex cable 2.4 mm (Q) connector, male-female , 80 cm longMRC-50Q-MF-120050 GHz flex cable 2.4 mm (Q) connector, male-female , 120 cm longMRC-67V-MF-80067 GHz flex cable 1.85 mm (V) connector, male-female, 80 cm longMRC-67V-MF-120067 GHz flex cable 1.85 mm (V) connector, male-female, 120 cm longMMC-40K-MF-80040 GHz precision flex cable 2.92 mm (K) connector, male-female, 80 cm long MMC-40K-MF-120040 GHz precision flex cable 2.92 mm (K) connector, male-female, 120 cm long MMC-50Q-MF-80050 GHz precision flex cable 2.4 mm (Q) connector, male-female , 80 cm long MMC-50Q-MF-120050 GHz precision flex cable 2.4 mm (Q) connector, male-female , 120 cm long MMC-67V-MF-80067 GHz precision flex cable 1.85 mm (V) connector, male-female, 80 cm long MMC-67V-MF-120067 GHz precision flex cable 1.85 mm (V) connector, male-female, 120 cm long MMC-110A-MF-250110 GHz precision flex cable 1 mm (A) connector, male-female, 25 cm longMPI Global PresenceDirect contact:Asia region: ****************************EMEA region: ******************************America region: ********************************MPI global presence: for your local support, please find the right contact here:/ast/support/local-support-worldwide© 2023 Copyright MPI Corporation. All rights reserved.[1] [2][3] REFERENCESParameter may vary depending upon tip configuration and pitch.R. B. Marks and D. F. Williams, "Characteristic impedance determination using propagation constant measu -rement," IEEE Microwave and Guided Wave Letters, vol. 1, pp. 141-143, June 1991.D. F. Williams and R. B. Marks, "Transmission line capacitance measurement," Microwave and Guided WaveLetters, IEEE, vol. 1, pp. 243-245, 1991.AdaptersHigh-In addition, high-quality RF and high-end mm-wave range adapters are offered to address challenges ofregular system reconfiguration and integration with different type of test instrumentation. MRA-NM-350F RF 11 GHz adapter N(male) - 3.5 (male), straight MRA-NM-350M RF 11 GHz adapter N(male) - 3.5 (female), straightMPA-350M-350F Precision 26 GHz adapter 3.5 mm (male) - 3.5 mm (female), straight MPA-350F-350F Precision 26 GHz adapter 3.5 mm (female) - 3.5 mm (female), straight MPA-350M-350M Precision 26 GHz adapter 3.5 mm (male) - 3.5 mm (male), straight MPA-292M-240F Precision 40 GHz adapter 2.92 mm (male) - 2.4 mm (female), straight MPA-292F-240M Precision 40 GHz adapter 2.92 mm (female) - 2.4 mm (male), straight MPA-292M-292F Precision 40 GHz adapter 2.92 mm (male) - 2.92 mm (female), straight MPA-292F-292F Precision 40 GHz adapter 2.92 mm (female) - 2.92 mm (female), straight MPA-292M-292M Precision 40 GHz adapter 2.92 mm (male) - 2.92 mm (male), straight MPA-240M-240F Precision 50 GHz adapter 2.4 mm (male) - 2.4 mm (female), straight MPA-240F-240F Precision 50 GHz adapter 2.4 mm (female) - 2.4 mm (female), straight MPA-240M-240M Precision 50 GHz adapter 2.4 mm (male) - 2.4 mm (male), straight MPA-185M-185F Precision 67 GHz adapter 1.85 mm (male) -1.85 mm (female), straight MPA-185F-185F Precision 67 GHz adapter 1.85 mm (female) -1.85 mm (female), straight MPA-185M-185M Precision 67 GHz adapter 1.85 mm (male) -1.85 mm (male), straight MPA-185M-100FPrecision 67 GHz adapter 1.85 mm (male) -1.00 mm (female), straightDisclaimer: TITAN Probe, QAlibria are trademarks of MPI Corporation, Taiwan. StatistiCal is a trademark of National Institute of Standards and Technology (NIST), USA. All other trademarks are the property of their respective owners. Data subject to change without notice.。
- 1、下载文档前请自行甄别文档内容的完整性,平台不提供额外的编辑、内容补充、找答案等附加服务。
- 2、"仅部分预览"的文档,不可在线预览部分如存在完整性等问题,可反馈申请退款(可完整预览的文档不适用该条件!)。
- 3、如文档侵犯您的权益,请联系客服反馈,我们会尽快为您处理(人工客服工作时间:9:00-18:30)。
Curr Genet (2007) 51:233–243DOI 10.1007/s00294-007-0122-5RESEARCH ARTICLECharacterization of T-DNA insertion patterns in the genomeof rice blast fungus Magnaporthe oryzaeGuihua Li · Zhuangzhi Zhou · Guifu Liu ·Fucong Zheng · Chaozu HeReceived: 11 December 2006 / Revised: 27 January 2007 / Accepted: 29 January 2007/ Published online: 16 February 2007© Springer-Verlag 2007Abstract Agrobacterium tumefaciens-mediated trans-formation (ATMT) has been proven to be a powerful strategy for gene disruption in plants and fungi. Pat-terns associated with transferred DNA (T-DNA) integration in plants and yeast have been studied comprehensively, whereas no detailed analysis of T-DNA integration has been reported yet in W lamen-tous fungi. Here, we reported the T-DNA insertion patterns in the genome of W lamentous fungus Magna-porthe oryzae. Using ATMT, a T-DNA tagged popula-tion consisting of 6,179 transformants of M. oryzae was constructed. With thermal asymmetric interlaced-PCR (TAIL-PCR), 623 right border (RB) X anking sequences and 124 left border (LB) X anking sequences were generated. Analysis of these X anking sequences indicated a signi W cant integration bias toward non-cod-ing sequences, suggesting distribution of T-DNAs was not random. Comparing to T-DNA RB, LB was nicked inaccurately and truncated frequently during integration. Chromosomal rearrangements, such as deletion, inversion, and translocation, were associated with T-DNA integration in some transformants. Our data suggest that, comparing with plant cells, T-DNA integrates into this W lamentous fungus with more pre-cise and simpler patterns. Some phenotypic mutants were observed in our T-DNA tagged population, and these transformants will be very useful for functional genomics research of M. oryzae.Keywords Agrobacterium tumefaciens-mediated transformation · Magnaporthe oryzae · T-DNA · Chromosomal rearrangementIntroductionMagnaporthe oryzae (formerly Magnaporthe grisea), the causative agent of rice blast, is the most destructive pathogen of rice worldwide (Zeigler et al. 1994) and the principal model organism for elucidating the molecular basis of fungus-plant interactions (Valent 1990). M. oryzae is a haploid ascomycete fungus and contains seven chromosomes in each cell. The draft genome sequence of M. oryzae strain 70-15 has been released (Dean et al. 2005). Functional and com-parative genomic analysis of this important phytopath-ogenic fungus, although still in the early stage, has improved our understanding of the molecular mecha-nisms involved in host-pathogen interactions (Xu et al. 2006). Large-scale expressed sequence tags (EST), whole-genome microarrays and mutant collections have been developed (Soanes et al. 2002; Xu et al. 2006). Among available approaches for W nding novel genes that encode determinants of pathogenicity,Communicated by K. Borkovich.Guihua Li and Zhuangzhi Zhou contributed equally to the work.Electronic supplementary material The online version of this article (doi:10.1007/s00294-007-0122-5) contains supplementary material, which is available to authorized users.G. Li · Z. Zhou · G. Liu · F. Zheng · C. He (&)State Key Laboratory of Plant Genomics,Institute of Microbiology, Chinese Academy of Sciences, Beijing 100080, People’s Republic of Chinae-mail: hecz@G. Li · Z. ZhouGraduate School of the Chinese Academy of Sciences,Beijing 100039, People’s Republic of Chinaidenti W cation of pathogenicity-de W cient mutants clearly has the greatest potential. Agrobacterium tumefaciens-mediated transformation (ATMT) has been proved to be an e V ective way for this aim in plants. Transferred DNA (T-DNA) transformation of M. oryzae was demonstrated successfully recently (Rho et al. 2001).Agrobacterium tumefaciens is able to transfer its T-DNA into diverse groups of organisms, including plants, other prokaryotes, yeast, W lamentous fungi, even human cells, which represents a unique case of naturally occurring trans-kingdom DNA transfer (Lac-roix et al. 2006). Whereas extensive work has revealed the translocation process, little is known about the bio-logical mechanisms governing the targeting of the T-DNA to its site of integration and following insertion within the host chromatin. Comprehensive character-izations associated with T-DNA insertion into plants have been reported recently, especially in Arabidopsis, tobacco, and rice (Tz W ra et al. 2004).Transferred DNA integrates into plant cells mostly with a non-homologous recombination mode (Gheysen et al. 1991; Mayerhofer et al. 1991), and a signi W cant bias of integration events in 5Ј-up-stream (5Ј untranslated region and promoter) regions of genes has been dis-closed (Alonso et al. 2003; Chen et al. 2003; Forsbach et al. 2003; Sha et al. 2004). At regions surrounding centromeres of Arabidopsis, T-DNA integration events are observed rarely (Alonso et al. 2003).In Agrobacterium, the 25bp T-DNA border repeat sequence is predominantly nicked at the T-DNA lower strand, between the third and fourth nucleotide (Sta-chel et al. 1986; Wang et al. 1987). T-DNA integrates into plant cells with a more canonical right border (RB) than left border (LB) (Brunaud et al. 2002; Fors-bach et al. 2003; Kim et al. 2003), probably due to the protection of VirD2 protein which has been attached to RB for most of the time during the process of T-DNA transfer (Tinland et al. 1995; Brunaud et al. 2002).Transferred DNA insertions in Arabidopsis (Ghey-sen et al. 1991; Mayerhofer et al. 1991; Forsbach et al. 2003) and tobacco (Ohba et al. 1995) are normally associated with small (<100bp) target site deletions. Chromosomal rearrangements such as inversion and translocation, associated with T-DNA insertions, are also observed in transgenic Arabidopsis (Castle et al. 1993; Nacry et al. 1998; Forsbach et al. 2003) with low frequency.At the junction between T-DNA and the plant genomic DNA, W ller sequence (Forsbach et al. 2003; Windels et al. 2003) and microhomology are frequently observed, whereas the frequency of microhomology is found higher at the junctions involving LB than those of RB (Forsbach et al. 2003; Kim et al. 2003).Long T-DNA (T-DNA and non-T-DNA) transfer is a very common phenomenon occurred during the process of ATMT of plants (Virts and Gelvin 1985; Wenck et al. 1997; Yin and Wang 2000; Sha et al. 2004). Insertions with a size of greater-than-unit-length of the binary plasmid have been detected in transgenic Arabidopsis (Wenck et al. 1997) and rice (Yin and Wang 2000). Based on analysis of co-trans-formation with two di V erent T-DNAs containing dis-tinct sequences adjacent to T-DNA borders, it is concluded that T-DNAs frequently integrate into same positions of plant genomes with inverted- or direct-repeat modes (De Neve et al. 1997; De Buck et al. 1999).Recent studies indicate that T-DNA integration into double-stranded break (DSB) with a double-stranded form might be a default mode of T-DNA insertion in host genomes (Köhler et al. 1989; Chilton and Que 2003; Tz W ra et al. 2003; Tz W ra et al. 2004).Agrobacterium tumefaciens-mediated transforma-tion has been established in many W lamentous fungi including M. oryzae (Michielse et al. 2005). However, patterns of T-DNA insertion in these fungal genomes are not clear. In this paper, the T-DNA integration patterns into the genome of M. oryzae are explored. We constructed a T-DNA tagged population of M.oryzae containing 6,179 transformants, from which 623 RB X anking sequences and 124 LB X anking sequences were rescued and analyzed. Our results showed that distribution of T-DNAs among seven chromosomes of M. oryzae was not random, and T-DNA integration could induce chromosomal rear-rangements such as deletion, inversion, and transloca-tion. Our data suggest that T-DNA integrates into the genome of M. oryzae with a more precise and simpler mode than that into plant cells, which provides advan-tages for study of functional genomics of the W lamen-tous fungus.Materials and methodsFungal strains and culture conditionsTwo strains of M. oryzae were used in this study, a Chinese W eld strain Y34 was used in ATMT and a laboratory strain 70-15 was used as a reference strain. The fungus was cultured on oatmeal agar (OMA) at 28°C. For conidiation, the 5–7days plate culture was scratched, followed by additional 3–4days cultivation under continuous X uorescent light.Agrobacterium-mediated transformationof Magnaporthe oryzaeAgrobacterium tume W ciens strain Agl-1, carrying the binary vector pBHt2 with hpt (hygromycin phospho-transferase) gene under the Aspergillus nidulans trpC promoter (Mullins et al. 2001), was used to transform strain Y34 with the protocol as previously described (Rho et al. 2001). Hygromycin B (200 g/ml) was used for selection of transformants.Mitotic stability of T-DNA inserted in the Magnaporthe oryzae genomeFive randomly selected transformants were cultured on OMA plates without hygromycin B for 4–5days. Mycelia at the edge of the culture was picked up with toothpick and inoculated on fresh OMA plates for growth of another 4–5days. After repeating this proce-dure for 16 times, germinating monoconidium from each transformant was transferred to OMA plate con-taining hygromycin B (200 g/ml) and their growth was observed. DNAs of each strain were extracted for Southern blot analysis with the probe ampli W ed with primers HPTa and HPTb (Supplementary Table S1), which were speci W c to hpt gene and with an 858bp ampli W cation product.DNA isolation and analysisFollowing growth on OMA plates for 4–7days, mycelia of each strain were collected and cultured in V-8 juice media with hygromycin B (75 g/ml) and streptomycin (100 g/ml) for additional 2–4days. Then, mycelia were harvested by vacuum-in W ltration and washed by sterile water. Mycelia were ground to W ne powders in liquid nitrogen. Genomic DNA was isolated as previously described (Talbot et al. 1993).For Southern blot analysis, about 1 g of genomic DNA was digested with restriction endonucleases, sep-arated in 1% agarose gels, blotted to Hybond-N+ mem-branes and hybridized with [32P]dCTP-labeled probe. Hybridization and washes were performed using stan-dard procedures (Sambrook et al. 1989).Isolation of T-DNA X anking sequencesThermal asymmetric interlaced-PCR (TAIL-PCR) (Liu and Whittier 1995; Mullins et al. 2001) was employed to obtain genomic DNA sequences X anking inserted T-DNAs from transformants selected ran-domly. Primers designed for TAIL-PCR were list in Supplementary Table S1. The tertiary TAIL-PCR products were cloned into pGEM-T Easy vector (Pro-mega, Madison, WI, USA) and sequenced. Sequence processingSequences of TAIL-PCR products were searched for nucleotide similarities by the BLASTN algorithm against databases as follows: M. oryzae genome database (/annotation/genome/ magnaporthe_grisea) and NCBI (http://www.ncbi.nlm. /BLAST). Positions of the T-DNA insertion sites were mapped in silico onto M. oryzae chromo-somes based on the physical and genetic maps available at the M. oryzae genome database.Distribution of T-DNA insertion sites among seven chromosomes was analyzed according to length of each linkage group released from the latest Assembly Struc-ture of the M. oryzae genome database. Distribution of T-DNA insertion sites within particular genetic ele-ments was analyzed according to data derived from Genome Statistics of the M. oryzae genome database. Searches for 1kb up-stream or 200bp down-stream of annotated genes of M. oryzae were preformed for dis-tribution of T-DNA insertion sites in the 5Ј- or 3Ј-regu-latory regions.Nicking sites of T-DNA integrations were deter-mined by comparison of each end sequence of the inte-grated T-DNA, which was revealed by X anking sequence analysis, with the end sequence of canonical one.Plasmid rescueAbout 1 g of genomic DNA of each tested transfor-mant was digested with restriction endonuclease Pst I, which has only one digestion site in plasmid pBHt2 at its multiple cloning site. The digested DNA was etha-nol precipitated, dissolved in sterile water and ligated using T4 DNA ligase at 16°C overnight. The product of ligation was precipitated, redissolved in 20 l sterile water and electroporated into Escherichia coli DH10B cells. Transformants were cultured on LB plates with kanamycin (50 g/ml) for plasmid selection.Analysis of chromosomal rearrangementEach putative transformant, involving rearrangement probably revealed by TAIL-PCR, was further analyzed by PCR using four sets of primer pairs designed according to the surrounding sequences of junction sites (primers LF1-3 and LR1-3 for LB junction sites, RF1-3 and RR1-3 for RB junction sites, Supplemen-tary Table S1). PCR products containing host–hostjunction sites were sequenced to verify the rearrange-ments. In order to further con W rm chromosomal inver-sion occurred in a transformant, Southern blot analysis with six probes derived from rearranged chromosomal regions was carried out.ResultsDetermination of T-DNA copy number and mitotic stability of transformants of Magnaporthe oryzaeAn ATMT system of M. oryzae with transformation e Y ciency about 300 transformants per 1£106 conidia, was established, from which 6,179 independent trans-formants were obtained. To determine T-DNA inte-gration and copy number, 135 transformants were selected randomly. PCR analysis with primers HPTa and HPTb indicated that all tested transformants con-tained Hpt gene (data not shown). Genomic DNAs of these transformants were analyzed by Southern blot probed with a fragment of Hpt gene (Fig.1). The result indicated that 72.6% (98/135) of the transformants contained one copy of T-DNA, 19.2% (26/135) con-tained two copies, 8.2% (11/135) contained three or more copies. The average copy number of T-DNA integrated into these transformants was 1.36. Five ran-domly selected transformants were assayed for their mitotic stability of inserted T-DNA. These trasnfor-mants remained their hygromycin B resistance and T-DNA copy number in subsequent sub-culture for 16 times in the absence of hygromycin B, indicating that T-DNA was stable in the genome of M. oryzae. Analysis of T-DNA X anking sequencesThermal asymmetric interlaced-PCR was carried out to recover X anking sequences of inserted T-DNAs. Excluding the non-speci W c or similar, we obtained 623 RB X anking sequences from 900 transformants and 124 LB X anking sequences from 240 transformants, respec-tively. From them, genomic sequences adjacent to both borders of a same T-DNA were recovered from 75 transformants. Of these 623 RB X anking sequences, 445 corresponded to single copy genomic regions; 16 matched to multiple genomic regions, suggesting that the corresponding T-DNAs were integrated into repet-itive sequence regions; 150 X anking sequences con-tained sequences derived from binary vector backbone or another T-DNA (of which M. oryzae sequences could be found in three X anking sequences); and 14 X anking sequences were not matched to any sequences of M. oryzae or binary vector pBHt2, which might locate in un-sequenced regions.Distribution of T-DNA insertion sites among seven chromosomesThe 445 solely matched X anking sequences were analyzed for distribution of T-DNA insertion sites. Of which, 432 X anking sequences were mapped on seven chromosomes, respectively, while 13 X anking sequences located on unlinked surpercontigs (Fig. 2, Supplementary Table S2). According to length of each chromosome available at the M. oryzae genome data-base, expected frequencies of T-DNA integrations into seven chromosomes from I to VII based on random insertion are 21.0, 16.0, 15.8, 10.6, 13.9, 11.7, and 11.0%, respectively. Expected T-DNA numbers dis-tributed among seven chromosomes were calculated for the mapped 432 X anking sequences (Table1). The results revealed that the distribution of T-DNA inser-tion sites among seven chromosomes was not com-pletely random. Although no signi W cant bias (at P=0.05 level) of T-DNA integration events into chro-mosomes II, IV, V, VI, and VII were observed, T-DNA insertions toward chromosome I appeared more frequent than expected. However, for chromosome III, the frequency of T-DNA integration was signi W cantly lower than expected. Fewer insertion events of T-DNA were found at some inner regions where centromeres might locate (Fig.2).Fig.1Southern blot analysis of transformants of Magnaportheoryzae. Genomic DNAs of di V erent transformants and wild type strain Y34 were digested with Pst I and hybridized with a fragment of hpt gene. Lane 1, 1kb DNA marker (New England Biolabs); lanes 2–31, di V erent transformants; lane 32, wild type strain Y34Distribution of T-DNA insertion sites within particular genetic elementsGenetic elements were deduced from gene predictions of the latest release of the M. oryzae genome annota-tion (Version 5.0). In the genome, a gene was found, on average, every 3,241.5bp including 1,549bp of genic sequences (1,319bp in exons and 230bp in introns).Assuming completely random T-DNA integration we would expect 47.8% of the insertions in CodingFig.2Scheme of distribution of T-DNAs in the genome of Magnaporthe oryzae .Chromosomal positions of 432 T-DNA RB X anking sequences were determined according to the physical and genetic maps available at the Magnaporthe oryzae genome database. The loci of corresponding T-DNApositions were shown on left sides of each chromosome. Genetic markers ofMagnaporthe oryzae were shown on rightTable 1Statistical analysis of the distribution of T-DNAs among seven chromosomesExact integration sites of these T-DNAs can be found in Supplementary Table S22 values were calculated for 432 T-DNAs, which map positions on chromosomes were determined unambiguously *, ** Indicate signi W cance for 2 test at P =0.05 and 0.01 levels, respectivelyChromosomes TotalIII III IV V VI VII Expected T-DNA number 90.7569.0768.0945.6760.0850.5847.76432Observed T-DNA number109*6948**40675346432sequences (40.7% in exons and 7.1% in introns), 30.8%in the region 1kb up-stream of a start codon, and 6.2%in the region 200bp down-stream of a stop codon. The remainder (15.2%) should insert in intergenic regions. 2 tests (P =0.01) indicated that T-DNA insertions in genic sequences were found less frequently than expected, mostly due to the low frequency of insertion in exon. However, a signi W cant insertion bias was observed in favor of non-genic sequences, especially up-stream 1kb regions and intergenic regions. No sig-ni W cant integration biases were observed in introns or down-stream 200bp regions of annotated genes (Table 2).Integration accuracy of T-DNA bordersFive hundred and W fty-eight RB X anking sequences (of 623, the remainder 65 X anking sequences belong to long T-DNA integration) and 124 LB X anking sequences were analyzed for integration accuracy of T-DNA borders (Fig.3). The results showed that the accuracy of integration was very high at RB. In 92.1%(514 of 558 X anking sequences) of the cases, T-DNAs integrated with canonical RBs (i.e., nicking positions appear between the third and fourth nucleotide of the 25bp border repeat sequence), while deletions with small fragment (1–80bp) were only found in 7.9% (44of 558 X anking sequences) of the cases. Compared withRB, however, the accuracy of LB integration was low.Only 32.3% (41 of 124) were canonical insertions. T-DNA integrations with LBs truncated with 1–22bp were observed frequently (59.7%, 73 of 124). Large deletions (30–150bp) occurred in lower frequency (8.1%, 10 of 124).Microhomologies and W ller sequences observed at the junctions between the host genome and T-DNA bordersThe 124 LB and the 462 RB X anking sequences, which contained sequences of M. oryzae , were analyzed for patterns of junctions between T-DNA borders and genomic target sites (Table 3). Microhomologies with 2–7bp in size were found frequently (72.6%, 90 of 124)in junctions between LB and genomic sequences. How-ever, in junctions involving RB, microhomologies were found less frequently (21.0%, 97 of 462) and mostly in smaller size (1bp). Meanwhile, W ller sequences ranging from 1 to 230bp in size were observed from 56 of 462(12.1%) junctions of RB. Sequence analysis showed that, some longer W ller sequences were originated from the T-DNA region, backbone of binary vector or the host genome, respectively. It was di Y cult to determine the originations of the shorter W ller sequences. At the junctions of LB, W ller sequences occurred rarely (1.6%,2 of 124).Sequence analysis of T-DNA insertion sites and chromosomal rearrangements associated with T-DNA integrationFrom RB and LB X anking sequences mentioned above, genomic sequences adjacent to both borders of a same T-DNA were obtained from 75 transformants.These X anking sequences were compared with sequences corresponding to pre-insertion sites (Table 4).The results indicated that, deletions with 1–80bp in size (15bp in average) were observed frequently (60 of 75)in genomic target sites due to T-DNA integration. The largest deletion with 505bp in size was found in oneTable 2Distribution of T-DNA insertion sites within particular genetic elements ** Indicates signi W cance at P =0.01 level for 2 testsPosition of insertion Expected number of T-DNA Observed number of T-DNA Non-genic sequences 232.35364**Up-stream 1,000bp 137.28186**Down-stream 200bp 27.4620Intergenic sequences 67.61159**Genic sequences 212.6580**Exon 181.0654**Intron31.5926Total sequences analyzed445Fig.3Nicking positions of the integrated T-DNAs.Histogram of the percentage of nicking site was classi W ed based on the nicking fre-quency calculated from 124 LB or 558 RB X anking se-quences, respectively. T-DNA border repeats were capital-ized. Arrows indicate the posi-tions of T-DNA nicking in Agrobacteriumtransformant. Short duplications (1–8bp) of the target sequences were also observed in W ve T-DNA insertion events. Exact integration without deletion or duplica-tion was only found in six transformants. These results suggest that small fragment deletion of the target site is the most frequent event during T-DNA integration into the genome of M. oryzae.Three single-copy T-DNA transformants (6001, 4825, and 438), which had RB and LB X anking sequences localized on di V erent chromosomes, or on the same chromosome but far away from each other, were identi W ed, which suggested that chromosomal rearrangement might occur. PCR was applied to fur-ther analysis, with primers (Supplementary Table S1) speci W c to corresponding target sites of each transfor-mant. Ampli W ed products were only obtained from genomic DNA templates of wild type strains using primer pairs LF+LR (LF1+LR1, LF2+LR2, and LF3+LR3 for transformant 6001, 4825, and 438, respectively) or RF+RR (RF1+RR1, RF2+RR2, and RF3+RR3 for transformant 6001, 4825 and 438, respectively) (Fig.4a–c). However, when primer pairs LF+RR (LF1+RR1, LF2+RR2, and LF3+RR3, respectively) or RF+LR (RF1+LR1, RF2+LR2, and RF3+LR3, respectively) which had annealing sites on di V erent fragments involved in rearrangement,were used, PCR products with predicted sizes were ampli W ed from all three transformants, while no prod-uct was obtained from wild type strains (Fig.4a–c). These results demonstrated that chromosomal rear-rangements induced by T-DNA integration occurred in these transformants. The rearrangements were further con W rmed by sequencing the host–host rejoining sites for each transformant. Taking these results together, translocation occurred in transformant 438, with large fragments translocated between chromosomes I and IV (Fig.4d), while inversions occurred in transformant 6001 and 4825, involving fragments with 64 and 218kb in size, respectively (Fig.4e).Southern blot analysis of transformant 6001 using six probes derived from representative locations of chromosomal fragments involved in arrangement, further con W rmed the inversion event (Fig.5). Fig.5IIa, e, f indicated that no duplication presented in the T-DNA X anking regions since only one band was observed for 6001 consistently. Fig.5IIc, d showed that genomic DNAs between the two pre-dicted T-DNA insertion sites (Fig.5I) remained intact. Fig.5IIb indicated that there was another rejoining site (host–host) existed somewhere in the genome of 6001. Therefore, together with evidences of PCR analysis and host–host junction sequencing mentioned above, chromosomal inversion event was con W rmed further in transformant 6001.Analysis of sequences of rearrangemental junction regions (including host-LB, RB-host, and host–host) revealed that rejoining patterns similar to ones described above for general T-DNA integration (Tables3, 4) were observed. Small fragment deletions and microhomologies were found frequently. Dele-tions of host genomic sequences with 30, 12, and 22bp in size were observed in transformant 6001, 4825, and 438, respectively. Microhomologies with 1–3bp were found in 5 of 9 rearrangement sites. No W ller sequence was observed at these junction sites in all three tested transformants.Table3Sequence analysis of junctions between T-DNA borders and genomic target sitesRB LBSize (bp)Number of junctions Size (bp)Number of junctions Identical nucleotides between target site and border1–5971–7901701122–5272–778Filler nucleotides between target site and border1–230561–221–303330–23023Exact joining between target site and border30932Total sequences analyzed462124Table4Sequences analysis of T-DNA insertion sitesNumber of T-DNAinsertionsDuplication of target site1–8bp 5 (6.7%)Exact integration into target site 6 (8.0%)Deletion of target site61 (81.3%)1–20bp46 (61.3%)21–80bp14 (18.7%)>80bp 1 (1.3%)Inversions 2 (2.7%)Translocations 1 (1.3%)Number of sequences analyzed75(100%)Complex T-DNA integration patternsOf the 623 RB X anking sequences, 65 (10.4%) were involved in long T-DNA integration. Southern blot analysis (data not shown) with probes derived from di V erent regions of pBHt2 suggested that some trans-formants might contain at least one copy of the whole binary vector. To test that speculation, W ve transfor-mants were selected for further assay of plasmid rescue. Genomic DNAs were digested with Pst I and self-ligated. Plasmids were rescued from four transfor-mants but failed from one. Analysis of restriction endonucleases digestions and PCR reactions indicated that these retrieved plasmids were the same as the orig-inal plasmid pBHt2 (data not shown), suggesting that long T-DNA with greater-than-unit-length of the binary plasmid has been integrated into the genome of M. oryzae .Analysis of RB X anking sequences also revealed that 11.4% (71 of 623) of transformants contained two T-DNAs (one might be partial) co-integrated into the genome of M. oryzae with head-to-tail fusions (direct repeat). At the junctions, rejoining patterns similar to ones described above for general T-DNA integration (Fig.3, Table 3) were also observed. Most RBs (98.6%) showed full-length fusions, but one had 1bp deletion. Sometimes, LBs undergone deletions of 1–180bp, and full-length LB fusions were found in 44 (62.0%) transformants.Filler sequence (4.2%, with 1bp) and microhomology (2.8%, with 1–2bp) were also found but rarely at the junctions.Fig.4PCR analysis and pro-posed modes of chromosomal rearrangements. Each puta-tive transformant, 6001(a ), 4825 (b ) or 438 (c ) were analyzed by PCR using four sets of primer pairs (which relative positions were shown in d or e ) as indicated on the top of each panel. Wild types Y34 and 70-15 were used as control. Original strains of templates were shown under primers. T1, T2, and T3 de-note transformant 6001, 4825, and 438, respectively; W1 and W2 denote Y34 and 70-15, respectively; M, 1kb DNA marker. Modes of chromo-somal rearrangement associ-ated with T-DNA integration are proposed based on molec-ular evidences of this study. When invading T-DNA mole-cule is physically close to host chromatins where two DSB events existed simultaneously, rearrangement might happen. d Translocation occurs (as transformant 438) if the two DSB events involved in rear-rangement derived from di V erent chromosomes. e Inversion occurs (as trans-formant 6001 and 4825) if the two involved DSB events originated from a same chromosome. DSB , double-stranded break。