Storage device performance prediction with CART models
核电站备件库存金额预测方法
[收稿日期]2021-08-31[作者简介]邓孝林(1985-),男,工学学士,工程师,库存与计划管理办公室副主任,主要研究方向:核电站备件管理;谢宏志(1989-),男,工学硕士,高级工程师,主要研究方向:核电站热工仪表设备选项、库存管理等。
doi:10.3969/j.issn.1005-152X.2022.01.017核电站备件库存金额预测方法邓孝林,谢宏志(中广核核电运营有限公司备件中心,广东深圳518124)[摘要]设计了一种对入库金额和领用金额进行预测的方法,基于核电站的历史入库数据、维修领用数据,通过入库金额和领用金额对库存金额进行预测,并以某核电站为例进行仿真验证,当预测时长为12个月时,入库金额预测的平均相对误差为7.77%,领用金额预测的平均相对误差为7.83%,库存金额预测的平均相对误差为3.59%,基本满足核电备件管理中对库存金额预测精度的要求。
[关键词]核电站;备件储存与管理;入库金额;领用金额;库存金额;库存预测[中图分类号]TM623;F253[文献标识码]A [文章编号]1005-152X(2022)01-0086-06Prediction of Spare Parts Inventory Value of Nuclear Power PlantDENG Xiaolin,XIE Hongzhi(Spare Parts Center,China Nuclear Power Operations Co.,Ltd.,Shenzhen 518124,China)Abstract:In this paper,we designed a method to predict the storage amount and requisition amount of nuclear power plants.Based on the historical storage data and maintenance requisition data of a nuclear power plant,we predicted the inventory value of the plant by calculating its storage amount and requisition amount.Next,we had a numerical simulation analysis and found that with the prediction time set to 12months,the average relative error of the storage amount predicted was 7.77%,the average relative error of the requisition amount predicted was 7.83%,and the average relative error of the inventory value was 3.59%,which basically meets the accuracy requirements for the inventory value forecasting in the spare parts management of nuclear power plants.Keywords:nuclear power plant;spare parts storage and management;storage amount;requisition amount;inventory value;inventory forecasting0引言备品备件的保障对核电站的安全稳定运行具有重要意义,然而过高的备件库存会增加电厂的运营成本,因此,需要对备件库存进行管控,在保障供应和控制库存之间寻求一个合理的平衡点[1-2]。
211018415_某机械陀螺长贮性能演变规律及性能退化模型研究
第20卷第3期装备环境工程2023年3月EQUIPMENT ENVIRONMENTAL ENGINEERING·15·某机械陀螺长贮性能演变规律及性能退化模型研究张世艳,吴护林,赵方超,谭甜甜,杨小奎(西南技术工程研究所 弹药贮存环境效应重点实验室,重庆 400039)摘要:目的针对长期贮存后机械陀螺的性能退化会影响制导系统侧偏和射程的问题,提出一种性能退化预测模型的建立方法,用于掌握机械陀螺长贮性能退化规律。
方法首先,针对机械陀螺结构特性和贮存环境,确定敏感应力为温度,加速模型为阿仑尼乌斯模型,开展机械陀螺的加速贮存试验。
其次,对加速贮存试验过程中的机械陀螺进行周期性的参数检测,分析各性能参数随试验时间的性能退化演变规律,确定垂直漂移为其退化敏感参数。
最后,拟合垂直漂移参数在各温度应力下的性能退化曲线,建立性能退化轨迹模型。
结果采用实际自然环境贮存6、7、8、10 a的性能数据对模型进行验证,模型预测准确度分别为86.70%、96.28%、91.53%、85.92%。
结论建立的性能退化模型评估准确度在85%以上,该模型可应用于指定贮存时间下机械陀螺仪的性能退化行为预测。
关键词:机械陀螺;温度;性能退化;预测模型中图分类号:TJ04 文献标识码:A 文章编号:1672-9242(2023)03-0015-07DOI:10.7643/ issn.1672-9242.2023.03.002Performance Evolution Law and Degradation Model of MechanicalGyroscope during Long-term StorageZHANG Shi-yan, WU Hu-lin, ZHAO Fang-chao, TAN Tian-tian, YANG Xiao-kui(CSGC Key Laboratory of Ammunition Storage Environment Effects, Southwest Institute of Technology andEngineering, Chongqing 400039, China)ABSTRACT: The work aims to propose a method for establishing a performance degradation prediction model aiming at the problem that the performance degradation of mechanical gyroscope will affect the sideslip and range of guidance system after long-term storage, so as to master the performance degradation law of mechanical gyroscope during long-term storage. Firstly, according to the structure characteristic and storage environment of the mechanical gyroscope, the sensitive parameter was de-termined as temperature, the acceleration model was Arrhenius equation model, and the accelerated storage test was carried out to mechanical gyroscope. Secondly, the parameters of the mechanical gyroscope were periodically detected during the acceler-ated storage test and the performance degradation evolution law of the mechanical gyroscope under each performance parameter with the test time was analyzed, thus determining vertical drift as the degradation sensitive parameter. Finally, the performance收稿日期:2021–12–09;修订日期:2022–08–15Received:2021-12-09;Revised:2022-08-15作者简介:张世艳(1985—),女,硕士。
压缩空气储能系统用多级离心压缩机进口导叶调节策略研究
Adjustment Strategy of Inlet Guide Vane of MultistageCentrifugal Compressor Applied in CAES *Kai-xuan Wang 1,2Zhi-tao Zuo 1,2,3Qi Liang 1Wen-bin Guo 1Ji-xiang Chen 1,2Hai-sheng Chen 1,2,3,*(1.Institute of Engineering Thermophysics,Chinese Academy of Science;2.University of Chinese Academy of Science;3.National Energy Large Scale Physical Energy Storage Technology R&D Center (Bijie))Abstract:In the process of compressed air energy storage system working,the internal pressure of the gas storage device continues to rise,which requires the compressor to work in a wide pressure ratio range.High efficiency variable operating condition is the core requirement of compressors in compressed air energy storage system.In order to achieve this design goal,it is necessary to adopt appropriate adjustment methods and adjustment strategies.The adjustable inlet guide vane is simple in structure,can be operated in the working process,and can be automated by the servo device,which is one of the most suitable adjustment methods for the compressor in the compressed air energy storage system.This paper takes a 4-stage centrifugal compressor in compressed air energy storage system as the research object,and establishes a performance prediction method suitable for the multi-stage centrifugal compressor under varying working conditions.The performance curve of the single-stage centrifugal compressor is obtained by numerical simulation,and the performance superposition program of the stage is written to obtain the performance curve of the whole machine.The performance data of multistage centrifugal compressor is fitted to polynomial function by least square method,and the adjustable inlet guide vane adjustment strategy program is established by genetic algorithm with isentropic efficiency as optimization objective,inlet guide vane opening as optimization variable and outlet pressure or flow of the whole machine as constraint conditions.Keywords:Inlet Guide Vane Adjustment;Multistage Centrifugal Compressor;Adjustment Strategy摘要:压缩空气储能系统在储能过程中,储气装置内部压力不断升高,这要求压缩机在较大压比范围内工作。
引信步进应力加速试验贮存寿命预测研究
第21卷第2期装备环境工程2024年2月EQUIPMENT ENVIRONMENTAL ENGINEERING·51·武器装备引信步进应力加速试验贮存寿命预测研究姚松涛1,崔洁1*,赵河明1,彭志凌1,孔德景2(1.中北大学 长治产业技术研究院,山西 长治 046012;2.中国船舶集团有限公司第七一四研究所,北京 100101)摘要:目的针对某机电引信加速寿命试验数据,采用传统统计分析方法存在计算量大、寿命预测精度难以保证的问题,开展与智能算法相结合的引信贮存寿命预测研究。
方法针对步进应力加速寿命试验数据,采用贝叶斯理论的环境因子法,对各级应力下的贮存时间进行折合计算。
利用进化策略对粒子群算法进行改进,进而对所建立的BP神经网络预测模型的全局参数进行调整和优化,突破传统方法的局限。
将折合后的试验时间、样本量、应力水平作为网络输入,失效数作为输出,来预测引信贮存寿命。
结果利用训练好的BP神经网络预测引信在正常应力水平下的失效数,计算其贮存可靠度。
在迭代402次后,模型找到最优解,且预测误差在1%以内。
结论步进应力加速寿命试验与智能算法相结合的方法计算过程简单,预测精度较高,可有效提高引信贮存寿命的预测精度。
关键词:步进应力加速寿命试验;BP神经网络;引信;改进粒子群优化算法;Bayes理论;环境因子中图分类号:TJ430 文献标志码:A 文章编号:1672-9242(2024)02-0051-08DOI:10.7643/ issn.1672-9242.2024.02.007Storage Life Prediction of Fuze under Step Stress Accelerated TestYAO Songtao1, CUI Jie1*, ZHAO Heming1, PENG Zhiling1, KONG Dejing2(1. Changzhi Industrial Technology Research Academy, North University of China, Shanxi Changzhi 046012, China;2. The 714th Research Institute of China Shipbuilding Industry Corporation, Beijing 100101, China)ABSTRACT: The work aims to study the storage life prediction of fuze combined with the intelligent algorithm against the problem that the traditional statistical analysis method adopted for accelerated test data of fuze in a certain motor has high computational complexity and cannot guarantee the storage life prediction accuracy. For the step stress accelerated life test data, the environmental factor method based on Bayesian theory was adopted to convert the storage time at different stress levels. The particle swarm algorithm was improved by evolutionary strategy to adjust and optimize the global parameters of the BP neural network, breaking through the limitations of the traditional method. The converted test time, sample size, and stress level were used as inputs to the network, and the failure count was used as the output to predict the fuze storage life.The trained BP neural network was used to predict the failure count of the fuze under normal stress levels, and then calculate its storage reliability. After 402 iterations, the model found the optimal solution with a prediction error within 1%. Therefore, the combination of step stress accelerated life test and intelligent algorithm can effectively improve the prediction accuracy of fuze storage life.收稿日期:2023-12-17;修订日期:2024-02-03Received:2023-12-17;Revised:2024-02-03引文格式:姚松涛, 崔洁, 赵河明, 等. 引信步进应力加速试验贮存寿命预测研究[J]. 装备环境工程, 2024, 21(2): 51-58.YAO Songtao, CUI Jie, ZHAO Heming, et al. Storage Life Prediction of Fuze under Step Stress Accelerated Test[J]. Equipment Environmental Engineering, 2024, 21(2): 51-58.*通信作者(Corresponding author)·52·装备环境工程 2024年2月KEY WORDS: step stress accelerated life test; BP neural network; fuze; improved particle swarm optimization algorithm;Bayes theory; environmental factor引信是自主探测识别目标、敏感发射环境,综合利用网络平台信息进行安全与解除保险控制,在高动态复杂弹目交会条件下,按预定策略引爆或引燃弹药战斗部装药的一次性使用长期贮存的控制系统。
大学计算机基础教学基本要求

第七页,共35页。
大学计算机基础教学的现状与发展趋势
大学计算机基础教学的现状 起步创始(70、80年代):
计算机程序设计普及阶段
普及规范(90年代):
“文化基础—技术基础—应用基础”三个层次的课程体系
深化提高(21世纪)
科学、系统地构建计算机基础教学的“能力体系—知 识体系—课程体系”,
为郝兴伟、黄心渊、李波、卢虹冰、苏中滨、王浩、杨志强、张龙、张铭。
2013年11月3日:在高校计算机课程教学系列报告会期间,起草小组成员第2次
会议,确定课程基本要求内容框架
2013年11月—2014年6月:开展各专题研究,陆续汇总形成初稿; 2014年7月12日:在北京召开《教学基本要求》起草小组第3次工作会议,对白
(3)系统型。基于宽度和深度兼顾的教学设计原则 从计算思维培养角度组织和表述教学内容,在计算系统理解和 问题求解方法上同时体现广度和深度的要求。一般课程学时要 求比较多
28
第二十八页,共35页。
课程实施方案(附录)
针对“宽专融”三种类型,给出14门典型课程的实施方案案例
基本格式
1、课程总体描述
教学内容改革 教学方法改革
4
第四页,共35页。
《基本要求》(白皮书)编写历程:
教指委首先组织全体委员开展 了大量的调研与研究工作
以教育部高等教育司“大学 计算机课程改革项目”研究 为契机,组织近百所高校围 绕若干重要问题展开深入研 究。
5
第五页,共35页。
《基本要求》(白皮书)编写历程: 2013年7月30日:在哈尔滨召开起草小组成员第1次会议,组长为何钦铭,成员
次工作会议,部分反馈意见进一步 讨论
2015年8月29日:起草小组第7
电子汽车充电桩管理系统:网络平台版说明书
The Orderly Charging and Discharging Dispatching ManagementSystem of Electric Vehicle under the InternetYuman ZhangSchool of North China Electric Power University, Beijing 102206, China****************Keywords: Internet; Electric vehicle; Charge-discharge; Dispatch; Network platformAbstract. The orderly charging and discharging management and dispatching system of electric vehicle is researched and designed based on internet in order to achieve orderly dispatching and management of electric vehicle in peak load regulation. Researching and analyzing the function of main components (power grid side, platform data center, platform management system, charging pile and client) of system and designing the hardware and software of the system. To optimize the data processing part of backstage network server, combining with the security and economy of grid and the maximization of owner benefit by using multi-objective and multi-constraint optimization model. System can realize bidirectional communication and real-time update regulation and control function among grid side, system backstage and client through internet and protect the liability and high efficiency of electric vehicle in grid-connected dispatching.IntroductionIn recent years, with the development of electric vehicle scale and the coming age of internet and big data, under the “Internet plus” pattern, the widespread use of electric vehicle has driven the development of global electric traffic internet and the global electric vehicle will also become the important basis of global traffic internet. In the internet, intelligent processing and high-efficient transfer in information can develop networking of charge-discharge technology for electric vehicles. In addition to realize cleaning and energy-saving transport, an increasing number of electric vehicles also show that they can be able to provide reliable and high-quality power supply to the power grid.For the technology development of electric vehicle in peak load regulation, the international society puts forward the policy of V2G (Vehicle-to-Grid )in recent years which takes the electric vehicle as movable distributed energy storage device and feeds back the electric energy to power grid under the premise of satisfying the driving demand of the users of electric vehicle. The current studies show that it is a challenge to dispatch electric vehicles in grid connection. Domestic and overseas studies mainly concentrate on relevant applications of V2G, frequency modulation, optimal unit combination, as well as costs and benefits of the networked electric vehicles in economy or technology, and influences on the environment. However, reliability and operability of electric vehicles’ power connection can be affected by distribution uncontrollability of electric vehicles and subjectivity of owners to a great extent. As a result, it will be of great importance in studying the organic combination of the networked electric vehicles and the internet and orderly charge-discharge management strategy of electric vehicles in practical applications.Based on the existing grid-connected technology of electric vehicles, the author studied power grid parameters and user demands under different sub-regions and provided a kind of internet-oriented charge-discharge control and management strategy, which realizes peak load regulation of electric vehicles via two-way communication of the internet and webpage platform. System CompositionThe whole system consist of four parts which are network platform, charging pile, power grid side and client.7th International Conference on Education, Management, Information and Mechanical Engineering (EMIM 2017)Network platform as a network server is a integrated platform for data collection, storage, processing and maintenance of electric vehicle charging and discharging. And it consists of computer, network equipment, storage equipment, and other peripheral devices and platform application software. Network platform is the core of the whole system which can collect power grid information, release charging and discharging plan, calculate and operate regularly and also can operate and implement the workflow.Charging pile is a charging device for electric vehicle. The charging pile can monitor the state of electric vehicle real-timely and share the information with server and it also is a direct link between network platform and client.Client as user side is an interface for owner to participant in electricity management. Users can inquire the information of the power grid load demand, electricity price forecasting and the place and state of charging pile through web platform and also they can make confirmation to participant in grid connection from client and make a series of operations to make money, such as charge in low and discharge in peak.[1]Communication relationships among the four are as follows:Overall Design SchemeDuring the operational process of the whole system, the network platform will be divided into data center and management system specifically. The data of power grid real-time frequency, power grid load forecasting and the state prediction of V2G will be sent to platform data center from power grid side according to the peak load regulation demand information. Data center deals with these data through relevant algorithm strategy and on the premise of protecting the power grid security and users interest, makes a plan of V2G charging and discharging and sends the charging and discharging plan and each order to platform management system. After accepting the plan, management sends information to charging pile and client in order to release demand time, demand for electricity quantity and price forecasting and at the same time management system feeds back the electricity quantity of electric vehicle to platform through charging pile and feeds back the top and bottom limit of charging participation to the platform through users. Users as the direct connection between charging pile and data center feeds back the charging and discharging running condition of charging pile and electric vehicle to data center real-timely in order to update and adjust the plan and thus reach the bidirectional communication. Charging pile reasonably chooses vehicle distribution and the charging and discharging power in order to guarantee the execution of the charging and discharging. Users choose whether to participate in grid connection under the condition of ensuring the orderly discharging of vehicles and the information of the real-time electricity quantity also be verified by charging pile and thus get the permission of battery charging and discharging. The specific operation chart is shown in fig. 1.Figure 1. System run chartSystem Hardware Design. The main hardware of system basically consists of three parts. The background control center which consists of platform database and background server, the data transfer unit which consists of concentrator and wireless devices and field collection device which consists of charging pile as a main body. The specific schematic diagram as shown in fig. 2.[2]Figure 2. System hardware structure diagramThe unit circuit design of whole control system is as follows:(1)Master ControllerA master controller selects a PLC controller, which has a series of functions, including logical operation, timing, technology, displacement, self-diagnosis and monitoring, as well as a little analog quantity I/O, arithmetic operation, data transmission, remote I/O and communication. As a result, the controller was selected as the core control unit of the hardware system to launch, operate, monitor and close the charging process in real time [3].(2)Serial Interface CircuitsIn the system, four serial interfaces are connected with display screen, wireless module, RS232 interface’s card reader and RS485 interface’s electric energy meter. The display is RS232 level andcommunicates with MCU through level switch. The communication protocol of display screen and MCU is the Modbus RTU communication protocol. MCU is used as the master, while display screen is the slave. The card reader belongs to TTL level and it can be connected with MCU directly. Moreover, the protocol proposed by the card reader module is applied to communicate. TTL serial port is used in micropower wireless module. Level 2.0 electric energy meter is selected as the electric energy meter for battery charging measurement [4], which has the current specification of 5A. The processor PCL realizes information interaction between electric energy measuring modules through RS485 bus interface circuits, which are shown in Fig. 3. Energy metering module abides by the DL/T645-2007 communication specification. Electric energy value on the meter can be used as the electric energy measurement of the charging piles. At the same time, current and voltage on the ammeter can be used to judge whether there is overcurrent, overvoltage and undervoltage in the charge-discharge process. If so, relevant measures should be applied to deal with it[5].Figure 3. RS485 interface circuit diagram(3) Control Guiding CircuitsThe confirmative connection circuits between charging piles and charging cables, as well as control guiding circuits between charging piles and vehicle-mounted battery chargers are able to control the guiding circuits to finish connective confirmation of charging piles and electric vehicles before charging, power, identification of current-carrying capability for charge-discharge connecting devices, as well as monitoring of the charge-discharge process. The circuits are preconditions for charging piles, battery chargers and battery management system to realize information exchange. With the different voltage values on detection points, MCU is used to judge the state and the interface circuits are shown in Fig. 4. Generally speaking, the circuits should be equipped with stable output of +12V and bipolar PWM signal functions. In the PWM state, peak and valley should be +12V and -12V, respectively. By virtue of PWM pin of PLC, amplifying circuits Q1 and Q2 are amplified and outputted from Cp after 6N135 isolation, where R7 is the output matched resistance. According to GB/T20234.2[6], resistance should be 1000 Ω. R5 has the metering function and protects LED[7].Figure 4. Control Guiding Circuits diagramSystem Software Design. System program mainly consists of system initialization, system self-inspection, swiping card effective identification, user validation, system connection validation and the real-time monitoring during charging process. Realize reading user information and settlement at the same time in the part of user authentication. In the part of real-time monitor during charging process, mainly collecting real-timely and analyzing and processing the CP signal in order to ensure the connection status of charging cable, the situation of surplus electric quantity and device state. Charging pile completes interaction control through display screen. Charging and discharging model offers multiple choices. The charging and discharging can be set according to time, electric quantity and amount of money and also can be set to full directly or on the minimum value. Charging process is similar to discharging process. Now list the overall flow chart of the charging program which as shown in fig. 5.Figure 5. Software design flow chartRule Design. System internal procedure and external management execute the command according to certain rules which are divided into pricing rule, user participation rule, information processing rule and information release rule.1. Pricing RuleCharge capacity not only can execute tariff but also can participate in electric power transaction directly and buy low charge capacity. The electric quantity of charging can be used by themselves and also can be sold to power grid as distributed power. Release the price forecasting to users through web platform.2. User Participation RuleUsers participate in power grid peak shaving and valley filling through active selection and are encouraged to participate by the market mechanism which caused by the electricity price difference. Users can obtain the information of price, discharge capacity and charging pile distribution in web platform and also can choose the participation discharge capacity and participation time. Once the users confirm to participate and input data in web platform they cannot exit the charging and discharging plan. The users’ action will be regulated by the users credit line mechanism in the webplatform. The user flow chart is shown in fig. 6[8].Figure 6. The flow chart of user charging3. Information Processing RuleProcessing the information collected by power grid is the important gist to make charging and discharging plan in network data center. Multi-objective optimization model is adopted as the processing rule because of the randomness of charging and discharging behavior of the owner in order to make electric vehicle charge and discharge reasonably and satisfy the driving demand of electric vehicle and the economic interest of the owner at the same time of protecting the safe and economical operation of power grid. This paper only gives the confirmation of objective function and the making of constraints condition as a calculation basis for reference. [9](1) Objective FunctionSynthetically considering the common interests of power grid side and owner, four objective functions are established from the perspective of power grid side and owner.1) Minimal node voltage deviation and active loss of power gridBased on load prediction data of power grid, power flow equation is used to calculate.()122111min N N i t i U t f == =∆∑∑ (1) 121min ()N t f P t ==∑ (2)In the formula:()i U t ∆ is the voltage excursion of note i at t ; ()P t is the power grid loss at t ; 1N is the charge-discharge periods in a day; 2N is node number.2) Lowest networked service costsPower grid is used to provide V2G state prediction. A cost function is listed as follows []31min ()()v V f pri t P t t =∆∑ (3)In the formula:1()v pri t is electricity price to servicers paid by power grid as networking vehiclesat t ; ()V P t is the input power from electric vehicles to power grid at t ;t is the discharge time.3) Maximal benefits of ownersFrom the perspective of owners, predictive data of electricity price is used. Charging costs should be reduced, for the sake of ensuring maximal economic benefits for owners, namely the charge cost function is shown as follows:1421min ()P ()()P ()N g G v V t f pri t t t pri t t t = =∆−∆ ∑ (4)In the formula:()g pri t is the favorable charge price for owners given by power grid at t ;2()v pri t represents the electricity price from servicers of vehicle networking to owners at t ; P ()G t means the charge power of electric vehicles at t .In weight allocation, grid power supply quality should be prioritized. Secondly, owners’ participation should be encouraged. However, service costs of power grid shouldn’t be too high. Last but not least, it is necessary to reduce power loss, namely the target priority is ranked as 1432f f f f >>> (2) Constraint Conditions1) Equality constraintsPower flow constraint conditions must be satisfied. The power flow equation is applied to calculate node voltage and power grid loss, so the power flow constraint conditions must be satisfied.[10](cos sin )i i i j ij ij ij ij j i P P U U G B θθ∈∆=−+∑ (5)(sin cos )i i i j ij ij ij ij j i Q Q U U G B θθ∈∆=−−∑ (6)21,...,i N =In th formula:i P and i Q are active power and inactive power of the node i respectively;i U isthe voltage of node i , ij G and ij B stand for the conductivity susceptance between the nodes iand j ; ij δrepresents the voltage phase angle difference between node i and j .2) Inequality constraints①Limited by battery life protection, it is impossible to discharge all electricity in batteries, namely (1)E SOC DOD ≤−− (7) In the formula:E is the available electric quantity from electric vehicles; SOC is surplus capacity of batteries ,DOD stands for discharge depth of batteries.② When electric vehicles discharge, due to large loss in batteries, only to have the higher load rate in lines can electric vehicles discharge in power connection. After discharging, load rate of lines can’t be too low, namely()l h L L t L ≤≤ (8)In the formula:l L and h L stand for the lowest and highest discharge load rates, respectively.4. Information Release Rule(1)The information which is released in the network platform by the background has two main parts, the demand information and the basic information.(2)The specific information of electricity demand is charging and discharging plan. Distribute the electricity demand to client platform in fixed time. Collecting the users’ feedback and feeding back the adjustable capacity to the power grid side within the fixed time.(3)Release the electricity price forecasting information, the position of the charging pile and use condition to the platform real-timely. Guarantee the effectiveness of information as the basis of client choice.Work ProcessDeal with the data from power grid, such as loading forecasting, etc. Make charging and discharging plan.Release the demand of electric vehicle discharge capacity and price information in web platform in the early time.The owner decides whether they participate in discharging in the scheduled time.Judge whether the owners have ability to discharge by detecting the electric vehicle battery parameters.Feed back the charging and discharging plan to grid according to the participation situation which users choose.The owners park the car around the charging pile in advance and connect the charging wire and then verify the order.When time to, the platform will control the charging pile automatically and make the electric vehicle start charging.System Function(1)Power Bidirectional Exchange Function: Power can be transmitted to grid (electric vehicle discharge state) and also the power can be absorbed from grid (electric vehicle charge state).(2)Bidirectional Communication Function: Instructions can be accepted and the power information can be sent remotely. Peak regulation instruction can be sent to the electric vehicle by the dispatching of power grid through the communication network within charge station. The response of the electric vehicle is monitored and recorded and through communication network the response is fed back to the charging station (backstage management system).(3)Real-Time Control: It has the function of Real-time information feedback, real-time control, the real-time updated information and demand, the rational allocation of resources.ConclusionThis paper discusses the system structure of orderly charging and discharging management of electric vehicle and dispatching system based on the internet, analyzes the composition and function of four main units which are network platform, charging pile, power grid side and client and realize the function of bidirectional communication, bidirectional power exchange, real-time update and regulation and control. This system can allow users to use handheld terminal to realize the functions of battery capacity status query, charging pile position navigation, charging and discharging forecasting and set independently and provide a platform for the interaction between owner and power grid. At the same time, in network manager data processing section, the V2G proposed during making charging and discharging plan in multi-objective and multi-constraints model of distribution application can deal with the interest of power grid and owner very well and also it can ensure the safe and economic operation of power grid and guide owner to participate in the net sevice actively. This system puts forward effective solution scheme for the question of dispatchingand regulation of electric vehicle in peak load regulation and have a certain reference value of the implementation and popularization of V2G policy.References[1] X.R. Gong, R. Liu and X.M. Qin: Internet Oriented Design and Application of IntelligentCharging System of Electric Vehicle, Electricity power construction,(2015),No.7,p.222.[2] Z.M. Guo: The design and implementation of Electric vehicle charging stations real-timeInternet electric energy metering system, Electronic world,(2016), No.20,p.81.[3] J.Y. Yuan, X.D. Wang, D.Q. Wang and H.M. Wang: The Study of Electric Vehicle’s ACCharging Pile Control System Based on PLC, Journal of Qingdao university (engineering technology edition),(2015), No.2,p.38.[4] Q/CSG 11516.8-2010, Acceptance Specification of Electric Vehicle Charging Station andCharging Pile, Guangzhou: China southern power grid company ,2010:[5] G. Wen, H.J. Shang, C.B. Zhu and R.G. Lu: The System Design of Electric Vehicle ACCharging Pile, Modern Electronic Technology,(2012), No.21,p.124.[6] GB/T 20234.2—2011, The part 2 of Conduction Charging Connectioin Device of ElectricVehicle : AC charging interface, Beijing: China Standards Press, 2012:[7] K. Xu, Z.A. Zhou, D.Y. Wu, W.B. Geng and X.D. Li: The Control System Design of ElectricVehicle AC Charging Pile, Journal of Henan Science and Technology University (natural sciences edition),(2016), No.3,p.47.[8] T.R. Gong, T. Li and R. Liu: Internet Oriented Operation Analysis of Electric VehicleIntelligent Charging System, Power supply and consumption,(2015), No.12,p.11.[9] H.L. Li, X.M.Bai and W.Tan: The Study of Electric Vehicle Network Access Technology inthe Application of Distribution Network, Proceedings of the CSEE,(2012), No.S1, p.22. [10] G.Y. Li: Power System Analysis Basis (China Machine Press, China 2011.)。
华为 OceanStor Dorado 5000 6000 全闪存存储系统产品介绍说明书

Huawei OceanStor Dorado 5000/6000are mid-range storage systems in the OceanStor Dorado all-flash series,and are designed to provide excellent data service experience for enterprises.Both products are equipped with innovative hardware platform,intelligent FlashLink®algorithms,and an end-to-end (E2E)NVMe architecture,ensuring the storage systems deliver a 30%higher performance than the previous generation,and achieve the latency down to just 0.05ms.The intelligent algorithms are built into the storage system to make storage more intelligent during the application operations.Furthermore,the five-level reliability design ensures the continuity of core business.Excelling in scenarios such as OLTP/OLAP databases,server virtualization,VDI,and resource consolidation,OceanStor Dorado 5000/6000all-flash systems are smart choices for medium and large enterprises,and have already been widely adopted in the finance,government,healthcare,education,energy,and manufacturing fields.The storage systems are ready to maximize your return on investment (ROI)and benefit diverse industries.OceanStor Dorado 5000/6000All-Flash Storage Systems 30%higher performance than theprevious generation E2E NVMe for 0.05ms of ultra-low latencyFlashLink®intelligent algorithmsSCM intelligent cache acceleration for 60%lower latencyDistributed file system with 30%higher performanceLeading Performance withInnovative Hardware✓The intelligent multi-protocol interface module hosts the protocol parsing previously performed by the general-purpose CPU, expediting the front-end access performance by 20%.✓The computing platform offers industry-leading performance with 25% higher computing power than the industry average.✓The intelligent accelerator module analyzes and understands I/O rules of multiple application models based 3-layer intelligent management:•365-day capacity trends prediction •60-day performance bottleneck prediction •14-day disk fault prediction •Immediate solutions for 93%ofproblemsSAN&NAS convergence,storage and computing convergence,and cross-gen device convergence for efficient resource utilizationFlashEver:No data migration over 10years for 3-gen systems Efficient O&M with IntelligentEdge-Cloud SynergyComponent reliability :Wear leveling and anti-wear levelingArchitecture and product reliability :0data loss in the event of failures of controllers,disk enclosures,or three disksSolution and cloud reliability :The industry's only A-A solution for SAN and NAS,geo-redundant 3DC solution,and gateway-free cloud backup Always-On Applications with5-Layer ReliabilityProduct Features Ever Fast Performance with Innovative Hardware Innovative hardware platform: The hardware platform of Huawei storage enables E2E data acceleration, improving the system performance by 30% compared to the previousgeneration.on machine learning frameworks to implement intelligentprefetching of memory space. This improves the read cache hit ratio by 50%.✓SmartCache+ SCM intelligent multi-tier caching identify whether or not the data is hot and uses different media tostore it, reducing the latency by 60% in OLTP (100% reads) scenarios.✓The intelligent SSD hosts the core Flash Translation Layer (FTL) algorithm, accelerating data access in SSDs andreducing the write latency by half.✓The intelligent hardware has a built-in Huawei storage fault library that accelerates component fault location anddiagnosis, and shortens the fault recovery time from 2hours to just 10 minutes.Intelligent algorithms: Most flash vendors lack E2E innate capabilities to ensure full performance from their SSDs. OceanStor Dorado 5000/6000 runs industry-leading FlashLink® intelligent algorithms based on self-developed controllers, disk enclosures, and operating systems.✓Many-core balancing algorithm: Taps into the many-core computing power of a controller to maximize the dataprocessing capability.✓Service splitting algorithm: Offloads reconstruction services from the controller enclosure to the smart SSD enclosure to ease the load pressure of the controller enclosure for moreefficient I/O processing.✓Cache acceleration algorithm: Accelerates batch processing with the intelligent module to bring intelligence to storagesystems during application operations.The data layout between SSDs and controllers is coordinated synchronously.✓Large-block sequential write algorithm: Aggregates multiple discrete data blocks into a unified big data blockfor disk flushing, reducing write amplification and ensuringstable performance.✓Independent metadata partitioning algorithm: Effectively controls the performance compromise caused by garbagecollection for stable performance.✓I/O priority adjustment algorithm: Ensures that read and write I/Os are always prioritized, shortening the accesslatency.FlashLink® intelligent algorithms give full play to all flash memory and help Huawei OceanStor Dorado achieve unparalleled performance for a smoother service experience.E2E NVMe architecture for full series: All-flash storage has been widely adopted by enterprises to upgrade existing ITsystems, but always-on service models continue to push IT system performance boundaries to a new level. Conventional SAS-based all-flash storage cannot break the bottleneck of 0.5 ms latency. NVMe all-flash storage, on the other hand, is a future-proof architecture that implements direct communication between the CPU and SSDs, shortening the transmission path. In addition, the quantity of concurrencies is increased by 65,536 times, and the protocol interaction is reduced from four times to two, which doubles the write request processing. Huawei is a pioneer in adopting end-to-end NVMe architecture across the entire series. OceanStor Dorado 5000/6000 all-flash systems use the industry-leading 32 Gb FC-NVMe/100 Gb RoCE protocols at the front end and adopt Huawei-developed link-layer protocols to implement failover within seconds and plug-and-play, thus improving the reliability and O&M. It also uses a 100 Gb RDMA protocol at the back end for E2E data acceleration. This enables latency as low as 0.05 ms and 10x faster transmission than SAS all-flash storage. Globally shared distributed file system: The OceanStor Dorado 5000/6000 all-flash storage systems support the NAS function and use the globally shared distributed file systems to ensure ever-fast NAS performance. To make full use of computing power, the many-core processors in a controller process services concurrently. In addition, intelligent data prefetching and layout further shorten the access latency, achieving over 30% higher NAS performance than the industry benchmark.Linear increase of performance and capacity: Unpredictable business growth requires storage to provide simple linear increases in performance as more capacity is added to keep up with ever-changing business needs. OceanStor Dorado5000/6000 support the scale-out up to 16 controllers, and IOPS increases linearly as the quantity of controller enclosures increases, matching the performance needs of the future business development.Efficient O&M with Intelligent Edge-Cloud Synergy Extreme convergence: Huawei OceanStor Dorado 5000/6000 all-flash storage systems provide multiple functions to meet diversified service requirements, improve storage resource utilization, and effectively reduce the TCO. The storage systems provide both SAN and NAS services and support parallel access, ensuring the optimal path for dual-service access. Built-in containers support storage and compute convergence, reducing IT construction costs, eliminating the latency between servers and storage, and improving performance. The convergence of cross-generation devices allows data to flow freely, simplifying O&M and reducing IT purchasing costs.On and off-cloud synergy: Huawei OceanStor Dorado5000/6000 all-flash systems combine general-purpose cloud intelligence with customized edge intelligence over a built-inintelligent hardware platform, providing incremental training and deep learning for a personalized customer experience. The eService intelligent O&M and management platform collects and analyzes over 190,000 device patterns on the live network in real time, extracts general rules, and enhances basic O&M. Intelligence throughout service lifecycle: Intelligent management covers resource planning, provisioning, system tuning, risk prediction, and fault location, and enables 60-day and 14-day predictions of performance bottleneck and disk faults respectively, and immediate solutions for 93% of problems detected.FlashEver: The intelligent flexible architecture implements component-based upgrades without the need for data migration within 10 years. Users can enjoy latest-generation software and hardware capabilities without investing again in the related storage software features.Always-On Applications with 5-Layer Reliability Industries such as finance, manufacturing, and carriers are upgrading to intelligent service systems to meet the strategy of sustainable development. This will likely lead to diverse services and data types that require better IT architecture. Huawei OceanStor Dorado all-flash storage is an ideal choice for customers who need robust IT systems that consolidate multiple types of services for stable, always on services. It ensures end-to-end reliability at all levels, from component, architecture, product, solution, all the way to cloud, supporting data consolidation scenarios with 99.9999% availability. Benchmark-Setting 5-Layer ReliabilityComponent –SSDs: Reliability has always been a top concern in the development of SSDs, and Huawei SSDs are a prime example of this. Leveraging global wear-leveling technology, Huawei SSDs can balance their loads for a longer lifespan of each SSD. In addition, Huawei's patented anti-wear leveling technology prevents simultaneous multi-SSD failures and improves the reliability of the entire system.Architecture –fully interconnected design: Huawei OceanStor Dorado 5000/6000 adopt the intelligent matrix architecture (multi-controller) within a fully symmetric active-active (A-A) design to eliminate single points of failure and achieve high system availability. Application servers can access LUNs through any controller, instead of just a single controller. Multiple controllers share workload pressure using the load balancing algorithm. If a controller fails, other controllers take over services smoothly without any service interruption. Product –enhanced hardware and software: Product design is a systematic process. Before a stable storage system is commercially released, it must ensure that it meets the demands from both software and hardware, and can faultlesslyhost key enterprise applications. The OceanStor Dorado5000/6000 are equipped with hardware that adopts a fully redundant architecture and supports dual-port NVMe and hot swap, preventing single points of failure. The innovative 9.5 mm palm-sized SSDs and biplanar orthogonal backplane design provide 44% higher capacity density and 25% improved heat dissipation capability, and ensure stable operations of 2U 36-slot SSD enclosures. The smart SSD enclosure is the first ever to feature built-in intelligent hardware that offloads reconstruction from the controller to the smart SSD enclosure. Backed up by RAID-TP technology, the smart SSD enclosure can tolerate simultaneous failures of three SSDs and reconstruct 1 TB of data within 25 minutes. In addition, the storage systems offer comprehensive enterprise-grade features, such as 3-second periodic snapshots, that set a new standard for storage product reliability.Solution –gateway-free active-active solution: Flash storage is designed for enterprise applications that require zero data loss or zero application interruption. OceanStor Dorado5000/6000 use a gateway-free A-A solution for SAN and NAS to prevent node failures, simplify deployment, and improve system reliability. In addition, the A-A solution implements A-A mirroring for load balancing and cross-site takeover without service interruption, ensuring that core applications are not affected by system breakdown. The all-flash systems provide the industry's only A-A solution for NAS, ensuring efficient, reliable NAS performance. They also offer the industry's firstall-IP active-active solution for SAN, which uses long-distance RoCE transmission to improve performance by 50% compared with traditional IP solutions. In addition, the solution can be smoothly upgraded to the geo-redundant 3DC solution for high-level data protection.Cloud –gateway-free cloud DR*: Traditional backup solutions are slow, expensive, and the backup data cannot be directly used. Huawei OceanStor Dorado 5000/6000 systems provide a converged data management solution. It improves the backup frequency 30-fold using industry-leading I/O-level backup technology, and allows backup copies to be directly used for development and testing. The disaster recovery (DR) and backup are integrated in the storage array, slashing TCO of DR construction by 50%. Working with HUAWEI CLOUD and Huawei jointly-operated clouds, the solution achieves gateway-free DR and DR in minutes on the cloud.Technical SpecificationsModel OceanStor Dorado 5000 OceanStor Dorado 6000 Hardware SpecificationsMaximum Number ofControllers3232Maximum Cache (DualControllers, Expanding withthe Number of Controllers)256 GB-8 TB 1 TB-16 TBSupported Storage Protocols FC, iSCSI, NFS*, CIFS*Front-End Port Types8/16/32 Gbit/s FC/FC-NVMe*, 10/25/40/100 GbE, 25/100 Gb NVMe over RoCE*Back-End Port Types SAS 3.0/ 100 Gb RDMAMaximum Number of Hot-Swappable I/O Modules perController Enclosure12Maximum Number of Front-End Ports per ControllerEnclosure48Maximum Number of SSDs3,2004,800SSDs 1.92 TB/3.84 TB/7.68 TB palm-sized NVMe SSD,960 GB/1.92 TB/3.84 TB/7.68 TB/15.36 TB SASSSDSCM Supported800 GB SCM*Software SpecificationsSupported RAID Levels RAID 5, RAID 6, RAID 10*, and RAID-TP (tolerates simultaneous failures of 3 SSDs)Number of LUNs16,38432,768Value-Added Features SmartDedupe, SmartVirtualization, SmartCompression, SmartMigration, SmartThin,SmartQoS(SAN&NAS), HyperSnap(SAN&NAS), HyperReplication(SAN&NAS),HyperClone(SAN&NAS), HyperMetro(SAN&NAS), HyperCDP(SAN&NAS), CloudBackup*,SmartTier*, SmartCache*, SmartQuota(NAS)*, SmartMulti-Tenant(NAS)*, SmartContainer* Storage ManagementSoftwareDeviceManager UltraPath eServicePhysical SpecificationsPower Supply SAS SSD enclosure: 100V–240V AC±10%,192V–288V DC,-48V to -60V DCController enclosure/Smart SAS diskenclosure/Smart NVMe SSD enclosure: 200V–240V AC±10%, 100–240V AC±10%,192V–288V DC, 260V–400V DC,-48V to -60V DC SAS SSD enclosure: 100V–240V AC±10%, 192V–288V DC, -48V to -60V DC Controller enclosure/Smart SAS SSD enclosure/Smart NVMe SSD enclosure: 200V–240V AC±10%, 192V–288V DC, 260V–400V DC,-48V to -60V DCTechnical SpecificationsModel OceanStor Dorado 5000 OceanStor Dorado 6000 Physical SpecificationsDimensions (H x W x D)SAS controller enclosure: 86.1 mm ×447mm ×820 mmNVMe controller enclosure: 86.1 mm ×447mm ×920 mmSAS SSD enclosure: 86.1 mm ×447 mm ×410 mmSmart SAS SSD enclosure: 86.1 mm x 447mm x 520 mmNVMe SSD enclosure: 86.1 mm x 447 mm x620 mmSAS controller enclosure: 86.1 mm ×447mm ×820 mmNVMe controller enclosure: 86.1 mm ×447mm ×920 mmSAS SSD enclosure: 86.1 mm ×447 mm ×410 mmSmart SAS SSD enclosure: 86.1 mm ×447mm ×520 mmNVMe SSD enclosure: 86.1 mm x 447 mm x620 mmWeight SAS controller enclosure: ≤ 45 kgNVMe controller enclosure: ≤ 50 kgSAS SSD enclosure: ≤ 20 kgSmart SAS SSD enclosure: ≤ 30 kgSmart NVMe SSD enclosure: ≤ 35 kg SAS controller enclosure: ≤ 45 kg NVMe controller enclosure: ≤ 50 kg SAS SSD enclosure: ≤ 20 kgSmart SAS SSD enclosure: ≤ 30 kg Smart NVMe SSD enclosure: ≤ 35 kgOperating Temperature–60 m to +1800 m altitude: 5°C to 35°C (bay) or 40°C (enclosure)1800 m to 3000 m altitude: The max. temperature threshold decreases by 1°C for everyaltitude increase of 220 mOperating Humidity10% RH to 90% RHCopyright © Huawei Technologies Co., Ltd. 2021. All rights reserved.No part of this document may be reproduced or transmitted in any form or by any means without the prior written consent of Huawei Technologies Co., Ltd.Trademarks and Permissions, HUAWEI, and are trademarks or registered trademarks of Huawei Technologies Co., Ltd. Other trademarks, product, service and company names mentioned are the property of their respective holders.Disclaimer THE CONTENTS OF THIS MANUAL ARE PROVIDED "AS IS". EXCEPT AS REQUIRED BY APPLICABLE LAWS, NO WARRANTIES OF ANY KIND, EITHER EXPRESS OR IMPLIED, INCLUDING BUT NOT LIMITED TO, THE IMPLIEDWARRANTIES OF MERCHANTABILITY AND FITNESS FOR A PARTICULAR PURPOSE, ARE MADE IN RELATION TOTHE ACCURACY, RELIABILITY OR CONTENTS OF THIS MANUAL.TO THE MAXIMUM EXTENT PERMITTED BY APPLICABLE LAW, IN NO CASE SHALL HUAWEI TECHNOLOGIESCO., LTD BE LIABLE FOR ANY SPECIAL, INCIDENTAL, INDIRECT, OR CONSEQUENTIAL DAMAGES, OR LOSTPROFITS, BUSINESS, REVENUE, DATA, GOODWILL OR ANTICIPATED SAVINGS ARISING OUT OF, OR INCONNECTION WITH, THE USE OF THIS MANUAL.Tel: + S h e n z h en 518129,P.R.C h i n aBantian Longgang DistrictHUAWEI TECHNOLOGIES CO.,LTD.To learn more about Huawei storage, please contact your local Huawei officeor visit the Huawei Enterprise website: .Huawei Enterprise APPHuawei IT。
dynamic device capacity机制

dynamic device capacity机制
动态设备容量机制 (Dynamic Device Capacity Mechanism) 是一
种管理设备资源的机制,用于根据实际需求分配和管理设备的处理能力和存储容量。
该机制可以根据系统负载和用户需求的变化,动态调整设备资源的分配,以提高系统性能和资源利用率。
动态设备容量机制通常涉及以下几个方面:
1. 自适应调整:根据设备的工作负载情况,动态调整设备的处理能力和存储容量。
例如,当系统负载较高时,可以增加设备的处理能力,以提高系统的响应能力;当系统负载较低时,可以减少设备的处理能力,以降低功耗和资源浪费。
2. 资源分配优化:根据用户需求和系统优先级,优化设备资源的分配。
例如,对于响应时间要求较高的任务,可以优先分配更多的处理能力和存储容量;对于批处理任务或低优先级任务,可以降低设备的资源分配。
3. 预测和动态调节:通过对设备资源使用情况的预测和实时监测,及时调整设备的处理能力和存储容量。
例如,根据过去的使用模式和趋势预测将来的负载情况,并根据实时监测结果调整设备的资源分配。
4. 弹性扩展:根据需要进行设备的扩展和收缩。
例如,当负载超过设备的容量时,可以扩展设备资源以满足需求;当负载较低时,可以收缩设备资源以节省成本。
通过使用动态设备容量机制,可以更有效地管理和利用设备资源,提高系统的性能和灵活性,同时降低能耗和资源浪费。
这对于需要处理大量数据或具有高度动态性的应用场景尤为重要,例如云计算、大数据处理和物联网等领域。
- 1、下载文档前请自行甄别文档内容的完整性,平台不提供额外的编辑、内容补充、找答案等附加服务。
- 2、"仅部分预览"的文档,不可在线预览部分如存在完整性等问题,可反馈申请退款(可完整预览的文档不适用该条件!)。
- 3、如文档侵犯您的权益,请联系客服反馈,我们会尽快为您处理(人工客服工作时间:9:00-18:30)。
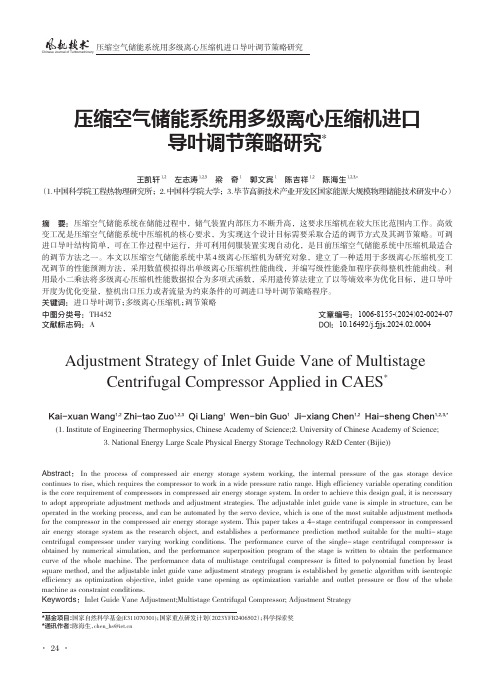
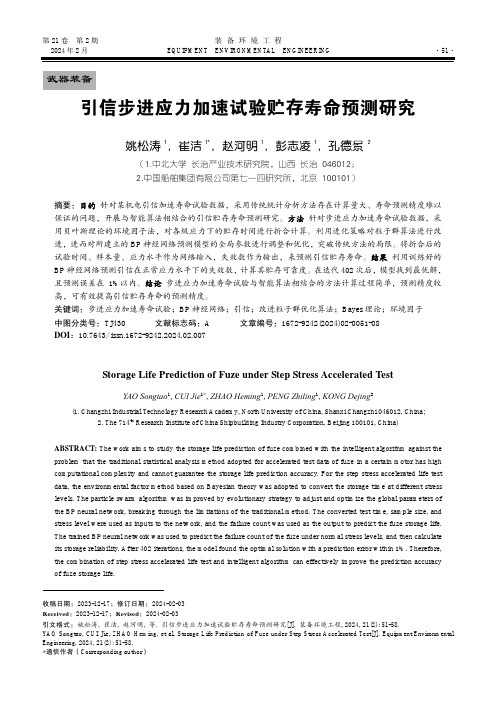
Storage Device Performance Prediction with CARTModelsMengzhi Wang,Kinman Au,Anastassia Ailamaki,Anthony Brockwell,Christos Faloutsos,and Gregory R.GangerCMU-PDL-04-103March2004Parallel Data LaboratoryCarnegie Mellon UniversityPittsburgh,PA15213-3890AbstractStorage device performance prediction is a key element of self-managed storage systems and application planning tasks,such as data assignment.This work explores the application of a machine learning tool,CART models,to storage device modeling.Our approach predicts a device’s performance as a function of input workloads,requiring no knowledge of the device internals.We propose two uses of CART models:one that predicts per-request response times(and then derives aggregate values)and one that predicts aggregate values directly from workload characteristics.After being trained on our experimental platforms,both provide accurate black-box models across a range of test traces from real environments.Experiments show that these models predict the average and90th percentile response time with an relative error as low as16%,when the training workloads are similar to the testing workloads,and interpolate well across different workloads.Acknowledgements:We thank the members and companies of the PDL Consortium(including EMC,Hewlett-Packard,Hitachi,Hitachi Global Storage Technologies,IBM,Intel,LSI Logic,Microsoft,Network Appliance,Oracle,Panasas,Seagate,Sun,and Veritas)for their interest, insights,feedback,and support.We thank IBM for partly funding this work through a CAS student fellowship and a faculty partnership award.This work is funded in part by NSF grants CCR-0205544,IIS-0133686,BES-0329549,IIS-0083148,IIS-0113089,IIS-0209107,and IIS-0205224.Wewould also like to thank Eno Thereska,Mike Mesnier,and John Strunk for their participation and discussion in the early stage of this project.Keywords:Performance prediction,storage device modeling1IntroductionThe costs and complexity of system administration in storage systems[17,35,11]and database systems[12, 1,15,21]make automation of administration tasks a critical research challenge.One important aspect of administering self-managed storage systems,particularly large storage infrastructures,is deciding which data sets to store on which devices.Tofind an optimal or near optimal solution requires the ability to predict how well each device will serve each workload,so that loads can be balanced and particularly good matches can be exploited.Researchers have long utilized performance models for such prediction to compare alternative storage device designs.Given sufficient effort and expertise,accurate simulations(e.g.,[5,28])or analytic models (e.g.,[22,30,31])can be generated to explore design questions for a particular device.Unfortunately,in practice,such time and expertise is not available for deployed infrastructures,which are often comprised of numerous and distinct device types,and their administrators have neither the time nor the expertise needed to configure device models.This paper attacks this obstacle by providing a black-box model generation algorithm.By“black box,”we mean that the model(and model generation system)has no information about the internal components or algorithms of the storage device.Given access to a device for some“training period,”the model gen-eration system learns a device’s behavior as a function of input workloads.The resulting device model approximates this function using existing machine learning tools.Our approach employs the Classification And Regression Trees(CART)tool because of its efficiency and accuracy.CART models,in a nutshell, approximate functions on a multi-dimensional Cartesian space using piece-wise constant functions.Such learning-based black box modeling is difficult for two reasons.First,all the machine learning tools we have examined use vectors of scalars as input.Existing workload characterization models,however, involve parameters of empirical pressing these distributions into a set of scalars is not straightforward.Second,the quality of the generated models depends highly on the quality of the training workloads.The training workloads should be diverse enough to provide high coverage of the input space.This work develops two ways of encoding workloads as vectors:a vector per request or a vector per workload.The two encoding schemes lead to two types of device models,operating at the per-request and per-workload granularities,respectively.The request-level device models predict each request’s response time based on its per-request vector,or“request description.”The workload-level device models,on the other hand,predict aggregate performance directly from per-workload vectors,or“workload descriptions.”Our experiments on a variety of real world workloads have shown that these descriptions are reasonably good at capturing workload performance from both single disks and disk arrays.The two CART-based models have a median relative error of17%and38%,respectively,for average response time prediction, and18%and43%respectively for the90th percentile,when the training and testing traces come from the same workload.The CART-based models also interpolate well across workloads.The remainder of this paper is organized as follows.Section2discusses previous work in the area of storage device modeling and workload characterization.Section3describes CART and its properties. Section4describes two CART-based device models.Section5evaluates the models using several real-world workload traces.Section6concludes the paper.2Related WorkPerformance modeling has a long and successful history.Almost always,however,thorough knowledge of the system being modeled is assumed.Disk simulators,such as Pantheon[33]and DiskSim[5],use software to simulate storage device behavior and produce accurate per-request response times.Developing such sim-ulators is challenging,especially when disk parameters are not publicly available.Predicting performanceusing simulators is also resource intensive.Analytical models[7,22,24,30,31]are more computationally efficient because these models describe device behavior with a set of formulae.Finding the formula set requires deep understanding of the interaction between storage devices and workloads.In addition,both disk simulators and analytical models are tightly coupled with the modeled device.Therefore,new device technologies may invalidate existing models and require a new round of model building.Our approach uses CART,which treats storage devices as black boxes.As a result,the model construc-tion algorithm is fully automated and should be general enough to handle any type of storage device.The degenerate forms of“black-box models”are performance specifications,such as the maximum throughput of the devices,published by device manufacturers.The actual performance,however,will be nowhere near these numbers under some workloads.Anderson’s“table-based”approach[3]includes workload character-istics in the model input.The table-based models remember device behavior for a wide range of workload and device pairs and interploates among tables entries in predicting.Anderson’s models are used in an automated storage provision tool,Ergastulum[2],which formulates automatic storage infrastructure provi-sioning as an optimization problem and uses device models to guide the search algorithm in locating the solution.Our approach improves on the table-based models by employing machine learning tools to capture device behavior.Because of the good scalability of the tools to high dimensional datasets,we are able to use more sophisticated workload characteristics as the model input.As a result,the models are more efficient in both computation and storage.Workload characterization is an important part of device modeling because it provides a suitable rep-resentation of workloads.Despite abundant published work in modeling web traffic[23,25,8],I/O traffic modeling receives less attention.Direct application of web traffic analysis methods to I/O workloads is not adequate because of the different locality work traffic has a categorical address space,and there is no notion of sequential scans.In contrast,the performance variability can be several orders of magnitude between random and sequential accesses for I/O workloads.Ganger[10]pointed out the complexity of I/O workloads,and even the detection of sequential scans is a hard problem[19].Gomez et al.[14]identified self-similarity in I/O traffic and adopted structural models to generate I/O workloads.Kurmas et al.[20] employed an iterative approach to detect important workload characteristics.Rome[34]provided a general framework of workload specifications.All the approaches,in one way or another,use empirical distribu-tions derived from given workloads as the parameter values.Our previous work[32]takes advantage of the self-similarity of I/O workloads and proposes a tool,the“entropy plot,”to characterize the spatio-temporal characteristics of I/O workloads with three scalars.Since our CART-based models require workloads to be presented in the form of vectors of scalars,the entropy plot is an attractive choice.3Background:CART ModelsThis section gives a brief introduction of the CART models and justifies our choice of the tool.A detailed discussion of CART is available in[4].3.1CART ModelsCART modeling is a machine learning tool that can approximate real functions in multi-dimensional Carte-sian space.(It can also be thought of as a type of non-linear regression.)Given a function Y f Xε, where Xℜd,Yℜ,andεis zero-mean noise,a CART model approximates Y using a piece-wise constant function,ˆYˆf X.We refer to the components of X as features in the following text.The term,ε,capturesthe intrinsic randomness of the data and the variability contributed by the unobservable variables.The vari-ance of the noise could be dependent on X.For example,the variance of response time often depends on the arrival rate.|x <5.94851x <3.23184x <1.92033x <1.69098x <0.889x <5.00352x <3.60137x <4.45439x <7.71239x <7.05473x <9.00082 6.055 -1.925 16.640 2.57626.850 8.942 21.670 30.830 48.680 56.330 72.06088.010-20 0 20406080 100 0 2 46 8 10y x sample f(x) = x * x CART (a)Fitted tree (b)Data points and regression lineFigure 1:CART model for a simple one-dimensional data set.The data set contains 100data points gen-erated using f xx 2ε,where εfollows a Guassian distribution with mean 0and standard deviation 10.The piece-wise constant function ˆf X can be visualized as a binary tree.Figure 1(a)shows a CART model constructed on the sample one-dimensional data set in (b).The sample data set is generated usingy i x 2i εi i 12100where x i is uniformly distributed within (0,10),and εi follows a Guassian distribution of N 010.The leaf nodes correspond to disjoint hyper-rectangles in the feature vector space.The hyper-rectangles are degenerated into intervals for one-dimensional data sets.Each leaf is associated with a value,ˆf X ,which is the prediction for all X s within the corresponding hyper-rectangle.The internal nodes contain split points,and a path from the root to a leaf defines the hyper-rectangle of the leaf node.The tree,therefore,represents a piece-wise constant function on the feature vector space.Figure 1(b)shows the regression line of the sample CART model.3.2CART Model PropertiesCART models are computationally efficient in both construction and prediction.The construction algorithm starts with a tree with a single root node corresponding to the entire input vector space and grows the tree by greedily selecting the split point that yields the maximum reduction in mean squared error.A more detailed discussion of the split point selection is presented in Appendix A.Each prediction involves a tree traversal and,therefore,is fast.CART offers good interpretability and allows us to evaluate the importance of various workload char-acteristics in predicting workload performance.A CART model is a binary tree,making it easy to plot on paper as in Figure 1(a).More importantly,one can evaluate a feature’s importance by its contribution in error reduction.Intuitively,a more important feature should contribute more to the error reduction;thus,leaving it out of the feature vector would significantly raise the prediction error.In a CART model,we use the sum of the error reduction related to all the appearances of a feature as its importance.3.3Comparison With Other Regression ToolsOther regression tools can achieve the same functionality as CART.We choose to use CART because of its accuracy,efficiency,robustness,and ease of use.Table 1compares CART with four other popular tools toFeature CART Neural k-nearestnetworks neighborshigh fair(505%)(66%)Interpretability Good Poor PoorFair PoorAbility to handle Good Poor Poor irrelevant inputfast slow(seconds)(hours)Prediction fast fast slowtime(milliseconds)(milliseconds)(minutes)low(60B)low(2MB)Ease of use Good Fair Fair Table1:Comparison of regression tools in predicting per-request response time.(The same data set is used in Figure5.)The comparison on row2,3,4and the last one is taken from[16].We rank the features in the order of their importance.Interpretability is the model’s ability to infer the importance of input variables. Robustness is the ability to function well under noisy data set.Irrelevant input refers to features that have little predictive powers.build the request-level device model as described in Section4.2.The models were constructed on thefirst day of cello99a and tests run on the second of the same trace.The informaion on the traces we used may be found in Section5.The model[29]uses a linear function of X to approximate f X.Due to non-linear storage device behavior,linear models have poor accuracy.The model[26]consists of a set of highly interconnected processing elements working in unison to approximate the target function.We use a single hidden layer of20nodes(best among20and40)and a learning rate of0.05.Half of the training set is used in building the model and the other half for validation.Such a model takes a long time to converge.The[6]maps the input data into a high dimensional space and performsa linear regression there.Our model uses the radial basis functionK x i x expγx x i2as the kernel function,andγis set to be2(best among1,3,4,6).We use an efficient implementation, SV M light[18],in our experiment.Selecting the parameter values requires expertise and multiple rounds of trials.The model[9]is memory-based because the model remembers all the train-ing data points and prediction is done through averaging the output of the k nearest neighbors of the data point being predicted.We use the Euclidean distance function and a k value of5(best among5, 10,15,and20).The model is accurate,but is inefficient in storage and computation.The last three tools require that all the features and output be normalized to the unit length.For features of large value range,we take logarithms before normalization.Overall,CART is the best at predicting per-request response times,with the only downside being slightly lower accuracy compared to the much more space-and time-consuming approach.Figure2:Model construction through training.RT i is the response time of request r i.4Predicting Performance with CARTThis section presents two ways of constructing device models based on CART models.4.1OverviewOur goal is to build a model for a given storage device which predicts device performance as a function of I/O workload.The device model receives a workload as input and predicts its aggregate performance.We define a workload as a sequence of disk requests,with each request,r i,uniquely described by four attributes: arrival time(ArrivalTime i),logical block number(LBN i),request size in number of disk blocks(Size i),and read/write type(RW i).The storage device could be a single disk,a disk array,or some other like-interfaced component.The aggregate performance can be either the average or the90-th percentile response time.Our approach uses CART to approximate the function.We assume that the model construction algorithm can feed any workload into the device to observe its behavior for a certain period of time,also known as “training.”The algorithm then builds the device model based on the observed response times,as illustrated in Figure2.Model construction does not require any information about the internals of the modeled device. Therefore,it is general enough to model any device.Regression tools are a natural choice to model device behavior.Such tools are designed to model func-tions on multi-dimensional space given a set of samples with known output.The difficulty is to transform workloads into data points in a multi-dimensional feature space.We explore two ways to achieve the trans-formation as illustrated in Figure3.A request-level model represents a request r i as a vector R i,also known as the“request description,”and uses CART models to predict per-request response times.The aggregate performance is then calculated by aggregating the response times.A workload-level model,on the other hand,represents the entire workload as a single vector W,or the“workload description,”and predicts the aggregate performance directly from W.In both approaches,the quality of the input vectors is critical to the model accuracy.The next two sections present the request and workload descriptions in detail.4.2Request-Level Device ModelsThis section describes the CART-based request-level device model.This model uses a CART model to predict the response times of individual requests based on request descriptions.The model,therefore,is able to generate the entire response time distribution and output any aggregate performance measures.We adopt the following two constraints in designing the request description.1.R i does not include any actual response times.One could relax this constraint by allowing the in-clusion of the response time information for all the requests that have already been served when the current request arrives.This relaxation,however,is feasible only for online response time predictions;it would not be appropriate for application planning tasks because the planner does not run workloads on devices.Figure3:Two types of CART-based device models.2.R i can be calculated from r j,j i.This constraint simplifies the request description.In most cases,the response time of a current request depends only on previous requests and the request itself.Our request description R i for request r i contains the following variables:R i TimeDi f f i1TimeDi f f i kLBN i LBNDi f f i1LBNDi f f i lSize i RW iSeq iwhere TimeDi f f i k ArrivalTime i ArrivalTime i2k1and LBNDi f f i l LBN i LBN i l.Thefirst three groups of features capture three components of the response time,and Seq i indicates whether the request is a sequential access.Thefirst k1features measure the temporal burstiness of the workload when r i arrives,and support prediction of the queuing time.We allow the TimeDi f f features to exponentially grow the distance from the current request to history request to accommodate large bursts.The next l1 features measure the spatial locality,supporting prediction of the seek time of the request.Size i and RW i support prediction of the data transfer time.The two parameters,k and l,determine how far we look back for request bursts and locality.Small values do not adequately capture these characteristics,leading to inferior device rge values,on the other hand,leads to a higher dimensionality,meaning the need for a larger training set and a longer training time.The optimal values for these parameters are highly device specific,and Section5.1shows how we select the parameter values in our experiments.4.3Workload-Level Device ModelsThe workload-level model represents the entire workload as a single workload description and predicts aggregate device performance directly.The workload description W contains the following features.W Average arrival rateRead ratioAverage request sizePercentage of sequential requestsTemporal and spatial burstinessCorrelations between pairs of attributesThe workload description uses the entropy plot[32]to quantify temporal and spatial burstiness and correla-tions between attributes.Entropy value are plotted on one or two attributes against the entropy calculation granularity.The increment of the entropy values characterizes how the burstiness and correlations change from one granularity to the next.Because of the self-similarity of I/O workloads[13],the increment is usually constant,allowing us to use the entropy plot slope to characterize the burstiness and correlations. Appendix B describes the entropy plot in detail.The workload-level device model offers fast predictions.The model compresses a workload into a workload description and feeds the description into a CART model to produce the desired performance measure.Feature extraction is also fast.To predict both the average and90th percentile response time,the model must have two separate trees,one for each performance metric.Workload modeling introduces a parameter called“window size.”The window size is the unit of per-formance prediction and,thus,the workload length for workload description generation.For example,we can divide a long trace into one-minute fragments and use the workload-level model to predict the average response time over one-minute intervals.Fragmenting workloads has several advantages.First,performance problems are usually transient.A“problem”appears when a large burst of requests arrive and disappears quickly after all the requests in the burst are ing the workload in its entirety,on the other hand, fails to indentify such transient problems.Second,fragmenting the training trace produces more samples for training and reduces the required training time.Windows that are too small,however,contain too few requests for the entropy plot to be effective.We use one-minute windows in all of our experiments.4.4Comparison of Two Types of ModelsThere is a clear tradeoff between the request-level and workload-level device models.The former is fast in training and slow in prediction,and the latter is the opposite.The model training time is dominated by trace replay,which,when taking place on actual devices, requires exactly the same amount of time as the trace length.Building a CART model needs only seconds of computation,but trace replay can require hundreds of hours to acquire enough data points for model construction.When operating at the request level,the device model gets one data point per request as opposed to one data point per one-minute workload fragment as in the workload-level device model.In order to get the same number of data points,the workload-level device model needs a training time100 times longer than the request-level model when the arrival rate is100requests per minute.The number of tree traversals determines the prediction time,since each predicted value requires a tree traversal.Therefore,the total number of tree traversals is the number of requests in the workload for the request-level device model and the number of workload fragments for the workload-level model.With an average arrival rate of100requests per minute,the request-level model is100times slower in prediction.An item for future research is the exploration of the possibility of combining the two models to deliver ones that are efficient in both training and prediction.5Experimental ResultsThis section evaluates the CART-based device models presented in the previous section using a range of workload traces.Devices.We model two devices:a single disk and a disk array.The single disk is a9GB Atlas10K disk with an average rotational latency of3milliseconds.The disk array is a RAID5disk array consisting of8 Atlas10K disks with a32KB stripe size.We replay all the traces on the two devices except the SAP trace, which is beyond the capacity of the Atlas10K disk.Trace Trace descriptionname Length Average Size single disk7.8Million35.4%59.28mscello99a4weeks7.1KB115.71mscello99b4weeks118.0KB113.61mscello99c4weeks8.5KB 5.04ms1.1Million99.9%7.40msTable2:Trace summary.We model an Atlas10K9GB and a RAID5disk array consisting of8Atlas10K disks.The response time is collected by replaying the traces on DiskSim3.0[5].Traces.We use three sets of real-world traces in this study.Table2lists the summary statistics of the edited traces.Thefirst two,cello92and cello99capture typical computer system research I/O workloads, collected at HP Labs in1992and1999respectively[27,14].We preprocess cello92to concatenate the LBNs of the three most active devices from the trace tofill the modeled device.For cello99,we pick the three most active devices,among the23devices,and label them cello99a,cello99b,and cello99c.The cello99 tracesfit in a9GB disk perfectly,so no trace editing is necessary.As these traces are long(two months for cello92and one year for cello99),we report data for a four-week snapshot(5/1/92to5/28/92and2/1/99to 2/28/99).The SAP trace was collected from an Oracle database server running SAP ISUCCS2.5B in a power utility company.The server has more than3,000users and disk accesses reflect the retrieval of customer invoices for updating and reviewing.Sequential reads dominate the SAP trace.Evaluation methodology.The evaluation uses the device models to predict the average and90th per-centile response time for one-minute workload fragments.We report the prediction errors using two metrics: absolute error defined as the difference between the predicted and the actual value,ˆY Y,and relative error defined asˆY Y0%20%40%60%T i m e D i f f T i m e D i f f T i m e D i f f T i m e D i f f T i m e D i f f T i m e D i f f T i m e D i f f T i m e D i f f T i m e D i f f T i m e D i f f 1L B N L B N D i f f L B N D i f f L B N D i f f L B N D i f f L B N D i f f S i z e S e R R e l a t i v e i m p o r t a n ce(a)relative importance measured on the 9GB Atlas 10KB disk using cello99a andcello99c(b)relative importance measured on the RAID5disk array using cello99a and cello99cFigure 4:Relative importance of the request description features.5.1Calibrating Request-Level ModelsThis section describes how we select parameter values for k and l for the request-level device models.Figure 4shows the relative importance of the request description features in determining per-request response time by setting k to 10and l to 5.The feature’s relative importance is measured by its contribution in error reduction.The graphs show the importance of request description features measured on both devices,trained on two traces (cello99a and cello99c ).We use only the first day of the traces and reduce the data set size by 90%with uniform sampling.First,we observe that the relative importance is workload dependent.As we expected,for busy traf-fic such as that which occurred in the cello99a trace,the queuing time dominates the response time,and thereby,the TimeDi f f features are more important.On the other hand,cello99c has small response times,and features that characterize the data transfer time,such as Size and RW ,have good predictive power in modeling the single disk.Second,we observe that the most imporant feature shifts from TimeDi f f 8to TimeDi f f 7where com-paring the single disk to the disk array for cello99a because the queuing time becomes less significant for the disk array.The distinction between the two traces,however,persists.We set k to 10for TimeDi f f and l to 3for LBNDi f f in the subsequent experiments so that we can model device behavior under both types of workloads.We show the model accuracy in predicting per-request response times in Figure 5.The model is built for the Atlas 10K disk.The training trace is the first day of cello99a ,and the testing trace is the second day of the same trace.Figure 5(a)is a scatter plot,showing the predicted response times against the actual ones for the first 5,000requests.Most of the points stay close to the diagonal line,suggesting accurate prediction of the request-level device model.Figure 5(b)further compares the response time distributions.The long tail of the distribution is well captured by the request-level model,indicating that the request description is。