Structural complexity in monodisperse systems of isotropic particles
Multi-scale structural similarity for image quality assesment
MULTI-SCALE STRUCTURAL SIMILARITY FOR IMAGE QUALITY ASSESSMENT Zhou Wang1,Eero P.Simoncelli1and Alan C.Bovik2(Invited Paper)1Center for Neural Sci.and Courant Inst.of Math.Sci.,New York Univ.,New York,NY10003 2Dept.of Electrical and Computer Engineering,Univ.of Texas at Austin,Austin,TX78712 Email:zhouwang@,eero.simoncelli@,bovik@ABSTRACTThe structural similarity image quality paradigm is based on the assumption that the human visual system is highly adapted for extracting structural information from the scene,and therefore a measure of structural similarity can provide a good approxima-tion to perceived image quality.This paper proposes a multi-scale structural similarity method,which supplies moreflexibility than previous single-scale methods in incorporating the variations of viewing conditions.We develop an image synthesis method to calibrate the parameters that define the relative importance of dif-ferent scales.Experimental comparisons demonstrate the effec-tiveness of the proposed method.1.INTRODUCTIONObjective image quality assessment research aims to design qual-ity measures that can automatically predict perceived image qual-ity.These quality measures play important roles in a broad range of applications such as image acquisition,compression,commu-nication,restoration,enhancement,analysis,display,printing and watermarking.The most widely used full-reference image quality and distortion assessment algorithms are peak signal-to-noise ra-tio(PSNR)and mean squared error(MSE),which do not correlate well with perceived quality(e.g.,[1]–[6]).Traditional perceptual image quality assessment methods are based on a bottom-up approach which attempts to simulate the functionality of the relevant early human visual system(HVS) components.These methods usually involve1)a preprocessing process that may include image alignment,point-wise nonlinear transform,low-passfiltering that simulates eye optics,and color space transformation,2)a channel decomposition process that trans-forms the image signals into different spatial frequency as well as orientation selective subbands,3)an error normalization process that weights the error signal in each subband by incorporating the variation of visual sensitivity in different subbands,and the vari-ation of visual error sensitivity caused by intra-or inter-channel neighboring transform coefficients,and4)an error pooling pro-cess that combines the error signals in different subbands into a single quality/distortion value.While these bottom-up approaches can conveniently make use of many known psychophysical fea-tures of the HVS,it is important to recognize their limitations.In particular,the HVS is a complex and highly non-linear system and the complexity of natural images is also very significant,but most models of early vision are based on linear or quasi-linear oper-ators that have been characterized using restricted and simplistic stimuli.Thus,these approaches must rely on a number of strong assumptions and generalizations[4],[5].Furthermore,as the num-ber of HVS features has increased,the resulting quality assessment systems have become too complicated to work with in real-world applications,especially for algorithm optimization purposes.Structural similarity provides an alternative and complemen-tary approach to the problem of image quality assessment[3]–[6].It is based on a top-down assumption that the HVS is highly adapted for extracting structural information from the scene,and therefore a measure of structural similarity should be a good ap-proximation of perceived image quality.It has been shown that a simple implementation of this methodology,namely the struc-tural similarity(SSIM)index[5],can outperform state-of-the-art perceptual image quality metrics.However,the SSIM index al-gorithm introduced in[5]is a single-scale approach.We consider this a drawback of the method because the right scale depends on viewing conditions(e.g.,display resolution and viewing distance). In this paper,we propose a multi-scale structural similarity method and introduce a novel image synthesis-based approach to calibrate the parameters that weight the relative importance between differ-ent scales.2.SINGLE-SCALE STRUCTURAL SIMILARITYLet x={x i|i=1,2,···,N}and y={y i|i=1,2,···,N}be two discrete non-negative signals that have been aligned with each other(e.g.,two image patches extracted from the same spatial lo-cation from two images being compared,respectively),and letµx,σ2x andσxy be the mean of x,the variance of x,and the covariance of x and y,respectively.Approximately,µx andσx can be viewed as estimates of the luminance and contrast of x,andσxy measures the the tendency of x and y to vary together,thus an indication of structural similarity.In[5],the luminance,contrast and structure comparison measures were given as follows:l(x,y)=2µxµy+C1µ2x+µ2y+C1,(1)c(x,y)=2σxσy+C2σ2x+σ2y+C2,(2)s(x,y)=σxy+C3σxσy+C3,(3) where C1,C2and C3are small constants given byC1=(K1L)2,C2=(K2L)2and C3=C2/2,(4)Fig.1.Multi-scale structural similarity measurement system.L:low-passfiltering;2↓:downsampling by2. respectively.L is the dynamic range of the pixel values(L=255for8bits/pixel gray scale images),and K1 1and K2 1aretwo scalar constants.The general form of the Structural SIMilarity(SSIM)index between signal x and y is defined as:SSIM(x,y)=[l(x,y)]α·[c(x,y)]β·[s(x,y)]γ,(5)whereα,βandγare parameters to define the relative importanceof the three components.Specifically,we setα=β=γ=1,andthe resulting SSIM index is given bySSIM(x,y)=(2µxµy+C1)(2σxy+C2)(µ2x+µ2y+C1)(σ2x+σ2y+C2),(6)which satisfies the following conditions:1.symmetry:SSIM(x,y)=SSIM(y,x);2.boundedness:SSIM(x,y)≤1;3.unique maximum:SSIM(x,y)=1if and only if x=y.The universal image quality index proposed in[3]corresponds to the case of C1=C2=0,therefore is a special case of(6).The drawback of such a parameter setting is that when the denominator of Eq.(6)is close to0,the resulting measurement becomes unsta-ble.This problem has been solved successfully in[5]by adding the two small constants C1and C2(calculated by setting K1=0.01 and K2=0.03,respectively,in Eq.(4)).We apply the SSIM indexing algorithm for image quality as-sessment using a sliding window approach.The window moves pixel-by-pixel across the whole image space.At each step,the SSIM index is calculated within the local window.If one of the image being compared is considered to have perfect quality,then the resulting SSIM index map can be viewed as the quality map of the other(distorted)image.Instead of using an8×8square window as in[3],a smooth windowing approach is used for local statistics to avoid“blocking artifacts”in the quality map[5].Fi-nally,a mean SSIM index of the quality map is used to evaluate the overall image quality.3.MULTI-SCALE STRUCTURAL SIMILARITY3.1.Multi-scale SSIM indexThe perceivability of image details depends the sampling density of the image signal,the distance from the image plane to the ob-server,and the perceptual capability of the observer’s visual sys-tem.In practice,the subjective evaluation of a given image varies when these factors vary.A single-scale method as described in the previous section may be appropriate only for specific settings.Multi-scale method is a convenient way to incorporate image de-tails at different resolutions.We propose a multi-scale SSIM method for image quality as-sessment whose system diagram is illustrated in Fig. 1.Taking the reference and distorted image signals as the input,the system iteratively applies a low-passfilter and downsamples thefiltered image by a factor of2.We index the original image as Scale1, and the highest scale as Scale M,which is obtained after M−1 iterations.At the j-th scale,the contrast comparison(2)and the structure comparison(3)are calculated and denoted as c j(x,y) and s j(x,y),respectively.The luminance comparison(1)is com-puted only at Scale M and is denoted as l M(x,y).The overall SSIM evaluation is obtained by combining the measurement at dif-ferent scales usingSSIM(x,y)=[l M(x,y)]αM·Mj=1[c j(x,y)]βj[s j(x,y)]γj.(7)Similar to(5),the exponentsαM,βj andγj are used to ad-just the relative importance of different components.This multi-scale SSIM index definition satisfies the three conditions given in the last section.It also includes the single-scale method as a spe-cial case.In particular,a single-scale implementation for Scale M applies the iterativefiltering and downsampling procedure up to Scale M and only the exponentsαM,βM andγM are given non-zero values.To simplify parameter selection,we letαj=βj=γj forall j’s.In addition,we normalize the cross-scale settings such thatMj=1γj=1.This makes different parameter settings(including all single-scale and multi-scale settings)comparable.The remain-ing job is to determine the relative values across different scales. Conceptually,this should be related to the contrast sensitivity func-tion(CSF)of the HVS[7],which states that the human visual sen-sitivity peaks at middle frequencies(around4cycles per degree of visual angle)and decreases along both high-and low-frequency directions.However,CSF cannot be directly used to derive the parameters in our system because it is typically measured at the visibility threshold level using simplified stimuli(sinusoids),but our purpose is to compare the quality of complex structured im-ages at visible distortion levels.3.2.Cross-scale calibrationWe use an image synthesis approach to calibrate the relative impor-tance of different scales.In previous work,the idea of synthesizing images for subjective testing has been employed by the“synthesis-by-analysis”methods of assessing statistical texture models,inwhich the model is used to generate a texture with statistics match-ing an original texture,and a human subject then judges the sim-ilarity of the two textures [8]–[11].A similar approach has also been qualitatively used in demonstrating quality metrics in [5],[12],though quantitative subjective tests were not conducted.These synthesis methods provide a powerful and efficient means of test-ing a model,and have the added benefit that the resulting images suggest improvements that might be made to the model[11].M )distortion level (MSE)12345Fig.2.Demonstration of image synthesis approach for cross-scale calibration.Images in the same row have the same MSE.Images in the same column have distortions only in one specific scale.Each subject was asked to select a set of images (one from each scale),having equal quality.As an example,one subject chose the marked images.For a given original 8bits/pixel gray scale test image,we syn-thesize a table of distorted images (as exemplified by Fig.2),where each entry in the table is an image that is associated witha specific distortion level (defined by MSE)and a specific scale.Each of the distorted image is created using an iterative procedure,where the initial image is generated by randomly adding white Gaussian noise to the original image and the iterative process em-ploys a constrained gradient descent algorithm to search for the worst images in terms of SSIM measure while constraining MSE to be fixed and restricting the distortions to occur only in the spec-ified scale.We use 5scales and 12distortion levels (range from 23to 214)in our experiment,resulting in a total of 60images,as demonstrated in Fig.2.Although the images at each row has the same MSE with respect to the original image,their visual quality is significantly different.Thus the distortions at different scales are of very different importance in terms of perceived image quality.We employ 10original 64×64images with different types of con-tent (human faces,natural scenes,plants,man-made objects,etc.)in our experiment to create 10sets of distorted images (a total of 600distorted images).We gathered data for 8subjects,including one of the authors.The other subjects have general knowledge of human vision but did not know the detailed purpose of the study.Each subject was shown the 10sets of test images,one set at a time.The viewing dis-tance was fixed to 32pixels per degree of visual angle.The subject was asked to compare the quality of the images across scales and detect one image from each of the five scales (shown as columns in Fig.2)that the subject believes having the same quality.For example,one subject chose the images marked in Fig.2to have equal quality.The positions of the selected images in each scale were recorded and averaged over all test images and all subjects.In general,the subjects agreed with each other on each image more than they agreed with themselves across different images.These test results were normalized (sum to one)and used to calculate the exponents in Eq.(7).The resulting parameters we obtained are β1=γ1=0.0448,β2=γ2=0.2856,β3=γ3=0.3001,β4=γ4=0.2363,and α5=β5=γ5=0.1333,respectively.4.TEST RESULTSWe test a number of image quality assessment algorithms using the LIVE database (available at [13]),which includes 344JPEG and JPEG2000compressed images (typically 768×512or similar size).The bit rate ranges from 0.028to 3.150bits/pixel,which allows the test images to cover a wide quality range,from in-distinguishable from the original image to highly distorted.The mean opinion score (MOS)of each image is obtained by averag-ing 13∼25subjective scores given by a group of human observers.Eight image quality assessment models are being compared,in-cluding PSNR,the Sarnoff model (JNDmetrix 8.0[14]),single-scale SSIM index with M equals 1to 5,and the proposed multi-scale SSIM index approach.The scatter plots of MOS versus model predictions are shown in Fig.3,where each point represents one test image,with its vertical and horizontal axes representing its MOS and the given objective quality score,respectively.To provide quantitative per-formance evaluation,we use the logistic function adopted in the video quality experts group (VQEG)Phase I FR-TV test [15]to provide a non-linear mapping between the objective and subjective scores.After the non-linear mapping,the linear correlation coef-ficient (CC),the mean absolute error (MAE),and the root mean squared error (RMS)between the subjective and objective scores are calculated as measures of prediction accuracy .The prediction consistency is quantified using the outlier ratio (OR),which is de-Table1.Performance comparison of image quality assessment models on LIVE JPEG/JPEG2000database[13].SS-SSIM: single-scale SSIM;MS-SSIM:multi-scale SSIM;CC:non-linear regression correlation coefficient;ROCC:Spearman rank-order correlation coefficient;MAE:mean absolute error;RMS:root mean squared error;OR:outlier ratio.Model CC ROCC MAE RMS OR(%)PSNR0.9050.901 6.538.4515.7Sarnoff0.9560.947 4.66 5.81 3.20 SS-SSIM(M=1)0.9490.945 4.96 6.25 6.98 SS-SSIM(M=2)0.9630.959 4.21 5.38 2.62 SS-SSIM(M=3)0.9580.956 4.53 5.67 2.91 SS-SSIM(M=4)0.9480.946 4.99 6.31 5.81 SS-SSIM(M=5)0.9380.936 5.55 6.887.85 MS-SSIM0.9690.966 3.86 4.91 1.16fined as the percentage of the number of predictions outside the range of±2times of the standard deviations.Finally,the predic-tion monotonicity is measured using the Spearman rank-order cor-relation coefficient(ROCC).Readers can refer to[15]for a more detailed descriptions of these measures.The evaluation results for all the models being compared are given in Table1.From both the scatter plots and the quantitative evaluation re-sults,we see that the performance of single-scale SSIM model varies with scales and the best performance is given by the case of M=2.It can also be observed that the single-scale model tends to supply higher scores with the increase of scales.This is not surprising because image coding techniques such as JPEG and JPEG2000usually compressfine-scale details to a much higher degree than coarse-scale structures,and thus the distorted image “looks”more similar to the original image if evaluated at larger scales.Finally,for every one of the objective evaluation criteria, multi-scale SSIM model outperforms all the other models,includ-ing the best single-scale SSIM model,suggesting a meaningful balance between scales.5.DISCUSSIONSWe propose a multi-scale structural similarity approach for image quality assessment,which provides moreflexibility than single-scale approach in incorporating the variations of image resolution and viewing conditions.Experiments show that with an appropri-ate parameter settings,the multi-scale method outperforms the best single-scale SSIM model as well as state-of-the-art image quality metrics.In the development of top-down image quality models(such as structural similarity based algorithms),one of the most challeng-ing problems is to calibrate the model parameters,which are rather “abstract”and cannot be directly derived from simple-stimulus subjective experiments as in the bottom-up models.In this pa-per,we used an image synthesis approach to calibrate the param-eters that define the relative importance between scales.The im-provement from single-scale to multi-scale methods observed in our tests suggests the usefulness of this novel approach.However, this approach is still rather crude.We are working on developing it into a more systematic approach that can potentially be employed in a much broader range of applications.6.REFERENCES[1] A.M.Eskicioglu and P.S.Fisher,“Image quality mea-sures and their performance,”IEEE munications, vol.43,pp.2959–2965,Dec.1995.[2]T.N.Pappas and R.J.Safranek,“Perceptual criteria for im-age quality evaluation,”in Handbook of Image and Video Proc.(A.Bovik,ed.),Academic Press,2000.[3]Z.Wang and A.C.Bovik,“A universal image quality in-dex,”IEEE Signal Processing Letters,vol.9,pp.81–84,Mar.2002.[4]Z.Wang,H.R.Sheikh,and A.C.Bovik,“Objective videoquality assessment,”in The Handbook of Video Databases: Design and Applications(B.Furht and O.Marques,eds.), pp.1041–1078,CRC Press,Sept.2003.[5]Z.Wang,A.C.Bovik,H.R.Sheikh,and E.P.Simon-celli,“Image quality assessment:From error measurement to structural similarity,”IEEE Trans.Image Processing,vol.13, Jan.2004.[6]Z.Wang,L.Lu,and A.C.Bovik,“Video quality assessmentbased on structural distortion measurement,”Signal Process-ing:Image Communication,special issue on objective video quality metrics,vol.19,Jan.2004.[7] B.A.Wandell,Foundations of Vision.Sinauer Associates,Inc.,1995.[8]O.D.Faugeras and W.K.Pratt,“Decorrelation methods oftexture feature extraction,”IEEE Pat.Anal.Mach.Intell., vol.2,no.4,pp.323–332,1980.[9] A.Gagalowicz,“A new method for texturefields synthesis:Some applications to the study of human vision,”IEEE Pat.Anal.Mach.Intell.,vol.3,no.5,pp.520–533,1981. [10] D.Heeger and J.Bergen,“Pyramid-based texture analy-sis/synthesis,”in Proc.ACM SIGGRAPH,pp.229–238,As-sociation for Computing Machinery,August1995.[11]J.Portilla and E.P.Simoncelli,“A parametric texture modelbased on joint statistics of complex wavelet coefficients,”Int’l J Computer Vision,vol.40,pp.49–71,Dec2000. [12]P.C.Teo and D.J.Heeger,“Perceptual image distortion,”inProc.SPIE,vol.2179,pp.127–141,1994.[13]H.R.Sheikh,Z.Wang, A. C.Bovik,and L.K.Cormack,“Image and video quality assessment re-search at LIVE,”/ research/quality/.[14]Sarnoff Corporation,“JNDmetrix Technology,”http:///products_services/video_vision/jndmetrix/.[15]VQEG,“Final report from the video quality experts groupon the validation of objective models of video quality assess-ment,”Mar.2000./.PSNRM O SSarnoffM O S(a)(b)Single−scale SSIM (M=1)M O SSingle−scale SSIM (M=2)M O S(c)(d)Single−scale SSIM (M=3)M O SSingle−scale SSIM (M=4)M O S(e)(f)Single−scale SSIM (M=5)M O SMulti−scale SSIMM O S(g)(h)Fig.3.Scatter plots of MOS versus model predictions.Each sample point represents one test image in the LIVE JPEG/JPEG2000image database [13].(a)PSNR;(b)Sarnoff model;(c)-(g)single-scale SSIM method for M =1,2,3,4and 5,respectively;(h)multi-scale SSIM method.。
Expressiveness vs. complexity in nonmonotonic knowledge bases propositional case
Expressiveness plexity in nonmonotonic knowledge bases:propositional caseRiccardo RosatiAbstract.We study the trade-off between the expressive abili-ties and the complexity of reasoning in propositional nonmonotonicknowledge bases.Wefirst analyze,in an expressive epistemic modalframework,the most popular forms of nonmonotonic mechanismsused in knowledge representation:in particular,we prove that epis-temic queries and epistemic integrity constraints are naturally ex-pressed through the notion of negation as failure.Based on the aboveanalysis,we then characterize the complexity of reasoning with dif-ferent subsets of such nonmonotonic constructs.This characteriza-tion induces a complexity based classification of the various formsof nonmonotonic reasoning considered:in particular,we prove thatnegation as failure is computationally harder than epistemic disjunc-tion,which apparently contradicts previous complexity results ob-tained in the logic programming setting.1MOTIV ATIONResearch in nonmonotonic logics has extensively studied the prob-lem of establishing the complexity of various forms of common-sense reasoning(see e.g.[2,7]).In particular,the complexity of rea-soning in several propositional nonmonotonic formalisms has beenestablished.The results obtained show that the problem of reason-ing in propositional nonmonotonic logics lies typically at the secondlevel of the polynomial hierarchy(e.g.in default logic,autoepistemiclogic,propositional circumscription,disjunctive logic programming,McDermott and Doyle’s modal logics,and the modal logic of onlyknowing).Hence,it is harder(unless the polynomial hierarchy col-lapses)than reasoning in standard propositional logic.However,despite the amount of results obtained,a systematicstudy of the relationship between the expressive abilities of a non-monotonic formalism and the complexity of reasoning in the pres-ence of such abilities has not been fully analyzed,which has beenpartly due to the lack of a common formal framework in which thedifferent forms of nonmonotonic reasoning could be compared andstudied.In particular,a careful analysis of the most used nonmono-tonic mechanisms for representing commonsense knowledge,withthe aim of identifying the contribution of each single feature to thecomplexity of reasoning,has not been pursued so far.Such an analy-sis would allow for precisely identifying the complexity of reasoningwith a given set of nonmonotonic abilities,thus enabling for design-ing optimized inference methods for nonmonotonic knowledge rep-resentation systems.The present work is afirst step towards a principled analysis of therelationship between the expressive abilities and the complexity oflogically implies a formula in MKNF.Theorem1Let be an MKNF knowledge base,and be an epis-temic query.Then,iff the theoryis unsatisfiable in MKNF.The most important consequence of the above theorem is that epis-temic queries are a form of nonmonotonic reasoning which can be reconducted to the notion of negation as failure(since they can be ex-pressed by modal sentences using only the operator).This allows for a better classification of nonmonotonic abilities,since all reason-ing tasks involving epistemic queries actually correspond to using the negation as failure ability.Another consequence of the above theo-rem is that in MKNF it is possible to reduce all the main reasoning problems to satisfiability/unsatisfiability.Moreover,we prove that integrity constraints,under the epistemic interpretation of[9],can actually be expressed as MKNF sentences inside the knowledge base.Roughly speaking,under this interpreta-tion,an integrity constraint is not analogous to a usual piece of information in the knowledge base,which causes inconsistency of iff contradicts other information in:it is a property which must hold in in order to preserve consistency of.Theorem2Any integrity constraint in MKNF is equivalent to a sub-jective-formula.2As in the case of epistemic queries,this result shows that integrity constraints are naturally expressed through the notion of negation as failure.3COMPLEXITY RESULTSThe results above presented,together with previous studies on the expressive abilities of MKNF,allow for expressing all the best known nonmonotonic mechanisms used in knowledge representa-tion(like rules,defaults,negation as failure(NAF),epistemic dis-junction(ED),epistemic queries(EQs),integrity constraints(ICs)) inside MKNF.We are now thus able to characterize the complexity of reasoning with different subsets of such nonmonotonic features. In particular,by exploiting previous results on the computational as-pects of MKNF[10],we establish the complexity of the unsatisfia-bility problem for MKNF knowledge bases under various syntactic restrictions,corresponding to allowing different kinds of nonmono-tonic features inside the knowledge base.LPfacts(objective knowledge)PcoNPfacts and NAF(ICs,EQs)Prules with ED coNPWe call subjective-formula a formula such that each non-modal sub-formula from lies within the scope of an operator.A summary of the complexity results obtained is reported in the second column of the displayed table,3which must be read as fol-lows:for each row of the table,the complexity of checking unsatis-fiability in MKNF under the syntactic restriction reported in thefirst column(i.e.,considering only formulas whose structure corresponds to the nonmonotonic mechanisms reported)is complete with respect to the complexity class appearing in the second column.The new complexity results appear in the third and thefifth row of the table, while the others were already known.However,the classification of epistemic queries(and integrity constraints)as a form of negation as failure allows for a new reading of the computational properties of several nonmonotonic formalisms.As an example,it is worthwhile to compare the results obtained in MKNF with the results obtained in the case of propositional logic programs,which are reported in the third column of the displayed table.It is known that logic programs (interpreted under the stable model semantics)correspond to MKNF theories of a special form,in which:(i)only atoms(or literals)are allowed within the scope of modalities;(ii)nested occurrences of the modalities are not allowed.Interestingly,under our classification (i.e.separating standard queries from epistemic queries,which are expressed in terms of negation as failure)it turns out that reasoning in logic programs with disjunction in the head of the clauses is eas-ier than reasoning in logic programs with negation as failure in the body of the clauses.This result only apparently contradicts previous complexity analyses of logic programming[3],which establish that reasoning with positive disjunctive logic programs lies at the second level of the polynomial hierarchy,since in such analyses the contri-bution of negation as failure given by queries was not considered. REFERENCES[1] A.Bochman.Biconsequence relations for nonmonotonic rea-soning.In Proc.of KR-96,482–492,1996.[2]M.Cadoli and M.Schaerf.A survey of complexity results fornonmonotonic logics.JLP,17,127–160,1993.[3]T.Eiter and G.Gottlob.On the computational cost of disjunc-tive logic programming.AMAI,15(3,4),1995.[4]J.Y.Halpern and Y.Moses.Towards a theory of knowledge andignorance:Preliminary report.Technical Report CD-TR92/34, IBM,1985.[5]V.Lifschitz.Nonmonotonic databases and epistemic queries.In Proc.of IJCAI-91,381–386,1991.[6] F.Lin and Y.Shoham.A logic of knowledge and justified as-sumptions.AIJ,57:271–289,1992[7]W.Marek and M.Truszczy´n ski.Nonmonotonic Logics–Context-Dependent Reasoning.Springer-Verlag,1993.[8]R.C.Moore.Semantical considerations on nonmonotoniclogic.AIJ,25:75–94,1985.[9]R.Reiter.What should a database know?JLP14,1990.[10]R.Rosati.Reasoning with minimal belief and negation as fail-ure:algorithms and complexity.In AAAI-97,430–435,1997.[11]G.Schwarz and M.Truszczy´n ski.Minimal knowledge prob-lem:a new approach.AIJ,67:113–141,1994.。
化学化工专业英语

The shift of electron density in a covalent bond toward the more electronegative atom or group can be observed in several ways. For bonds to hydrogen, acidity is one criterion. If the bonding electron pair moves away from the hydrogen nucleus the proton will be more easily transfered to a base (it will be more acidic). Methane is almost non-acidic, since the C–H bond is nearly non-polar. The O–H bond of water is polar, and it is at least 25 powers of ten more acidic than methane. H–F is over 12 powers of ten more acidic than water as a consequence of the greater electronegativity difference in its atoms. Electronegativity differences may be transmitted through connecting covalent bonds by an inductive effect. This inductive transfer of polarity tapers off as the number of transmitting bonds increases, and the presence of more than one highly electronegative atom has a cumulative effect. For example, trifluoro ethanol, CF3CH2– O–H is about ten thousand times more acidic than ethanol, CH3CH2–O–H.
氧化锆制备技术的研究现状与进展
氧化锆制备技术的研究现状与进展张铭媛1, 2,康娟雪1, 2,普婧1, 2,黄秀兰1, 2,段利平1, 2,彭金辉1, 2, 3,陈菓1, 2, 3, *(1.云南省高校民族地区资源清洁转化重点实验室,云南民族大学,云南昆明650500;2.云南省跨境民族地区生物质资源清洁利用国际联合研究中心,云南民族大学,云南昆明650500;3. 非常规冶金教育部重点实验室,昆明理工大学,云南昆明650093)摘要:氧化锆被广泛用作高温、负载及侵蚀性介质条件下的抗磨损结构构件,对工业生产具有重要意义。
现今生产氧化锆的稳定化制备工艺较多,现对几种常见的制备氧化锆的生产技术进行了介绍,并分析了这些制备技术的优势,化学法制备出的氧化锆粒径分布均匀且方法简单易行。
溶胶-凝胶法生产的氧化锆粒径小、单分散性能优异。
水热法生产出的氧化锆粒径小、纯度高。
电熔法生产的氧化锆杂质含量低,致密度高且生产工艺简单。
微波热处理制备的氧化锆反应时间短、升温速率快、能耗小。
氧化锆的多种制备工艺技术使得其性能应用更加的多样化。
关键词:氧化锆;化学法;溶胶-凝胶法;水热法;电熔法;微波热处理中图分类号:TF841.4文献标识码:A 文章编号:Research status and progress of zirconia preparationtechnologyZHANG Mingyuan 1, 2, KANG Juanxue 1, 2, PU Jing 1, 2, HUANG Xiulan 1, 2,DUAN Liping 1, 2, CHEN Guo 1, 2, 3, *(1. Key Laboratory of Resource Clean Conversion in Ethnic Regions, Education Departmentof Yunnan, Yunnan Minzu University, Kunming Yunnan, 650500, China;2. Joint Research Centre for International Cross-border Ethnic Regions Biomass Clean Utilizationin Yunnan, Yunnan Minzu University, Kunming Yunnan, 650500, China; 3. Key Laboratory of Unconventional Metallurgy, Ministry of Education, Kunming University of Science and Technology,Kunming Yunnan, 650093, China)Abstract:Zirconia was widely used as an anti-wear structural element under high temperature, load and aggressive media conditions and was of great importance to industrial manufacture. The current manufacture of zirconia was more stabilization of the preparation process, several common preparation of zirconia manufacture technology were introduced and analyzed the advantages of these preparation techniques, the zirconium oxide prepared by chemical method uniform particle size distribution and the method was simple and easy to do. Sol-gel method to produce fine powder particles, monodisperse excellent stability of zirconia powder. Hydrothermal production of zirconium oxide was small particle size, high purity. Fused zirconium oxide produced by low content of impurities, high density and production process was simple. Zirconia prepared by microwave heat treatment has short reaction time, fast heating rate and low energy consumption. The various preparation technology of zirconia makes its application more diversified.Keywords:zirconia; chemical method; sol-gel method; hydrothermal method; electrofusion; microwave heat treatment1前言氧化锆(ZrO2)是一种耐高温、耐腐蚀、高硬度的一种材料。
基于属性增强的神经传感融合网络的人脸识别算法论文
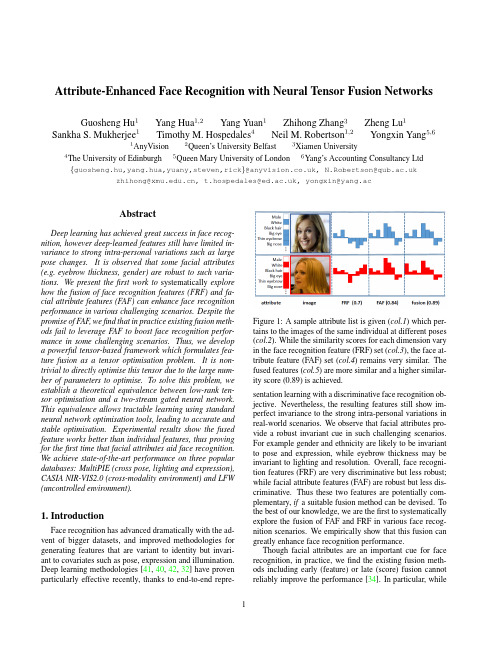
Attribute-Enhanced Face Recognition with Neural Tensor Fusion Networks Guosheng Hu1Yang Hua1,2Yang Yuan1Zhihong Zhang3Zheng Lu1 Sankha S.Mukherjee1Timothy M.Hospedales4Neil M.Robertson1,2Yongxin Yang5,61AnyVision2Queen’s University Belfast3Xiamen University 4The University of Edinburgh5Queen Mary University of London6Yang’s Accounting Consultancy Ltd {guosheng.hu,yang.hua,yuany,steven,rick}@,N.Robertson@ zhihong@,t.hospedales@,yongxin@yang.acAbstractDeep learning has achieved great success in face recog-nition,however deep-learned features still have limited in-variance to strong intra-personal variations such as large pose changes.It is observed that some facial attributes (e.g.eyebrow thickness,gender)are robust to such varia-tions.We present thefirst work to systematically explore how the fusion of face recognition features(FRF)and fa-cial attribute features(FAF)can enhance face recognition performance in various challenging scenarios.Despite the promise of FAF,wefind that in practice existing fusion meth-ods fail to leverage FAF to boost face recognition perfor-mance in some challenging scenarios.Thus,we develop a powerful tensor-based framework which formulates fea-ture fusion as a tensor optimisation problem.It is non-trivial to directly optimise this tensor due to the large num-ber of parameters to optimise.To solve this problem,we establish a theoretical equivalence between low-rank ten-sor optimisation and a two-stream gated neural network. This equivalence allows tractable learning using standard neural network optimisation tools,leading to accurate and stable optimisation.Experimental results show the fused feature works better than individual features,thus proving for thefirst time that facial attributes aid face recognition. We achieve state-of-the-art performance on three popular databases:MultiPIE(cross pose,lighting and expression), CASIA NIR-VIS2.0(cross-modality environment)and LFW (uncontrolled environment).1.IntroductionFace recognition has advanced dramatically with the ad-vent of bigger datasets,and improved methodologies for generating features that are variant to identity but invari-ant to covariates such as pose,expression and illumination. Deep learning methodologies[41,40,42,32]have proven particularly effective recently,thanks to end-to-endrepre-Figure1:A sample attribute list is given(col.1)which per-tains to the images of the same individual at different poses (col.2).While the similarity scores for each dimension vary in the face recognition feature(FRF)set(col.3),the face at-tribute feature(FAF)set(col.4)remains very similar.The fused features(col.5)are more similar and a higher similar-ity score(0.89)is achieved.sentation learning with a discriminative face recognition ob-jective.Nevertheless,the resulting features still show im-perfect invariance to the strong intra-personal variations in real-world scenarios.We observe that facial attributes pro-vide a robust invariant cue in such challenging scenarios.For example gender and ethnicity are likely to be invariant to pose and expression,while eyebrow thickness may be invariant to lighting and resolution.Overall,face recogni-tion features(FRF)are very discriminative but less robust;while facial attribute features(FAF)are robust but less dis-criminative.Thus these two features are potentially com-plementary,if a suitable fusion method can be devised.To the best of our knowledge,we are thefirst to systematically explore the fusion of FAF and FRF in various face recog-nition scenarios.We empirically show that this fusion can greatly enhance face recognition performance.Though facial attributes are an important cue for face recognition,in practice,wefind the existing fusion meth-ods including early(feature)or late(score)fusion cannot reliably improve the performance[34].In particular,while 1offering some robustness,FAF is generally less discrimina-tive than FRF.Existing methods cannot synergistically fuse such asymmetric features,and usually lead to worse perfor-mance than achieved by the stronger feature(FRF)only.In this work,we propose a novel tensor-based fusion frame-work that is uniquely capable of fusing the very asymmet-ric FAF and FRF.Our framework provides a more powerful and robust fusion approach than existing strategies by learn-ing from all interactions between the two feature views.To train the tensor in a tractable way given the large number of required parameters,we formulate the optimisation with an identity-supervised objective by constraining the tensor to have a low-rank form.We establish an equivalence be-tween this low-rank tensor and a two-stream gated neural network.Given this equivalence,the proposed tensor is eas-ily optimised with standard deep neural network toolboxes. Our technical contributions are:•It is thefirst work to systematically investigate and ver-ify that facial attributes are an important cue in various face recognition scenarios.In particular,we investi-gate face recognition with extreme pose variations,i.e.±90◦from frontal,showing that attributes are impor-tant for performance enhancement.•A rich tensor-based fusion framework is proposed.We show the low-rank Tucker-decomposition of this tensor-based fusion has an equivalent Gated Two-stream Neural Network(GTNN),allowing easy yet effective optimisation by neural network learning.In addition,we bring insights from neural networks into thefield of tensor optimisation.The code is available:https:///yanghuadr/ Neural-Tensor-Fusion-Network•We achieve state-of-the-art face recognition perfor-mance using the fusion of face(newly designed‘Lean-Face’deep learning feature)and attribute-based fea-tures on three popular databases:MultiPIE(controlled environment),CASIA NIR-VIS2.0(cross-modality environment)and LFW(uncontrolled environment).2.Related WorkFace Recognition.The face representation(feature)is the most important component in contemporary face recog-nition system.There are two types:hand-crafted and deep learning features.Widely used hand-crafted face descriptors include Local Binary Pattern(LBP)[26],Gaborfilters[23],-pared to pixel values,these features are variant to identity and relatively invariant to intra-personal variations,and thus they achieve promising performance in controlled environ-ments.However,they perform less well on face recognition in uncontrolled environments(FRUE).There are two main routes to improve FRUE performance with hand-crafted features,one is to use very high dimensional features(dense sampling features)[5]and the other is to enhance the fea-tures with downstream metric learning.Unlike hand-crafted features where(in)variances are en-gineered,deep learning features learn the(in)variances from data.Recently,convolutional neural networks(CNNs) achieved impressive results on FRUE.DeepFace[44],a carefully designed8-layer CNN,is an early landmark method.Another well-known line of work is DeepID[41] and its variants DeepID2[40],DeepID2+[42].The DeepID family uses an ensemble of many small CNNs trained in-dependently using different facial patches to improve the performance.In addition,some CNNs originally designed for object recognition,such as VGGNet[38]and Incep-tion[43],were also used for face recognition[29,32].Most recently,a center loss[47]is introduced to learn more dis-criminative features.Facial Attribute Recognition.Facial attribute recog-nition(FAR)is also well studied.A notable early study[21] extracted carefully designed hand-crafted features includ-ing aggregations of colour spaces and image gradients,be-fore training an independent SVM to detect each attribute. As for face recognition,deep learning features now outper-form hand-crafted features for FAR.In[24],face detection and attribute recognition CNNs are carefully designed,and the output of the face detection network is fed into the at-tribute network.An alternative to purpose designing CNNs for FAR is tofine-tune networks intended for object recog-nition[56,57].From a representation learning perspective, the features supporting different attribute detections may be shared,leading some studies to investigate multi-task learn-ing facial attributes[55,30].Since different facial attributes have different prevalence,the multi-label/multi-task learn-ing suffers from label-imbalance,which[30]addresses us-ing a mixed objective optimization network(MOON). Face Recognition using Facial Attributes.Detected facial attributes can be applied directly to authentication. Facial attributes have been applied to enhance face verifica-tion,primarily in the case of cross-modal matching,byfil-tering[19,54](requiring potential FRF matches to have the correct gender,for example),model switching[18],or ag-gregation with conventional features[27,17].[21]defines 65facial attributes and proposes binary attribute classifiers to predict their presence or absence.The vector of attribute classifier scores can be used for face recognition.There has been little work on attribute-enhanced face recognition in the context of deep learning.One of the few exploits CNN-based attribute features for authentication on mobile devices [31].Local facial patches are fed into carefully designed CNNs to predict different attributes.After CNN training, SVMs are trained for attribute recognition,and the vector of SVM scores provide the new feature for face verification.Fusion Methods.Existing fusion approaches can be classified into feature-level(early fusion)and score-level (late fusion).Score-level fusion is to fuse the similarity scores after computation based on each view either by sim-ple averaging[37]or stacking another classifier[48,37]. Feature-level fusion can be achieved by either simple fea-ture aggregation or subspace learning.For aggregation ap-proaches,fusion is usually performed by simply element wise averaging or product(the dimension of features have to be the same)or concatenation[28].For subspace learn-ing approaches,the features arefirst concatenated,then the concatenated feature is projected to a subspace,in which the features should better complement each other.These sub-space approaches can be unsupervised or supervised.Un-supervised fusion does not use the identity(label)informa-tion to learn the subspace,such as Canonical Correlational Analysis(CCA)[35]and Bilinear Models(BLM)[45].In comparison,supervised fusion uses the identity information such as Linear Discriminant Analysis(LDA)[3]and Local-ity Preserving Projections(LPP)[9].Neural Tensor Methods.Learning tensor-based compu-tations within neural networks has been studied for full[39] and decomposed[16,52,51]tensors.However,aside from differing applications and objectives,the key difference is that we establish a novel equivalence between a rich Tucker [46]decomposed low-rank fusion tensor,and a gated two-stream neural network.This allows us achieve expressive fusion,while maintaining tractable computation and a small number of parameters;and crucially permits easy optimisa-tion of the fusion tensor through standard toolboxes. Motivation.Facial attribute features(FAF)and face recognition features(FRF)are complementary.However in practice,wefind that existing fusion methods often can-not effectively combine these asymmetric features so as to improve performance.This motivates us to design a more powerful fusion method,as detailed in Section3.Based on our neural tensor fusion method,in Section5we system-atically explore the fusion of FAF and FRF in various face recognition environments,showing that FAF can greatly en-hance recognition performance.3.Fusing attribute and recognition featuresIn this section we present our strategy for fusing FAF and FRF.Our goal is to input FAF and FRF and output the fused discriminative feature.The proposed fusion method we present here performs significantly better than the exist-ing ones introduced in Section2.In this section,we detail our tensor-based fusion strategy.3.1.ModellingSingle Feature.We start from a standard multi-class clas-sification problem setting:assume we have M instances, and for each we extract a D-dimensional feature vector(the FRF)as{x(i)}M i=1.The label space contains C unique classes(person identities),so each instance is associated with a corresponding C-dimensional one-hot encoding la-bel vector{y(i)}M i=1.Assuming a linear model W the pre-dictionˆy(i)is produced by the dot-product of input x(i)and the model W,ˆy(i)=x(i)T W.(1) Multiple Feature.Suppose that apart from the D-dimensional FRF vector,we can also obtain an instance-wise B-dimensional facial attribute feature z(i).Then the input for the i th instance is a pair:{x(i),z(i)}.A simple ap-proach is to redefine x(i):=[x(i),z(i)],and directly apply Eq.(1),thus modelling weights for both FRF and FAF fea-tures.Here we propose instead a non-linear fusion method via the following formulationˆy(i)=W×1x(i)×3z(i)(2) where W is the fusion model parameters in the form of a third-order tensor of size D×C×B.Notation×is the tensor dot product(also known as tensor contraction)and the left-subscript of x and z indicates at which axis the ten-sor dot product operates.With Eq.(2),the optimisation problem is formulated as:minW1MMi=1W×1x(i)×3z(i),y(i)(3)where (·,·)is a loss function.This trains tensor W to fuse FRF and FAF features so that identity is correctly predicted.3.2.OptimisationThe proposed tensor W provides a rich fusion model. However,compared with W,W is B times larger(D×C vs D×C×B)because of the introduction of B-dimensional attribute vector.It is also almost B times larger than train-ing a matrix W on the concatenation[x(i),z(i)].It is there-fore problematic to directly optimise Eq.(3)because the large number of parameters of W makes training slow and leads to overfitting.To address this we propose a tensor de-composition technique and a neural network architecture to solve an equivalent optimisation problem in the following two subsections.3.2.1Tucker Decomposition for Feature FusionTo reduce the number of parameters of W,we place a struc-tural constraint on W.Motivated by the famous Tucker de-composition[46]for tensors,we assume that W is synthe-sised fromW=S×1U(D)×2U(C)×3U(B).(4) Here S is a third order tensor of size K D×K C×K B, U(D)is a matrix of size K D×D,U(C)is a matrix of sizeK C×C,and U(B)is a matrix of size K B×B.By restricting K D D,K C C,and K B B,we can effectively reduce the number of parameters from(D×C×B)to (K D×K C×K B+K D×D+K C×C+K B×B)if we learn{S,U(D),U(C),U(B)}instead of W.When W is needed for making the predictions,we can always synthesise it from those four small factors.In the context of tensor decomposition,(K D,K C,K B)is usually called the tensor’s rank,as an analogous concept to the rank of a matrix in matrix decomposition.Note that,despite of the existence of other tensor de-composition choices,Tucker decomposition offers a greater flexibility in terms of modelling because we have three hyper-parameters K D,K C,K B corresponding to the axes of the tensor.In contrast,the other famous decomposition, CP[10]has one hyper-parameter K for all axes of tensor.By substituting Eq.(4)into Eq.(2),we haveˆy(i)=W×1x(i)×3z(i)=S×1U(D)×2U(C)×3U(B)×1x(i)×3z(i)(5) Through some re-arrangement,Eq.(5)can be simplified as ˆy(i)=S×1(U(D)x(i))×2U(C)×3(U(B)z(i))(6) Furthermore,we can rewrite Eq.(6)as,ˆy(i)=((U(D)x(i))⊗(U(B)z(i)))S T(2)fused featureU(C)(7)where⊗is Kronecker product.Since U(D)x(i)and U(B)B(i)result in K D and K B dimensional vectors re-spectively,(U(D)x(i))⊗(U(B)z(i))produces a K D K B vector.S(2)is the mode-2unfolding of S which is aK C×K D K B matrix,and its transpose S T(2)is a matrix ofsize K D K B×K C.The Fused Feature.From Eq.(7),the explicit fused representation of face recognition(x(i))and facial at-tribute(z(i))features can be achieved.The fused feature ((U(D)x(i))⊗(U(B)z(i)))S T(2),is a vector of the dimen-sionality K C.And matrix U(C)has the role of“clas-sifier”given this fused feature.Given{x(i),z(i),y(i)}, the matrices{U(D),U(B),U(C)}and tensor S are com-puted(learned)during model optimisation(training).Dur-ing testing,the predictionˆy(i)is achieved with the learned {U(D),U(B),U(C),S}and two test features{x(i),z(i)} following Eq.(7).3.2.2Gated Two-stream Neural Network(GTNN)A key advantage of reformulating Eq.(5)into Eq.(7)is that we can nowfind a neural network architecture that does ex-actly the computation of Eq.(7),which would not be obvi-ous if we stopped at Eq.(5).Before presenting thisneural Figure2:Gated two-stream neural network to implement low-rank tensor-based fusion.The architecture computes Eq.(7),with the Tucker decomposition in Eq.(4).The network is identity-supervised at train time,and feature in the fusion layer used as representation for verification. network,we need to introduce a new deterministic layer(i.e. without any learnable parameters).Kronecker Product Layer takes two arbitrary-length in-put vectors{u,v}where u=[u1,u2,···,u P]and v=[v1,v2,···,v Q],then outputs a vector of length P Q as[u1v1,u1v2,···,u1v Q,u2v1,···,u P v Q].Using the introduced Kronecker layer,Fig.2shows the neural network that computes Eq.(7).That is,the neural network that performs recognition using tensor-based fu-sion of two features(such as FAF and FRF),based on the low-rank assumption in Eq.(4).We denote this architecture as a Gated Two-stream Neural Network(GTNN),because it takes two streams of inputs,and it performs gating[36] (multiplicative)operations on them.The GTNN is trained in a supervised fashion to predict identity.In this work,we use a multitask loss:softmax loss and center loss[47]for joint training.The fused feature in the viewpoint of GTNN is the output of penultimate layer, which is of dimensionality K c.So far,the advantage of using GTNN is obvious.Direct use of Eq.(5)or Eq.(7)requires manual derivation and im-plementation of an optimiser which is non-trivial even for decomposed matrices(2d-tensors)[20].In contrast,GTNN is easily implemented with modern deep learning packages where auto-differentiation and gradient-based optimisation is handled robustly and automatically.3.3.DiscussionCompared with the fusion methods introduced in Sec-tion2,we summarise the advantages of our tensor-based fusion method as follows:Figure3:LeanFace.‘C’is a group of convolutional layers.Stage1:64@5×5(64feature maps are sliced to two groups of32ones, which are fed into maxout function.);Stage2:64@3×3,64@3×3,128@3×3,128@3×3;Stage3:196@3×3,196@3×3, 256@3×3,256@3×3,320@3×3,320@3×3;Stage4:512@3×3,512@3×3,512@3×3,512@3×3;Stage5:640@ 5×5,640@5×5.‘P’stands for2×2max pooling.The strides for the convolutional and pooling layers are1and2,respectively.‘FC’is a fully-connected layer of256D.High Order Non-Linearity.Unlike linear methods based on averaging,concatenation,linear subspace learning [8,27],or LDA[3],our fusion method is non-linear,which is more powerful to model complex problems.Further-more,comparing with otherfirst-order non-linear methods based on element-wise combinations only[28],our method is higher order:it accounts for all interactions between each pair of feature channels in both views.Thanks to the low-rank modelling,our method achieves such powerful non-linear fusion with few parameters and thus it is robust to overfitting.Scalability.Big datasets are required for state-of-the-art face representation learning.Because we establish the equivalence between tensor factorisation and gated neural network architecture,our method is scalable to big-data through efficient mini-batch SGD-based learning.In con-trast,kernel-based non-linear methods,such as Kernel LDA [34]and multi-kernel SVM[17],are restricted to small data due to their O(N2)computation cost.At runtime,our method only requires a simple feed-forward pass and hence it is also favourable compared to kernel methods. Supervised method.GTNN isflexibly supervised by any desired neural network loss function.For example,the fusion method can be trained with losses known to be ef-fective for face representation learning:identity-supervised softmax,and centre-loss[47].Alternative methods are ei-ther unsupervised[8,27],constrained in the types of super-vision they can exploit[3,17],or only stack scores rather than improving a learned representation[48,37].There-fore,they are relatively ineffective at learning how to com-bine the two-source information in a task-specific way. Extensibility.Our GTNN naturally can be extended to deeper architectures.For example,the pre-extracted fea-tures,i.e.,x and z in Fig.2,can be replaced by two full-sized CNNs without any modification.Therefore,poten-tially,our methods can be integrated into an end-to-end framework.4.Integration with CNNs:architectureIn this section,we introduce the CNN architectures used for face recognition(LeanFace)designed by ourselves and facial attribute recognition(AttNet)introduced by[50,30]. LeanFace.Unlike general object recognition,face recognition has to capture very subtle difference between people.Motivated by thefine-grain object recognition in [4],we also use a large number of convolutional layers at early stage to capture the subtle low level and mid-level in-formation.Our activation function is maxout,which shows better performance than its competitors[50].Joint supervi-sion of softmax loss and center loss[47]is used for training. The architecture is summarised in Fig.3.AttNet.To detect facial attributes,our AttNet uses the ar-chitecture of Lighten CNN[50]to represent a face.Specifi-cally,AttNet consists of5conv-activation-pooling units fol-lowed by a256D fully connected layer.The number of con-volutional kernels is explained in[50].The activation func-tion is Max-Feature-Map[50]which is a variant of maxout. We use the loss function MOON[30],which is a multi-task loss for(1)attribute classification and(2)domain adaptive data balance.In[24],an ontology of40facial attributes are defined.We remove attributes which do not characterise a specific person,e.g.,‘wear glasses’and‘smiling’,leaving 17attributes in total.Once each network is trained,the features extracted from the penultimate fully-connected layers of LeanFace(256D) and AttNet(256D)are extracted as x and z,and input to GTNN for fusion and then face recognition.5.ExperimentsWefirst introduce the implementation details of our GTNN method.In Section5.1,we conduct experiments on MultiPIE[7]to show that facial attributes by means of our GTNN method can play an important role on improv-Table1:Network training detailsImage size BatchsizeLR1DF2EpochTraintimeLeanFace128x1282560.0010.15491hAttNet0.050.8993h1Learning rate(LR)2Learning rate drop factor(DF).ing face recognition performance in the presence of pose, illumination and expression,respectively.Then,we com-pare our GTNN method with other fusion methods on CA-SIA NIR-VIS2.0database[22]in Section5.2and LFW database[12]in Section5.3,respectively. Implementation Details.In this study,three networks (LeanFace,AttNet and GTNN)are discussed.LeanFace and AttNet are implemented using MXNet[6]and GTNN uses TensorFlow[1].We use around6M training face thumbnails covering62K different identities to train Lean-Face,which has no overlapping with all the test databases. AttNet is trained using CelebA[24]database.The input of GTNN is two256D features from bottleneck layers(i.e., fully connected layers before prediction layers)of LeanFace and AttNet.The setting of main parameters are shown in Table1.Note that the learning rates drop when the loss stops decreasing.Specifically,the learning rates change4 and2times for LeanFace and AttNet respectively.Dur-ing test,LeanFace and AttNet take around2.9ms and3.2ms to extract feature from one input image and GTNN takes around2.1ms to fuse one pair of LeanFace and AttNet fea-ture using a GTX1080Graphics Card.5.1.Multi-PIE DatabaseMulti-PIE database[7]contains more than750,000im-ages of337people recorded in4sessions under diverse pose,illumination and expression variations.It is an ideal testbed to investigate if facial attribute features(FAF) complement face recognition features(FRF)including tra-ditional hand-crafted(LBP)and deeply learned features (LeanFace)to improve the face recognition performance–particularly across extreme pose variation.Settings.We conduct three experiments to investigate pose-,illumination-and expression-invariant face recogni-tion.Pose:Uses images across4sessions with pose vari-ations only(i.e.,neutral lighting and expression).It covers pose with yaw ranging from left90◦to right90◦.In com-parison,most of the existing works only evaluate perfor-mance on poses with yaw range(-45◦,+45◦).Illumination: Uses images with20different illumination conditions(i.e., frontal pose and neutral expression).Expression:Uses im-ages with7different expression variations(i.e.,frontal pose and neutral illumination).The training sets of all settings consist of the images from thefirst200subjects and the re-maining137subjects for testing.Following[59,14],in the test set,frontal images with neural illumination and expres-sion from the earliest session work as gallery,and the others are probes.Pose.Table2shows the pose-robust face recognition (PRFR)performance.Clearly,the fusion of FRF and FAF, namely GTNN(LBP,AttNet)and GTNN(LeanFace,At-tNet),works much better than using FRF only,showing the complementary power of facial features to face recognition features.Not surprisingly,the performance of both LBP and LeanFace features drop greatly under extreme poses,as pose variation is a major factor challenging face recognition performance.In contrast,with GTNN-based fusion,FAF can be used to improve both classic(LBP)and deep(Lean-Face)FRF features effectively under this circumstance,for example,LBP(1.3%)vs GTNN(LBP,AttNet)(16.3%), LeanFace(72.0%)vs GTNN(LeanFace,AttNet)(78.3%) under yaw angel−90◦.It is noteworthy that despite their highly asymmetric strength,GTNN is able to effectively fuse FAF and FRF.This is elaborately studied in more detail in Sections5.2-5.3.Compared with state-of-the-art methods[14,59,11,58, 15]in terms of(-45◦,+45◦),LeanFace achieves better per-formance due to its big training data and the strong gener-alisation capacity of deep learning.In Table2,2D meth-ods[14,59,15]trained models using the MultiPIE images, therefore,they are difficult to generalise to images under poses which do not appear in MultiPIE database.3D meth-ods[11,58]highly depend on accurate2D landmarks for 3D-2D modellingfitting.However,it is hard to accurately detect such landmarks under larger poses,limiting the ap-plications of3D methods.Illumination and expression.Illumination-and expression-robust face recognition(IRFR and ERFR)are also challenging research topics.LBP is the most widely used handcrafted features for IRFR[2]and ERFR[33].To investigate the helpfulness of facial attributes,experiments of IRFR and ERFR are conducted using LBP and Lean-Face features.In Table3,GTNN(LBP,AttNet)signifi-cantly outperforms LBP,80.3%vs57.5%(IRFR),77.5% vs71.7%(ERFR),showing the great value of combining fa-cial attributes with hand-crafted features.Attributes such as the shape of eyebrows are illumination invariant and others, e.g.,gender,are expression invariant.In contrast,LeanFace feature is already very discriminative,saturating the perfor-mance on the test set.So there is little room for fusion of AttrNet to provide benefit.5.2.CASIA NIR-VIS2.0DatabaseThe CASIA NIR-VIS2.0face database[22]is the largest public face database across near-infrared(NIR)images and visible RGB(VIS)images.It is a typical cross-modality or heterogeneous face recognition problem because the gallery and probe images are from two different spectra.The。
语言学重要概念梳理(中英文对照版)

语⾔学重要概念梳理(中英⽂对照版)第⼀节语⾔的本质⼀、语⾔的普遍特征(Design Features)1.任意性 Arbitratriness:shu 和Tree都能表⽰“树”这⼀概念;同样的声⾳,各国不同的表达⽅式2.双层结构Duality:语⾔由声⾳结构和意义结构组成(the structure ofsounds and meaning)3.多产性productive: 语⾔可以理解并创造⽆限数量的新句⼦,是由双层结构造成的结果(Understand and create unlimited number withsentences)4.移位性 Displacemennt:可以表达许多不在场的东西,如过去的经历、将来可能发⽣的事情,或者表达根本不存在的东西等5.⽂化传播性 Cultural Transmission:语⾔需要后天在特定⽂化环境中掌握⼆、语⾔的功能(Functions of Language)1.传达信息功能 Informative:最主要功能The main function2.⼈际功能 Interpersonal:⼈类在社会中建⽴并维持各⾃地位的功能establish and maintain their identity3.⾏事功能 performative:现实应⽤——判刑、咒语、为船命名等Judge,naming,and curses4.表情功能 Emotive Function:表达强烈情感的语⾔,如感叹词/句exclamatory expressions5.寒暄功能 Phatic Communion:应酬话phatic language,⽐如“吃了没?”“天⼉真好啊!”等等6.元语⾔功能 Metalingual Function:⽤语⾔来谈论、改变语⾔本⾝,如book可以指现实中的书也可以⽤“book这个词来表达作为语⾔单位的“书”三、语⾔学的分⽀1. 核⼼语⾔学 Core linguistic1)语⾳学 Phonetics:关注语⾳的产⽣、传播和接受过程,着重考察⼈类语⾔中的单⾳。
Monodisperse NaYF4 Yb,Er Core and Core Shell-Structured Nanocrystals

Highly Efficient Multicolor Up-Conversion Emissions and Their Mechanisms of Monodisperse NaYF4:Yb,Er Core and Core/Shell-Structured NanocrystalsHao-Xin Mai,Ya-Wen Zhang,*Ling-Dong Sun,and Chun-Hua Yan*Beijing National Laboratory for Molecular Sciences,State Key Lab of Rare Earth Materials Chemistry andApplications&PKU-HKU Joint Lab in Rare Earth Materials and Bioinorganic Chemistry,Peking Uni V ersity,Beijing100871,ChinaRecei V ed:May21,2007;In Final Form:July6,2007This paper comprehensively presents the highly efficient multicolor up-conversion(UC)emissions and relatedmechanisms of monodisperse NaYF4:Yb,Er core(R-and -NaYF4:Yb,Er)and core/shell(R-NaYF4:Yb,-Er@R-NaYF4and -NaYF4:Yb,Er@R-NaYF4)nanocrystals with controlled size(5-14nm for R-phasenanocrystals and20-300nm for -phase nanocrystals),chemical composition,and surface state.Thesenanoparticles were synthesized via a unique delayed nucleation pathway using trifluoroacetates as precursorsin hot solutions of oleic acid/oleylamine/1-octadecene.With the naked eye and natural light the intensemulticolor UC emissions(red,yellow,or green,without filters)can be observed in cyclohexane dispersionsof as-prepared nanocrystals(1wt%)excited by a980nm laser source(power density1.22W cm-2).On thebasis of compositional optimization for -NaYF4:Yb,Er nanocrystals,the intensity ratio of green to red emission(f g/r)reaches ca.30,the highest value to our knowledge.The highly efficient multicolor UC emissions werearoused from the controlled crystallite size,phase,and associated defect state.R-NaYF4:Yb,Er and large-NaYF4:Yb,Er nanocrystals displayed a normal two-photon UC process excited by a980nm NIR laser,while small -NaYF4:Yb,Er nanocrystals showed an unusual partially three-photon process.Shell formationcould remarkably decrease the surface defects and surface ligands influence and thus decrease the associatednonradiative decays.As a result,the core/shell-structured R-NaYF4:Yb,Er@R-NaYF4and -NaYF4:Yb,Er@R-NaYF4nanocrystals exhibited greatly enhanced green emission intensity,f g/r,and saturation power with respectto their counterparts.The remarkable UC properties of the as-synthesized NaYF4:Yb,Er core and core/shellnanocrystals demonstrate that they are promising UC nanophosphors of adequate theoretical and practicalinterest.IntroductionRecently,studies on up-conversion(UC)phosphors have grown rapidly owing to their wide applications in solid-state lasers,three-dimensional flat-panel displays,optical fiber-based telecommunications,low-intensity IR imaging,1,2and especially bioprobes and bioimages.3Compared with the traditionally used biological labels such as rhodamine,4a fluorescein,4b isothio-cyanates,4c cyanine dyes,4d and semiconductors,4e-h conceivable advantages of near-infrared(NIR)to visible up-conversion fluorescent bioprobes include a weak autofluorescence back-ground,thus avoiding photodegradation in biotagging applica-tions(which will simplify detection of the labeled target molecules and increase the sensitivity),the noninvasive excita-tion of980nm NIR light,the strong ability of penetration for NIR radiation(which will make in vivo imaging easy),the resistance to photobleaching,high detection limits,and low toxicity(compared with the majority of current commercialized labels such as organic dyes and quantum dots).4,5However, commercially available UC phosphors normally consist of submicrometer-or micrometer-sized grains which do not form transparent colloids and are much too large to substitute for molecular dyes in biological tagging applications.Therefore,it is a challenge to synthesize differently sized UC nanomaterials selectively from5to300nm for various use for probes,tags,and imaging technologies.6Among the UC materials,hexagonal NaYF4( -NaYF4)isthe most efficient host material for green and blue UC phosphorswhen activated by Yb3+and Er3+/Tm3+ions due to the verylow phonon energy of its lattice.1,7As NaYF4is such a superiormaterial,many works have been done to study the structureand UC mechanism of the bulk NaYF4:Yb,Er.1,7 -NaYF4hasthree cation sites.Site A at(2/3,1/3,1/2),showing occupationaldisorder involving a1:1ratio of Na+and rare-earth cations(RE3+),is coordinated by nine F-ions,forming tricappedtrigonal prisms with crystallographic C3h symmetry.Site B at(0,0,0),which is fully occupied by RE3+,shows a low C1symmetry due to the different directions of the three F1atomscapping the F2prism.The third cation site,with irregularoctahedral coordination,is half vacant and half occupied by Na+.The presence of two independent sites for both Yb3+and Er3+ions in the most efficient UC material -NaYF4:Yb,Er qua-druples the number of possible Yb3+f Er3+energy-transfer processes and thus significantly increases the probability of anextremely efficient resonant or near resonant process.7e,f Thered(4F9/2)and green(4S3/2)UC of the -NaYF4:Yb,Er are two-photon processes at room temperature due to the highly efficientYb3+2F5/2f Er3+4F11/2energy transfer dominating the whole UC process,while at low temperature(5K)the red4F9/2is a three-photon process because of the inefficient cross-relaxation*To whom correspondence should be addressed.Fax:+86-10-6275-4179.E-mail:yan@.13721J.Phys.Chem.C2007,111,13721-1372910.1021/jp073920d CCC:$37.00©2007American Chemical SocietyPublished on Web08/24/2007process increase.7b,c However,for nanosized -NaYF 4:Yb,Er,the systemic study of the UC mechanism is scare.Therefore,it remains an open topic to obtain NaYF 4:Yb,Er nanomaterials with different sizes,high UC intensity,and various high-purity colors.More recently,we obtained monodisperse R -NaYF 4:Yb,Er and -NaYF 4:Yb,Er nanocrystals with controlled size,chemical composition,and surface state using trifluoroacetates as precur-sors in hot surfactant solutions via a unique delayed nucleation pathway.6j In this article,we report the UC properties and mechanisms of these differently sized monodisperse NaYF 4:Yb,Er core and core/shell-structured nanocrystals.Interestingly,the nanocrystals show intense light emissions in various colors without using any filters (Figures 1a -c,e).On the basis of the uncovered UC mechanism,diverse NaYF 4:Yb,Er nanostructures with higher UC intensity and intensity ratio of green to red (f g/r )can be synthesized designedly.Experimental SectionSynthesis was carried out using standard oxygen-free pro-cedures and commercially available reagents.Rare-earth oxides (RE )Y,Yb,Er,and Tm),oleic acid (OA;90%,Alpha),oleylamine (OM;>80%,Acros),1-octadecene (ODE;>90%,Acros),trifluoroacetic acid (99%,Acros),CF 3COONa (>97%,Acros),absolute ethanol,and cyclohexane were used as received.RE(CF 3COO)3were prepared by the literature method.8,6c1.Synthesis of r -NaYF 4:20%Yb,2%Er Core and -NaYF 4:20%Yb,2%Er Nanocrystals.Differently sized R -and -NaYF 4:20%Yb,2%Er core nanocrystals were obtained by following the synthetic procedure reported elsewhere (Table 1).6j2.Synthesis of NaYF 4:20%Yb,2%Er@r -NaYF 4(Core/Shell)Nanocrystals.A 1.3mmol amount of NaYF 4:20%Yb,2%Er core (R or ),0.5mmol of Y(CF 3COO)3,and 0.5mmol of CF 3COONa were added to a mixture of OA (20mmol)and ODE (20mmol)in a three-necked flask at room temperature.Then the slurry was heated to 100°C to remove water and oxygen with vigorous magnetic stirring under vacuum for 30min in a temperature-controlled electromantle,thus forming an optically transparent solution.The solution was then heated to 250°C at a heating rate of 20°C min -1and maintained at this temperature for 0.5h under an Ar atmosphere.When the reaction was completed,an excess amount of ethanol was poured into the solution at room temperature.The resultant mixture was centrifugally separated,and the products were collected.The as-precipitated nanocrystals without any size selection were washed several times with ethanol and then dried in air at 70°C overnight.The afforded nanocrystals could be easily redispersed in various nonpolar organic solvents (e.g.,cyclohexane).3.Synthesis of -NaYF 4:30%Yb,0.5%Tm Nanocrystals. -NaYF 4:30%Yb,0.5%Tm nanocrystals were obtained by fol-lowing the synthetic procedure of -NaYF 4:20%Yb,2%Er nanocrystals.6j4.Instrumentation.Inductively coupled plasma (ICP-AES)(Plasma-Spec,Leeman Labs.Inc.)was used to determine Y 3+,Yb 3+,and Er 3+contents in NaYF 4:Yb,Er nanocrystals.Powder X-ray diffraction (XRD)patterns of the dried powders were recorded on a Rigaku D/MAX-2000diffractometer (Japan)with a slit of 1/2°at a scanning rate of 2°min -1using Cu K R radiation (λ)1.5418Å).The lattice parameters were calculated with the least-squares method.Samples for transmission electron microscopy (TEM)analysis were prepared by drying a drop of nanocrystal dispersion in cyclohexane on amorphous carbon-coated copper grids.Particle sizes and shapes were examined by a TEM (200CX,JEOL,Japan)operated at 160kV.High-resolution TEM (HRTEM)was performed on a Philips Tecnai F30FEG-TEM (USA)operated at 300kV.The UC emission spectra of NaYF 4:Yb,Er/Tm nanocrystals redispersed in cyclo-hexane (1wt %)were measured on a modified Hitachi F-4500spectrophotometer with an external tunable 2W 980nm laser diode (50mW for NaYF 4:Yb,Er nanocrystals and 380mW as the high pumping power for NaYF 4:Yb,Er nanocrystals (Figure S4))as the excitation source in place of the xenon lamp in the spectrometer.Results and Discussion1.Characteristics of NaYF 4:Yb,Er Core and Core/Shell-Structured Nanocrystals.Via a unique delayed nucleation pathway,differently sized monodisperse R -NaYF 4:Yb,Er (5-14nm)and -NaYF 4:Yb,Er (20-300nm)core nanocrystals were synthesized from trifluoroacetate precursors at temperatures ranging from 250to 330°C in OA/OM/ODE (Table 1).6j The nanocrystals are single crystallites in the shape of a polyhedron and truncated cube for the R -phase and spheres,hexagonal prism,and hexagonal plate for the -phase.6jIn the presence of CF 3COONa and Y(CF 3COO)3precursors at 250°C for 30min in OA/ODE,R -NaYF 4:Yb,Er@R -NaYF 4nanocrystals were synthesized using 8.0nm R -NaYF 4:Yb,Er nanopolyhedra as the core nanocrystals,while -NaYF 4:Yb,-Er@R -NaYF 4nanocrystals were obtained using 27.7nm -NaYF 4:Yb,Er as the core nanocrystals (Figures 2and S1).The size of monodisperse R -NaYF 4:Yb,Er@R -NaYF 4nanoc-rystals is 13.6(0.7nm,5nm larger than that of the R -NaYF 4:Yb,Er core (Figure 2a).In addition,the energy-dispersive X-ray analysis spectra of the core and core/shell nanoparticles (which is detected in three different areas of the copper grid)imply the increased tendency of the atomic ratio of Y:Yb of an individual nanoparticle after the core/shell treatment(FigureFigure 1.Fluorescence photographs of (a)185nm -NaY 0.78Yb 0.2-Er 0.02F 4hexagonal nanoplates,(b) 5.1nm R -NaY 0.78Yb 0.2Er 0.02F 4nanopolyhedra,(c)8.0nm R -NaY 0.78Yb 0.2Er 0.02F 4nanopolyhedra,(d)R -NaY 0.78Yb 0.2Er 0.02F 4@R -NaYF 4nanopolyhedra,(e)20.2nm -NaY 0.78-Yb 0.2Er 0.02F 4nanospheres,(f) -NaY 0.78Yb 0.2Er 0.02F 4@R -NaYF 4nano-spheres,and (g)100nm -NaY 0.695Yb 0.3Tm 0.005F 4nanoplates (λex )980nm;pumping power,50mW).Figure 2.TEM and HRTEM (inset)images of the R -NaY 0.78Yb 0.2-Er 0.02F 4@R -NaYF 4nanopolyhedra (a)and -NaY 0.78Yb 0.2Er 0.02F 4@R -NaYF 4nanospheres (b).13722J.Phys.Chem.C,Vol.111,No.37,2007Mai et al.S1c,d).As a result,we conclude that the core/shell structure of R -NaYF 4:Yb,Er@R -NaYF 4is formed.Figure 2b shows that the size of monodisperse -NaYF 4:Yb,Er@R -NaYF 4nanospheres is 32.6(1.1nm,around 5nm larger than that of the -NaYF 4:Yb,Er core.The XRD pattern shows the reflections of hexagonal NaYF 4along with a little cubic phase (Figure S1b).As the core nanocrystals are of pure hexagonal phase,the size of the particles increases uniformly,and no tiny particles are found with TEM after adding CF 3COONa and Y(CF 3COO)3precursors,we suggest that the appreciable amount of cubic phase must originate from the shells and R -NaYF 4should be grown on the surface of the -NaYF 4:Yb,Er cores.6h The HRTEM image inset in Figure 2b indicates an interplanar spacing of 0.52nm corresponding to the (10-10)crystal plane for the -NaYF 4:Yb,Er core and 0.30nm corresponding to the (111)crystal plane for the R -NaYF 4shell,again confirming formation of a -NaY 0.78Yb 0.2Er 0.02F 4@R -NaYF 4core/shell structure. 2.UC Properties of Differently Sized r -NaYF 4:Yb,Er, -NaYF 4:Yb,Er Nanocrystals and Their Core/Shell Struc-tures.2.1.UC Emission of Differently Sized R -NaYF 4:Yb,Er and -NaYF 4:Yb,Er Nanocrystals.All the NaYF 4:Yb,Er nanoc-rystal dispersions (1wt %)in cyclohexane show intensive emission under 980nm laser diode excitation into the 2F 7/2f 2F 5/2absorption of the Yb3+ion with a power density of 1.22W cm -2(Figure 1a -e),which can be observed by the naked eye even under lamplight.Figure 3a shows the UC spectra of the differently sized R -NaYF 4:Yb,Er nanopolyhedra dispersions (1wt %)in cyclohexane.Three typical emission peaks at 525,541,and 655nm are observed attributable to the energy transfer from (4H 11/2,4S 3/2)to 4I 15/2(green,weak)and from 4F 9/2to 4I 15/2(red,intensive)of Er 3+,respectively (Figure 3a).The intensity ratio of green to red emission (f g/r )1,2,6of the R -NaYF 4:Yb,Er nanopolyhedra is dependent upon the size of the nanocrystals.As the size of R -NaYF 4:Yb,Er nanopolyhedra decreases fromTABLE 1:Crystal Structure,Space Group,Size,Morphology,and Calculated Lattice Constants of the As-Obtained NaYF 4:Yb,Er Core and Core/Shell-Structured Nanocrystalsstructurespace group size/nm morphology lattice constants R -NaYF 4:Yb,Er cubic F m-3m 13.7(0.8a polyhedron a )5.546(8)Å8.0(1.0polyhedron a )5.485(6)Å5.1(0.6truncated cube a )5.480(3)Å -NaYF 4:Yb,ErhexagonalP -620.2(0.9spherea )5.99(2)Åc )3.54(2)Å47.1(2.0hexagonal prism a )5.97(1)Åc )3.51(1)Å185(9hexagonal plate a )5.991(5)Åc )3.524(4)ÅR -NaYF 4:Yb,Er@R -NaYF 4cubic F m-3m13.6(0.7polyhedron a )5.490(3)Å-NaYF 4:Yb,Er@R -NaYF 432.6(1.1sphereaThe standard deviation statistic from at least 100particles.Figure 3.UC spectra of differently sized (a)R -NaY 0.78Yb 0.2Er 0.02F 4and (b) -NaY 0.78Yb 0.2Er 0.02F 4nanocrystal dispersions (1wt %)in cyclohexane.(c)Diagram of f r/g versus the size of -NaY 0.78Yb 0.2Er 0.02F 4nanocrystals.Highly Efficient Multicolor Up-Conversion Emissions J.Phys.Chem.C,Vol.111,No.37,20071372313.7to8.0nm,f g/r decreases from0.63to0.43.As thenanopolyhedra shrink to 5.1nm in size,f g/r significantlydiminishes to0.13.An intense red emission is observablewith the naked eye(Figure1b)from their dispersion incyclohexane(1wt%)under980nm excitation,implying thatthese nanocrystals are good candidates for red emission UCmaterials.Under980nm NIR excitation intense green light is observedwith the naked eye for differently sized -NaYF4:Yb,Er nano-crystal dispersions(1wt%)in cyclohexane(Figure1a and e).As seen from the UC spectra shown in Figure3b,two intensivegreen emission bands in the range of510-530nm and530-560nm are ascribed to2H11/2f4I15/2and4S3/2f4I15/2 transitions,respectively,while the weak red emission bandbetween640and670nm is assigned to a4F9/2f4I15/2 transition.3-5,7,8Similar to the case of the R-NaYF4:Yb,Er nanocrystals,f g/r increases with the size of -NaYF4:Yb,Er nanocrystals(Figure3b)below70nm.Figure3c is the diagram of f g/r(calculated from Figure3b)versus the size of -NaY0.78-Yb0.2Er0.02F4nanocrystals.It can be seen that f g/r is7.3, 8.3,11,12,and17for20.2,27.7,38.1,47.1,and72.1nm -NaYF4:Yb,Er nanocrystals,respectively.When the size of the -NaYF4:Yb,Er nanocrystals exceeds70nm,f g/r is unaltered as f g/r)17(Figure3b,c).This result indicates that the -NaYF4: Yb,Er nanocrystals show similar UC properties to its bulk counterpart and f g/r is size independent for nanocrystals over 70nm in size.positional Optimization of Differently Sized -NaYF4:Yb,Er Nanocrystals.It is well known that the I UC and f g/r canbe tuned by changing the proportion of Yb and Er concentration.Recently,it was reported that for bulk UC materials the bestgreen UC emissions are obtained for Er3+ions with several Yb3+neighbors rather than Er3+for excitation energy transfer in thepresence of enough optically inactive Y3+ions for restrainingthe energy migration from the active ions to killer traps.1,7,2cFor bulk hexagonal NaYF4:Yb,Er,Kramer et al.obtained f g/rvalues between1.923and5.162c and Huang et al.reported aconsiderably high f g/r value of approximately12.2e In the presentwork,as discussed above,when the particle size of the -NaYF4:Yb,Er exceeds70nm,the UC properties of -NaYF4:Yb,Ershow faint size dependence and approach to the bulk materials.Therefore,we choose20.2nm -NaYF4:Yb,Er nanospheres and185nm -NaYF4:Yb,Er nanoplates as typical examples of smalland large nanocrystals to optimize the composition,respectively.For the185nm -NaYF4:Yb,Er nanoplates,I UC and f g/r decreasemonotonically with the increase of the Yb3+concentration from10to30mol%(Figure4a,b)with the concentration of Er3+fixed at2mol%.It seems that the presence of more Yb3+ionsin the lattice makes the distance between Yb3+and Er3+ionsshorter,resulting in energy back transfer from Er3+to Yb3+ions.Also,the cross-relaxation between Er3+and Yb3+will beincreased,causing the population to diminish in(2H11/2or4S3/2)levels(Er3+)and enhancement of the population in the4F9/2level(Er3+),leading to the decrease of I UC and f g/r,respectively.Similarly,I UC and f g/r also decrease monotonically with theincrease of the Er3+concentration from0.5to3mol%(Figure4c,d)with the concentration of Yb3+fixed at20mol%,whichis due to the increasing interactions between neighboring Er3+ions.This is in good agreement with that reported previouslyto obtain the highest output of the green luminescence for itspractical application.2a,7a,d Therefore,the optimized componentof the large-sized -NaYF4:Yb,Er is10%Yb and0.5%Er doped,the f g/r of which is as high as30(Figure S2),which is the highestf g/r value reported to our knowledge.For the20.2nm -NaYF4:Yb,Er nanospheres,when the concentration of Er3+is fixed at2mol%,I UC increases with Yb3+concentration from10to20mol%and decreases with further increasing the Yb3+concentration from20to30mol% (Figure4e),while f g/r increases slightly when the Yb3+ concentration increases from10to15mol%and decreases abruptly with further increasing the Yb3+concentration from 15to30mol%(Figure4f).I UC increases obviously when the Er3+concentration increases from0.5to2mol%with the fixed concentration of Yb3+at20mol%and then decreases with further increasing the concentration of Er3+ions(Figure4g), while f g/r decreases monotonically with increasing the Er3+ concentration from0.5to5mol%(Figure4h).On the basis of these results,it can be confirmed that higher Yb3+and Er3+ concentrations will cause the concentration quenching of the -NaYF4:Yb,Er nanocrystals,and the quenching concentration for the small -NaYF4:Yb,Er nanocrystals is higher than that for the large ones.2.3.UC Properties of R-NaYF4:Yb,Er and -NaYF4:Yb,Er Core/Shell-Structured Nanocrystals.Generally,the emission efficiency of doped nanoparticles is usually lower than that of the corresponding bulk material as a result of energy-transfer processes to the surface through adjacent dopant ions or because the luminescence of surface dopant ions is quenched.As we known,coating a shell made up of a material through which energy cannot be transferred around the doped nanoparticles can suppress these quenched processes and enhance the emission of the phosphors greatly.6h,9In the present work,panels a and b of Figure5depict the comparison of the UC spectra of the core/shell-structured nanocrystals with their core counterparts.Formation of core/shell-structured R-NaYF4: Yb,Er@R-NaYF4enhances both the intensity of green emission by200%and f g/r from0.4to2.0.The intensity of red emission decreases markedly to only0.55times as high as that ofR-NaYF4:Yb,Er nanocrystals(Figure5a).Therefore,8.0nmR-NaYF4:Yb,Er nanopolyhedra exhibit an intense yellow emis-sion(Figure1c),while the emission of the R-NaYF4:Yb,Er@R-NaYF4nanopolyhedra is yellowish-green(Figure1d).As discussed above,we know that an increase in particle size and a lower concentration of Er3+and Yb3+dopants will also lead to increased I UC and f g/r for NaYF4:Yb,Er.As a result,13.6nmR-NaY0.88Yb0.1Er0.02F4nanopolyhedra were synthesized,and the corresponding UC spectrum is shown in Figure S3.It can be seen that the UC spectra of13.6nm R-NaY0.88Yb0.1Er0.02F4 nanopolyhedra and10.8nm R-NaY0.78Yb0.2Er0.02F4core are similar,but both are quite different from that of the core/shell structures.The lower concentration of Er3+and Yb3+dopants of R-NaYF4led to the increase in the green to red ratio,but the variations of the I UC and f g/r are slight.Therefore,the great enhancement of I UC and f g/r for R-NaY0.78Yb0.2Er0.02F4@R-NaYF4compared with the R-NaY0.78Yb0.2Er0.02F4core shown in Figure5a is indeed caused by the core/shell structures. For the core/shell-structured -NaYF4:Yb,Er@R-NaYF4the value of f g/r is17(Figure5b),significantly greater than f g/r of 8for27.7nm -NaYF4:Yb,Er nanospheres but closer to that of the large-sized -NaYF4:Yb,Er nanoplates(Figure3c).The green emission of -NaYF4:Yb,Er@R-NaYF4nanospheres is more intense by50%compared with that of -NaYF4:Yb,Er nanocrystals,while the intensity of the red emission is decreased to only0.71times as high as that of -NaYF4:Yb,Er nanocrystals (Figures1e,f and5b).It can be seen that the core/shell structure is both effective for enhancing the UC emission of R-NaYF4: Yb,Er and -NaYF4:Yb,Er.13724J.Phys.Chem.C,Vol.111,No.37,2007Mai et al.Figure 4.Diagrams of I UC and f g/r versus (a,b)doping content of Yb 3+ions at a fixed Er 3+content of 2mol %and (c,d)doping content of Er 3+ions at a fixed Yb 3+content of 20mol %for 185nm -NaYF 4:Yb,Er nanoplates.Diagrams of I UC and f g/r versus (e,f)doping content of Yb 3+ions at a fixed Er 3+content of 2mol %and (g,h)doping content of Er 3+ions at a fixed Yb 3+content of 20mol %for 20.2nm -NaYF 4:Yb,Er nanospheres.The relative metal contents of the NaYF 4:Yb,Er nanocrystals were determined by ICP method.Highly Efficient Multicolor Up-Conversion Emissions J.Phys.Chem.C,Vol.111,No.37,2007137253.UC Mechanisms of NaYF 4:Yb,Er Nanocrystals.3.1.R -NaYF 4:Yb,Er and R -NaYF 4:Yb,Er@R -NaYF 4Nanocrystals.The UC spectra of 13.6,8.0,and 5.1nm R -NaYF 4:Yb,Er nanopolyhedra redispersed in cyclohexane (1wt %)under 980nm excitation (50mW)are shown in Figure 3a.f g/r decreases with the size of the nanocrystals.To determine the number of photons involved in the UC process of these nanocrystals,the intensities of the UC emissions are recorded as a function of the 980nm excitation intensity density in log -log plots.1,6a,d,e,7,10Both the slopes for the red and green curves are about 2at relatively low excitation densities (Figure 6a -c),indicating a two-photon emission process.At high excitation density the slope of the curve is reduced due to saturation of the UC process.As suggested by Suyver et al.,7g this saturation will prove that the present up-conversion process is a sensitized up-conversion process involving Yb 3+and Er 3+rather than a purely ESA-type process involving only Er 3+.The saturation power of 5.1nm R -NaYF 4:Yb,Er nanopolyhedra is 428mW,significantly higher than that (242mW)of 13.6and 8.0nm R -NaYF 4:Yb,Er nanopolyhedra.The two-photon UC mechanism is described in Figure 7a.An Yb 3+ion in ground-state 2F 7/2absorbs a photon and transits to excited-state 2F 5/2,and then drops back to the ground state while transferring the energy to an adjacent Er 3+ion,which populates the 4I 11/2level from the ground-state 4I 15/2(energy transfer,ET).Then a second 980nm photon,or energy transfer from an Yb 3+ion,can populate the 4F 7/2level of the Er 3+ion.The Er 3+ion can then relax nonradiatively to the 2H 11/2and 4S 3/2levels,and the green 2H 11/2f 4I 15/2and 4S 3/2f 4I 15/2emissions occur.Alternatively,the Er 3+ion can further relax and populate the 4F 9/2level,leading to the red 4F 9/2f 4I 15/2emission.Also,the Er 3+ion in the 4I 11/2state maynonradiativelyFigure 5.UC spectra of the (a)R -NaY 0.78Yb 0.2Er 0.02F 4@R -NaYF 4nanopolyhedra and (b) -NaY 0.78Yb 0.2Er 0.02F 4@R -NaYF 4nanospheres.Figure 6.log -log diagrams of green and red luminescence intensities for 13.6(a),8.0(b),and 5.1nm (c)R -NaY 0.78Yb 0.2Er 0.02F 4nanopolyhedra and (d)R -NaYF 4:Yb,Er@R -NaYF 4nanocrystals redispersed in cyclohexane (1wt %).13726J.Phys.Chem.C,Vol.111,No.37,2007Mai et al.decay to the 4I 13/2state and then populate the 4F 9/2level via energy transfer from the excited Yb 3+ions,leading to the red 4F 9/2f 4I 15/2emission.These ET processes are shown in the Figure 7a.As the slopes of 2H 11/2f 4I 15/2and 4F 9/2f 4I 15/2of the differently sized R -NaY 0.78Yb 0.2Er 0.02F 4nanopolyhedra are close to 2,we suggest that the nonradiative decay is the main process to quench the green emission of the R -NaYF 4:Yb,Er nanocrystals.From the mechanism discussed above,the ratio of nonradia-tive decay increases when the size of R -NaYF 4:Yb,Er nanopo-lyhedra decreases from 8.0to 5.1nm,leading to the decrease of f g/r .It is well known that f g/r is influenced by several factors,such as doping levels,excitation density,preparation temper-ature,oxygen impurities,crystallinity,surface ligands,and defects.1,2,6,7,11For the differently sized R -NaYF 4:Yb,Er nan-opolyhedra (which were prepared by extending the reaction time),the excitation power and preparation temperature are fixed and the doping levels are nearly unaltered after 1h reaction (Table S1).Moreover,as f g/r of the products decreases by prolonging the reaction time from 1to 5h and increases from 5to 10h,the crystallinity is excluded as the most important factor,considering its influence on f g/r should be monotonic with the reaction time and all of the nanocrystals in the present work are highly crystallized.Therefore,the variation of f g/r is correlated with the oxygen impurities,surface ligands,and surface defect of the R -NaYF 4:Yb,Er nanocrystals.We consider that the smaller the nanocrystals,the smaller the f g/r since a large number of Er 3+ions should be located close to the surface and hence in proximity to defects,surface states,ligands,and impurities and should therefore be able to quench the excited Er 3+states.Considering the growth of the whole process of the rare-earth fluoride nanocrystals,the initial stage is the replacement of the RE -O bond with a RE -F bond,9c resulting in oxygen impurities in the NaYF 4:Yb,Er nanocrystals decreas-ing the size growth (by monomer supply)stage due to the finished fluorination.In the size shrinkage (by dissolution)stage,the large particles are redissolved by OA and transformed into small truncated nanocubes.As revealed in the IR spectra of our previous article,the smaller the particle size,the stronger the bonding between OA molecules and the surface atoms of the nanocrystals.It is rational that the surfaces of the 5.1nm R -NaYF 4:Yb,Er truncated cube are deeply etched by the strongly coordinative OA ligands.In addition,the influence of the surface increases with the shrinkage in particle size.As a result,for the smaller particles,the high vibrational energies of the strong binding organic ligands and the increased surface defect will have a greater combined influence on the Er 3+ions.11As mentioned above,we suggested that the nonradiative decay of the NaYF 4:Yb,Er nanocrystals might be partially correlated with the influence between the surface defect,ligands,and surface Er 3+ions.As the ratio of the surface defects increases with decreasing size of the nanocrystals,the nonra-diative decay is enhanced.Also,as the surfaces of small truncated cubes are presumably deeply etched by the strongly coordinative OA ligands,the proximity of these high vibrational quanta will cause the red up-conversion pathway to be favored,especially due to nonradiative relaxation of the 4I 11/2to 4I 13/2level in the Er 3+ion.Therefore,the red 4F 9/2f 4I 15/2emission coming from the two-photon process is favored and f g/r decreases.Moreover,this suggestion is supported by the UC mechanism results of the core/shell nanostructures.As it is well known,the nonradiative centers existing on the surface of the nanocrystals will be eliminated mostly by the shielding of the shell,resulting in the nonradiative decay on the nanocrystals surfaces,obviously decreasing in the R -NaYF 4:Yb,Er@R -NaYF 4core/shell nanostructure,which enhances its f g/r and greatly enhances the whole I UC (Figures 5a,6d,and S3).Its saturation power is 659mW,much higher than those of R -NaYF 4:Yb,Er nanocrystals.3.2. -NaYF 4:Yb,Er and -NaYF 4:Yb,Er@R -NaYF 4Nanoc-rystals.The UC spectra of 20.2nm -NaYF 4:Yb,Er nanospheres,47.1nm ×45.8nm nanoprisms,and 185nm ×75nm -NaYF 4:Yb,Er nanoplates redispersed in cyclohexane (1wt %)under 980nm NIR excitation (50mW),shown in Figure 3b,reveal that the f g/r increases with the size of the nanocrystals (Figure 3c).Interestingly,the slopes for the green and red emission curves of the 20.2and 47.1nm -NaYF 4:Yb,Er nanocrystals are adjacent 2.0at low pumping power density (lower than 1.93W cm -2),displaying a simple two-photon mechanism,while becoming larger than 2.5at relatively high pumping power density (from 1.93to 12.2W cm -2),displaying a partially three-photon mechanism (Figure 8a,b),which are quite different from the related reports.For 185nm -NaYF 4:Yb,Er nanoplates,however,the slopes for green and red emission curves arenearlyFigure 7.Schematic illustration of the (a)two-photon and (b)three-photon mechanism UC process of Er 3+with Yb 3+as the promoter for NaYF 4:Yb,Er nanocrystals (left,red emission at 655nm;right,green emissions at 525and 543nm,and violet emission at 415nm).Highly Efficient Multicolor Up-Conversion Emissions J.Phys.Chem.C,Vol.111,No.37,200713727。
Astructurefordeoxyribosenucleicacid

Complexity: The sequence of bases on one strand of DNA determines the sequence on the potential strand through the principle of completeness This means that the order of bases on one strand is complete to the order on the other strand, with A pairing with T and G pairing with C
Structural constraint elements
The structural constraint elements of DNA include the nucleotides, which are made up of a phase group, a deoxyribose sugar, and a nitrogen base (A, T, G, or C)
In addition to the nucleotides, DNA also contains epigenetic marks such as methylation and acetylation, which can affect gene expression without altering the DNA sequence itself
- 1、下载文档前请自行甄别文档内容的完整性,平台不提供额外的编辑、内容补充、找答案等附加服务。
- 2、"仅部分预览"的文档,不可在线预览部分如存在完整性等问题,可反馈申请退款(可完整预览的文档不适用该条件!)。
- 3、如文档侵犯您的权益,请联系客服反馈,我们会尽快为您处理(人工客服工作时间:9:00-18:30)。
a rX iv:087.875v1[c ond-ma t.m trl-s ci]5J u l28Structural complexity in monodisperse systems of isotropic particles Michael Engel ∗and Hans-Rainer Trebin Institut f¨u r Theoretische und Angewandte Physik,Universit¨a t Stuttgart,Pfaffenwaldring 57,D-70550Stuttgart,Germany July 5,2008Abstract It has recently been shown that identical,isotropic particles can form complex crystals and quasicrystals.In order to understand the relation between the particle interaction and the structure,which it stabilizes,the phase behavior of a class of two-scale potentials is studied.In two dimensions,the phase diagram features many phases previously observed in experiment and simulation.The three-dimensional system includes the sigma phase with 30particles per unit cell,not grown in sim-ulations before,and an amorphous state,which we found impossible to crystallize in molecular dynamics.We suggest that the appearance of structural complexity in monodisperse systems is related to competing nearest neighbor distances and discuss implications of our result for the self-assembly of macromolecules.1Introduction When kept long enough at low temperatures,most systems develop long-range order.The easiest crystallization is expected for monodisperse systems,because only topological,butno additional chemical ordering is necessary.If the particles are isotropic,then a first reasoning suggests a preference to form simple,close-packed crystals,since this allows all of them to have the same,high first coordination numbers.A look at the periodic table reveals that indeed the ground states of most metals are bcc,fcc,or hcp [1].Similar simple crystals are found in mesoscopic or macroscopic systems like for example globular proteins[2],monodispersed colloids [3],and bubble rafts on liquid surfaces [4].In some of the systems above,quantum mechanics does not play an important role.Hence,it should in principle be possible to understand crystallization by using classicalpair interactions.For monodisperse systems there is only one type of interaction given by the shape of the potential function.Many common potentials are smooth and have a single minimum only.Simulations with these potentials usually lead to simple crystals. An example is the Lennard-Jones(LJ)potential.Nevertheless,the situation is not always that easy.Over the last years,more complex structures have been observed in experiments and simulations.A large part of work in this direction started after the discovery of quasicrystals in metallic alloys and was carried out with the aim to understand their formation.Another type of complex order are periodic crystals with large unit cells,so-called complex crystals.Whereas the lattice constants of a simple crystal are comparable to the range of the particle interactions,the unit cell of a complex crystal is stabilized indirectly,e.g.by geometric constraints.On the theoretical side,the obvious procedure to promote structural complexity is to use potentials with a more complicated radial dependence.It has been shown with double-minima potentials[5],oscillating potentials[6],and a repulsive barrier[7]that the energy of an icosahedral phase can be lower than the energy of a class of trial structures including close-packed phases.Surprisingly,even in the LJ system,a quasicrystal is unstable only by a small energy difference[8].These early works relied on general arguments and did not try to observe real crystals in simulations.Dzugutov was thefirst to actually grow a stable one-component dodecagonal quasicrystal from the melt[9],although it was later found to be only metastable[10].He used a LJ potential with an additional bump to disfavor the formation of simple crystals. Although no further work on other three-dimensional systems has been reported,there are many investigations focusing on two-dimensional systems,where computation and vi-sualization is easier.Thefirst such study applied a variation of the Dzugutov potential and found a planar dodecagonal quasicrystal[11].Furthermore,it was pointed out that a decagonal quasicrystal appears with a square-well[12]and a ramp potential[13].Experiments show that nature is quite ingenious in her way to assemble identical par-ticles.First of all,a few complex ground states of elemental metals are known to exist.A notable example isα-manganese,which has cubic symmetry with58atoms per unit cell.Thermodynamically stable high-temperature phases areβ-boron with105atoms and β-uranium with30atoms per unit cell[1].The latter is isostructural toσ-CrFe and known as the sigma phase.Furthermore,commensurately modulated phases are common at high pressures[14].Recently,different kinds of macromolecules have been observed to self-assemble into complex phases:(i)Under appropriate experimental conditions,tree-like molecules(den-drons)forming spherical micelles arrange to a dodecagonal quasicrystal[15].(ii)T-shaped molecules can be designed in such a way that they organize into liquid crystalline honey-combs[16].(iii)ABC-star polymers form cylindrical columns according to square-triangle quasicrystals,a two-dimensional version of the sigma phase[17],and other Archimedean tilings.How can structural complexity be understood from bottom-up?It is instructive to study the ground state for small portions of the system–more or less spherical clusters–as a function of the particle number N.The structure of small clusters(N<200in threedimensions,N<30in two dimensions)is often different from the bulk crystal[18].The reason is the competition between local lowest energy configurations and the necessity of continuation in space.For example in a monodisperse LJ system,icosahedral coordination occurs in small clusters[19],although the hcp phase is the lowest energy bulk crystal[20]. On the other hand,if small clusters already have simple structure,then the bulk phase will also be simple.A local order,which is incompatible with periodicity,is a necessary condition for structural complexity in the bulk.2Phase diagram for the two-dimensional system There are two mechanisms to introduce structural complexity:either by destabilizing simple phases or by stabilizing a complex phase.An example for the destabilization mech-anism is the Dzugutov potential.We adopt the stabilization mechanism,because it has the advantage that the choice of the target structure can be controlled more directly.The particles are assumed to interact with an isotropic two-scale potential.A simple ansatz is the Lennard-Jones-Gauss(LJG)potentialV(r)=1r6−ǫexp −(r−r0)2−4.5−4−3.5−3−2.5−2with a sigma crystal.Quickly,the whole system transformed into a single fcc phase.Hence, the sigma phase is also not stabilized entropically.The reason for its appearance in our simulations is the huge nucleation radius of fcc.The local order of sig is much closer to the melt.Further details will be reported elsewhere.In the case r0=1.4,all attempts to crystallize the system failed.One reason is the comparably low melting temperature:the ground state fcc melts around T=0.9.In various MD runs over several106steps in the range0.5≤T≤0.9no nucleation was observed.We conclude that the choice r0=1.4is interesting for studying a monatomic glass.Our results indicate that this LJG glass is more resistant against crystallization than the Dzugutov glass[27],which forms the dodecagonal quasicrystal rather quickly [9,10,28].4DiscussionHow does the LJG system compare to experiments?In metals,multi-body terms can only be neglected in afirst approximation.Effective potentials often have Friedel oscillations, which are mimicked by double-wells.It should be kept in mind thatfixed pair interactions between all atoms might be not applicable in complex phases,since the atoms are found in different local environments.Furthermore,the interaction is expected to change during crystallization.Isotropic pair potentials are more applicable to macromolecular self-assembly,because the molecules as a whole interact almost classically.It has been suggested[29]that their complex arrangements originates from the competition of two length scales,which appear due to soft repulsion and strong interpenetration.The micelles forming the dodecagonal quasicrystal in[15]have two natural length scales:the inner one corresponds to the back-bone of the dendrons and the outer one to the end of the tethered chains.Our simulations suggest that the ideal ratio of the scales is close to2:3.The cylindrical phases(T-shaped molecules and ABC-star polymers)can be understood as two-dimensional tilings with an effective interaction within the plane.Although not isotropic anymore,the particles still have two length scales.The tilings observed so far [30,31]consist of hexagons,squares,and triangles only.If it will be possible to stabilize pentagons or decagons,then the phases Pen/Pen2,Xi/Xi2might appear.Wefinish with a challenge:Can monodisperse icosahedral quasicrystals be grown in simulation or experiment?As of today,none have been found.5AcknowledgmentThis work was funded by the Deutsche Forschungsgemeinschaft(Tr154/24-1)and the Japan Society for the Promotion of Sciences.References[1]J.Donohue,The structure of the elements(Krieger pany,1982).[2]F.Rosenberger,P.G.Vekilov,M.Muschol,and B.R.Thomas,Nucleation and crys-tallization of globular proteins–what we know and what is missing,J.Cryst.Growth 168,1(1996).[3]Y.Xia,B.Gates,Y.Yin,and Y.Lu,Monodispersed colloidal spheres:Old materialswith new applications,Adv.Materials12,693(2000).[4]L.Bragg and J.F.Nye,A dynamical model of a crystal structure,Proc.R.Soc.London,Ser.A190,474(1947).[5]Z.Olami,Stable Dense Icosahedral Quasicrystals,Phys.Rev.Lett.65,2559(1990).[6]A.P.Smith,Stable one-component quasicrystals,Phys.Rev.B43,11635(1991).[7]A.R.Denton and H.L¨o wen,Stability of Colloidal Quasicrystals,Phys.Rev.Lett.81,469(1998).[8]J.Roth,R.Schilling,and H.-R.Trebin,Stability of monatomic and diatomic qua-sicrystals and the influence of noise,Phys.Rev.B41,2735(1990).[9]M.Dzugutov,Formation of a Dodecagonal Quasi-Crystalline Phase in a SimpleMonatomic liquid,Phys.Rev.Lett.70,2924(1993).[10]J.Roth and A.R.Denton,Solid-phase structures of the Dzugutov pair potential,Phys.Rev.E61,6845(2000).[11]A.Quandt and M.P.Teter,Formation of quasiperiodic patterns within a two-dimensional model system,Phys.Rev.B59,8586(1999).[12]A.Skibinsky,S.V.Buldyrev,A.Scala,S.Havlin,and H.E.Stanley,Quasicrystals ina Monodisperse System,Phys.Rev.E60,2664(1999).[13]E.A.Jagla,Phase behavior of a system of particles with core collapse,Phys.Rev.E58,1478(1998).[14]McMahon,M.I.and R.J.Nelmes,High-pressure structures and phase transformationsin elemental metals,Chem.Soc.Rev.35,943–963(2006).[15]Zeng,X.,G.Ungar,Y.Liu,V.Percec,A.E.Dulcey,and J.K.Hobbs,Supramoleculardendritic liquid quasicrystals,Nature428,157–160(2004).[16]Chen,B.,X.Zeng,U.Baumeister,G.Ungar,and C.Tschierske,Liquid CrystallineNetworks Composed of Pentagonal,Square,and Triangular Cylinders,Science307, 96–99(2005).[17]Hayashida,K.,T.Dotera, A.Takano,and Y.Matsushita,Polymeric quasicrys-tal:Mesoscopic quasicrystalline tiling in ABC Star polymers,Phys.Rev.Lett.98, 195502(2007).[18]Doye,J.P.K.and S.C.Hendy,On the structure of small lead clusters,Eur.Phys.J.D,22,99–107(2003).[19]Northby,J.A.,Structure and binding of Lennard-Jones clusters:13≤N≤147,J.Chem.Phys.,87,6166–6177(1987).[20]F.H.Stillinger,Lattice sum and their phase diagram implications for the classicalLennard-Jones model,J.Chem.Phys.115,5208(2001).[21]M.R.Sadr-Lahijany,A.Scala,S.V.Buldyrev,and H.E.Stanley,Liquid-State Anoma-lies and the Stell-Hammer Core-Softened Potential,Phys.Rev.Lett.81,4895(1998).[22]G.Franzese,G.Malescio,A.Skibinsky,S.V.Buldyrev,and H.E.Stanley,Genericmechanism for generating a liquid-liquid phase transition,Nature409,692(2001).[23]M.C.Rechtsman,F.Stillinger,and S.Torquato,Designed interaction potentials viainverse methods for self-assembly,Phys.Rev.E73,011406(2006).[24]M.Engel and H.-R.Trebin,Self-Assembly of Complex Crystals and Quasicrystals witha Double-Well Interaction Potential,Phys.Rev.Lett.98,225505(2007).[25]M.Engel,in preparation.[26]M.Engel and H.-R.Trebin,Stability of the decagonal quasicrystal in the Lennard-Jones-Gauss system,to appear in Phil.Mag.(2008).[27]M.Dzugutov,Glass formation in a simple monatomic liquid with icosahedral inherentlocal order,Phys.Rev.A46,R2984(1992).[28]A.S.Keys and S.C.Glotzer,How do Quasicrystals Grow?,Phys.Rev.Lett.99,235503(2007).[29]R.Lifshitz and H.Diamant,Soft quasicrystals–Why are they stable?,Phil.Mag.87,3021(2007).[30]Y.Matushita,Creation of Hierarchically Ordered Nanophase Structures in Block Poly-mers Having Various Competing Interactions,Macromolecules40,771(2007). [31]C.Tschierske,Liquid crystal engineering–new complex mesophase structures andtheir relations to polymer morphologies,nanoscale patterning and crystal engineering, Chem.Soc.Rev.26,1930(2007).。