Measuring the Efficiency of University Libraries Using Data Envelopment Analysis
performance evaluation理工英语4
performance evaluation理工英语4 Performance EvaluationIntroductionPerformance evaluation is a crucial process in assessing the effectiveness and efficiency of individuals, teams, or organizations. It involves the systematic assessment and measurement of performance against predetermined goals, objectives, and standards. This article aims to explore the concept of performance evaluation, its significance in various contexts, and the different methods used for evaluation.Defining Performance EvaluationPerformance evaluation is defined as the systematic process of assessing and reviewing an individual's or organization's performance in relation to established goals and objectives. It involves analyzing the quality, quantity, and timeliness of work, as well as the overall contribution towards achieving desired outcomes.Significance of Performance EvaluationPerformance evaluation plays a critical role in various contexts, including:1. Employee Performance Evaluation: In organizations, performance evaluation helps assess employees' job performance, identify areas for improvement, and determine reward and promotion opportunities. It provides valuable feedback and helps create a performance-driven culture.2. Team Performance Evaluation: Evaluating team performance is essential for identifying strengths and weaknesses, enhancing collaboration, and optimizing resources. It enables organizations to allocate tasks effectively, promote teamwork, and achieve collective goals.3. Organizational Performance Evaluation: Assessing the overall performance of an organization is essential for strategic planning, decision-making, and performance improvement. It helps identify areas requiring attention and enables organizations to align their objectives with key performance indicators (KPIs).Methods of Performance EvaluationThere are several methods used for performance evaluation, depending on the nature and context of evaluation:1. Rating Scales: This method involves using predefined scales to rate employees' performance against specific criteria. It provides a structured approach and simplifies the evaluation process. However, it can be subjective and may not capture the full extent of performance.2. 360-Degree Feedback: This method involves obtaining feedback from multiple sources, including supervisors, subordinates, peers, and customers. It provides a holistic view of an individual's performance and promotes a comprehensive understanding of strengths and areas for improvement.3. Objective Measurements: Objective measurements involve quantifying performance based on quantifiable data, such as sales figures, production output, or customer satisfaction ratings. This method provides a precise assessment of performance but may not capture qualitative aspects.4. Self-Assessment: Self-assessment encourages individuals to reflect on their performance and identify areas for improvement. It promotes self-awareness, accountability, and personal development. However, it may be biased and influenced by individuals' perceptions.5. Behavioral Observation: This method involves directly observing individuals' behavior in specific work-related situations. It provides valuable insights into work habits, interpersonal skills, and adherence to organizational values. However, it can be time-consuming and may not capture performance in all areas.ConclusionPerformance evaluation is a vital process for assessing and improving individual, team, and organizational performance. It helps organizations align their objectives, motivate employees, and ensure efficient resource allocation. By using appropriate evaluation methods, organizations can drive continuous improvement and achieve long-term success. It is essential for organizations to establish clear evaluation criteria, provide constructive feedback, and support employee development to maximize the benefits of performance evaluation.。
measuring the efficiency of decision making units

measuring the efficiency of decision making units 当今时代,决策单位的效率,经常被认为是一个机构、组织或者国家社会发展的重要指标。
新时代对提高决策单位效率的重要性也是日益凸显的。
它与其他重要行业一样,在影响国家经济增长和社会进步方面发挥着重要作用。
因此,加强决策单位的效率,是推进国家社会发展的重要措施。
决策单位效率的影响因素决策单位效率的影响因素有许多,其中,最重要的是决策者本身。
首先,决策者必须具有良好的工作态度,即在工作中持有积极态度,坚持不懈地完成工作,同时也要有担当作为,勇于承担责任,付出自己努力做好其他事情。
其次,决策者还应具有良好的行政能力,包括科学的决策思维、协调能力和预见性等,以便合理的决策行为,有效的结果。
此外,决策者还应具备良好的社交能力,包括沟通能力、调解能力和激励能力等,以便与同事交流沟通并有效的管理团队。
决策单位提高效率的方法首先,要建立高效的决策单位,应首先认识决策步骤,决策流程应简洁有效,考虑不足,审查对策,并加以优化。
其次,要重视决策过程中信息的重要性,要求决策者搜集、分析和使用信息,以便更好地决策。
此外,要加强与企业文化的结合,要求决策者所涉及的信息,符合企业文化、价值观和行业准则,培养企业文化的认同感。
最后,要建立决策绩效评估制度,以评估决策单位的效率,以便更好地管理和改进决策单位。
通过对决策单位的绩效进行定期评估,可以及时总结决策单位在制定政策方面的成果,以及做出新的改进和调整,以便提高决策单位的效率。
结论提高决策单位的效率具有重要的意义,以期实现国家社会发展的最终目标。
要提高决策单位效率,必须认真分析决策单位的影响因素,采取有效的措施,加强决策者的素质,重视信息的重要性,加强与企业文化的结合,建立决策绩效评估制度,并定期对决策单位的效率进行评估,以最大限度地提高其效率。
The Impacts of Governance and Education on Agricultural Efficiency
P rocedia - Social and Behavioral Sciences 58 ( 2012 ) 1158 – 11651877-0428 © 2012 Published by Elsevier Ltd. Selection and/or peer-review under responsibility of the 8th International Strategic Management Conference doi: 10.1016/j.sbspro.2012.09.10971Nizamettin Bayyurt. Tel.: +90-212-866-3300; fax: +90-212-866-3342. E-mail address : bayyurt@.tr.8th International Strategic Management ConferenceThe Impacts of Governance and Education on Agricultural Efficiency: An International AnalysisNizamettin Bayyurt abaFatih University, Istanbul, 34500, TurkeybFatih University,Institute of Social Sciences, Istanbul, 34500, TurkeyAbstractThe main aim of this study is to explain the interaction between governance, education and agricultural efficiency and to expose the impacts of governance and education on agricultural efficiency by a global context. Agricultural efficiency was measured as the ratio of agricultural outputs to agricultural inputs by Data Envelopment Analysisricultural land (km2), fertilizer (tons), the number of tractors, and labor. The output isproduced add value in agricultural area as USD currency. In this study, we combined DEA and a regression analysis in a worldwide context. For this purpose, in the first stage, we used DEA model (output-oriented, constant return to scale model) to analyze the agricultural efficiency of countries. And in the second stage, we used Panel Data Regression Analysis to find the effects of Worldwide Governance Indicators (WGI), education index, and countrytype. 2012 Published by Elsevier Ltd. Selection and/or peer-review under responsibility of The 8thInternational Strategic Management ConferenceKey words: Agricultural Efficiency; Governance; Data Envelopment Analysis; Panel Data Regression.1. IntroductionAgricultural productivity is one of the most important problems of the world. High food prices, climate change, civil wars, and the global financial crisis bring very serious problems such as food safety, hunger and malnutrition in the world. Due to its importance the United Nations 2015 is "fight against hunger and poverty".Available online at © 2012 Published by Elsevier Ltd. Selection and/or peer-review under responsibility of the 8th International StrategicManagement Conference1159 N izamettin Bayyurt and Senem Yılmaz / P rocedia - Social and Behavioral Sciences 58 ( 2012 )1158 – 1165 There are lots of studies in literature concerning agricultural productivity. And also in recent years ithas begun to realiGovernance has become a hot topic on the critical role it plays in determining social welfare. In 2003,the former Secretary General of the United Nations, Kofi Annan, reflects a growing consensus when hestates that good governance is perhaps the single most important factor in eradicating poverty and promoting development. Not surprisingly, governance as a term has progressed from obscurity to widespread usage, particularly in the last decade. Governance is about the more strategic aspects of steering: the larger decisions about direction and roles. That is, governance is not only about where to go,but also about who should be involved in deciding, and in what capacity [Graham et al. (2003)].For measures of the quality of governance, the World(WGI, such as Voice and Accountability, Political Stability and Absence of Violence, Government Effectiveness, Regulatory Quality, Rule of Law, and Control of Corruption) have been produced (WorldBank, 2011). Thesix WGI are recognized by many researchers as the most effective tools for assessing the status of governance in different countries.The main aim of this study is to explain the interaction between governance and agricultural productivity and to expose the impacts of governance on agricultural productivity by an internationalcontext using 64 countries over the period 2002-2008. For 64 countries, data are gathered from the WorldBank database.2.Literature ReviewThere are some researches that have been done on Agricultural Productivity Analysis in literature insome regions such as India [Dayal, E., 1984], Spanish Region [Millan and Aldaz, 1998], European Unionand Eastern Region [Serrao, A., 2003], MENA region [Jemma and Dhif, 2005], Nigeria [Fakayode et al. 2008], Vietnam [Minh and Long, 2008], etc.Lio and Liu (2008) analyzed 118 countries, whether a relationship exist between agricultural productivity and governance indicators for the years 1996, 1998, 2000 and 2002 in their study. Theyfound that when independent variables included in the model separately, the rule of law, control of corruption and government effectiveness increase agricultural productivity. When all of the variableswere included in the model at the same time while rule of law significantly increases the agricultural efficiency, political stability and voice and accountability have emerged a significant decrease in agricultural efficiency. In that study it is concluded that countries of which citizens respect to regulatoryquality have higher efficiency in agriculture. Low agricultural efficiency has been seen in more democratic countries is one the other important finding.Studies have been conducted on farmers' production differences of rich and poor countries. Why do farmers in poor countries cannot produce as much as farmers in rich countries? Schultz (1964) argues thatthe farmers in poor countries are poor, but effective. They are able to allocate their useful resources inrational ways, but do not reach high efficiency. The reason of this condition is explained as the inadequatesupply of modern agricultural technologies.Olson (1996) argued that due to the absence specialization and adequate institutional framework,many poor countries are only wasting money and resources. Individual rational behaviors can result withsocial inefficiencies because of institutional defects.Governance affects agricultural productivity through many channels. First, bad governance affectsefficiency of production by imposing unpredictable taxes (Camposs et al, 1999). Many countries withweak regulations and protectionist policies put high indirect taxes in agriculture. Krueger et al. (1991), in-1983, determined that the market-unfriendly macro-economic policies caused indirect taxes in agriculture by more than three times that of1160N izamettin Bayyurt and Senem Yılmaz / P rocedia - Social and Behavioral Sciences 58 ( 2012 )1158 – 1165 direct taxes. They also viewed that these policies have a deterrent effect in agricultural production. The governance infrastructure may affect agricultural performance in several ways. For instance, the government creates and maintains institutions that are crucial to the functioning of the market system. The protection of property rights and a judicial system administering justice and enforcing contracts strongly affect the incentives for production and investment. In addition, good governance supports a competitive and low-transaction-cost environment, which encourages agricultural innovation and stimulates the adoption of new technologies and forms of organization. The government acts as an important provider of rural infrastructure, public goods and services, and essential information for agriculture for farmers. The government also determines macroeconomic policies that affect both agricultural production and investment. In some countries, agricultural development has been seriously hindered by market-unfriendly policies that are characteristics of bad governance.The majority of individuals will lead the efforts for the protection of property in a country where the rule of law is weak. Most of the resources of a society where corruption is widespread devote to unearned incomes rather than productive activities. Agricultural Organizations, agricultural projects, irrigation units are usually encountered the most corrupted units in countries. Corruption is an obstacle on agricultural development (World Bank, 2007).However, in some cases, poor governance would cause high efficiency and good governance may result in low efficiency. The best known example for that is "Grease the Wheels" hypothesis. In countries with a slow and inefficient bureaucracy, corruption increases efficiency (Huntington, 1968). Political stability may not provide economic efficiency at all times. Because many reforms accelerating the economic efficiency, were made in times of crisis (Binswaeger and Deininger, 1997).3.Methodology3.1.Analytical TechniquesIn this study firstly, agricultural productivity as the ratio of agricultural outputs to agricultural inputs is measured by Data Envelopment Analysis (DEA) which is an efficiency measurement technique.2), fertility (tons), the number of tractorsoutput is produced add value in agricultural area as USD currency. gricultural efficiencies by using DEA (output-oriented, assuming constant returns to scale technology) [Charnes et. al., 1978]stage.3.2.Data Envelopment AnalysisData Envelopment Analysis (DEA) is a linear programming based nonparametric method for measuring the relative efficiency of Decision Making Units (DMUs). DEA creates a frontier function by comparing the ratios of multiple inputs to multiple outputs of similar units taken from the measured observations (Charnes, Cooper, and Rhodes 1978). It was first proposed by Charnes et al. (1978) based on the work of Farrell (1957). Since it was first proposed with CCR model by Charnes et al (1978), some extensions of the model have been developed. Over the years this methodology has been applied across a variety of sectors. An important advantage of DEA is that it is independent of the units measuring inputs and outputs allowing great flexibility in specifying the outputs/inputs to be studied. This is very important in the context of this study as the input and output variables have different units of measurement.Two models in DEA have been largely utilized in efficiency measurements (i) input-oriented and (ii) output-oriented models. With input-oriented DEA, the linear programming model is configured to1161N izamettin Bayyurt and Senem Yılmaz / P rocedia - Social and Behavioral Sciences 58 ( 2012 ) 1158 – 1165 determine how much the input use of a country could achieve the same output level. With this model, thepossible reduction in the levels of the inputs conditional to fixed outputs is found. In contrast, by output-oriented DEA, the linear programme is configured to determine a countryfixed inputs. In the context of this study, output based efficiency measures are suitable for the country level inputs in our data. It is important to use a DEA output based model to measure how much output can be produced from a given level of inputs. The envelopment surface will differ depending on the scale assumptions that describe the model. Two scale assumptions are generally employed: constant returns to scale (CRS), and variable returns to scale (VRS). The latter comprises both increasing and decreasing returns to scale. CRS reflects the fact that output will change by the same proportion as inputs are changed (e.g. doubling of all inputs will double output). VRS reflects the fact that production technology may demonstrate increasing, constant and decreasing returns to scale. In this study we use CRS model. An output oriented CCR DEA model in the literature, can be expressed below for m inputs, s outputs and n DMUs:rj i all for s s mi s x x n j s y y ts s s Max ri j i nj jijikr nj jrj krk mi si r ikk ,,0,,, (1)0,...,1,0.)(1111The DMU kkis 1. If it is less than 1, DMU k is inefficient. The efficiency frontier defined by the above CCR model reveals constant returns to scale (CRS) (Cook and Zhu, 2005). As an extension of CCR DEA model, Banker et al. (1984) referred as BCC model for variable returns to scale (VRS). 3.3. Data and VariablesData on 64 countries over the time period of 2002 through 2008 are used in the empirical analysis. Our country selection process depends on data availability in World Bank. The variables used in the first stage for DEA analysis given below. Output:Value added: Produced add value in agricultural area as USD currency, Inputs:Agricultural land (land): It is estimated by the arable land used for farming, forestry, and production activities. It is measured in km2.Fertilizers: It refers to the sum of pure weight of nitrogen, phosphate, potash, and complex fertilizers which were used for agriculture. It is measured in tons.1162N izamettin Bayyurt and Senem Yılmaz / P rocedia - Social and Behavioral Sciences 58 ( 2012 )1158 – 1165 Machinery (tractors): It is considered as capital input for the agricultural production activities such as plowing, irrigation, draining, harvesting, farm product processing, etc. It is measuredin one unit of tractor.Labor (labor): Participants in the economically active population in agriculture, i.e. employment in agriculture as a percentage of total employment.Since the 1990s, development researchers and practitioners have focused on good governance as both a means of achieving development and a development objective in itself. The World Bank has defined good governance as epitomized by predictable, open and enlightened policy making; a bureaucracy imbued with a professional ethos; an executive arm of government accountable for its actions; and a strong civil society participating in public affairs; and all behaving under the rule of law. In response to the growing demand for measures of the quality of governance, a number of aggregate governance indicators have been produced, such as the W ide Governance Indicators (WGI).The WGI rank countries with respect to six aspects of good governance: Voice and Accountability, Political Stability and Violence, Government Effectiveness, Rule of Law, Regulatory Quality, and Control of Corruption.The Worldwide Governance Indicators are based on several hundred variables produced by 25 different sources, including both public and private (commercial) data providers. The WGI cover 213 countries and territories (Thomas, 2008).The Worldwide Governance Indicators are defined as follows:Voice and accountability: captures perceptions of the extent to which a country's citizens are able to participate in selecting their government, as well as freedom of expression, freedom of association, and a free media.Political stability and absence of violence: measures the perceptions of the likelihood that the government will be destabilized or overthrown by unconstitutional or violent means, including domestic violence and terrorism.Government effectiveness: captures perceptions of the quality of public services, the quality of the civil service and the degree of its independence from political pressures, the quality of policy formulation and implementation, and the credibility of the government's commitment to such policies.Regulatory quality: captures perceptions of the ability of the government to formulate and implement sound policies and regulations that permit and promote private sector development.Rule of law: captures perceptions of the extent to which agents have confidence in and abide by the rules of society, and in particular the quality of contract enforcement, property rights, the police, and the courts, as well as the likelihood of crime and violence.Control of corruption: captures perceptions of the extent to which public power is exercised for private gain, including both petty and grand forms of corruption, as well as "capture" of the state by elites and private interests (see /governance/wgi/pdf/).primary, secondary and tertiary gross enrolment. In agricultural economics literature edon agricultural productivity have been discussed much. So we include education into our model together with the WGI., we constructed the following linear regression model: For the panel regression analysis dependent variable is country agricultural efficiency and independent variables are six governance indicators, country education index and country type (developed or developing). Analysis has been run for developing and developed countries separately as well.1163N izamettin Bayyurt and Senem Yılmaz / P rocedia - Social and Behavioral Sciences 58 ( 2012 ) 1158 – 1165 18765Re 43210t Edu Edu ContCorr RuleLaw gQual GovEffec PolStab Acc Voice efficiency t t tt t t t tDurbin-Watson result (d=0,60) shows us the regression has autocorrelation, and the VIF value (VIF>10) shows us the high multicollinearity between independent variables. For this reason, we have the following modifications for all the variables in the model like 1.t Efficiency t Efficiency t EfficiencyWhere 70.02/1dSo the model tested in the study isAdditionally, a second education term is used in the model that is Edu t-2 to reflect the lagged effect of education level of a country on agriculture.4. ResultsFixed Effect panel data analysis does not analyze the country type data since it is a categorical data. So for the overall data we run random effects panel regression (tablo 1). Last column of the table shows the results of this analysis. Regulatory quality, education and country type (developed or developing) are three significant variables in the model. Regulatory quality has a positive effect on agricultural efficiency. Education has negative coefficient which shows the negative relationship between efficiency and education. The result can be interpreted as when the education level becomes high, educated people tend on their own fields and to be away from agricultural activities. On the other hand, country type has positive coefficient which shows the positive relationship between efficiency and development level of a country. It is evident that the agricultural productivity in developing countries is lagging far behind that of the developed countries. This should be a result of cross-country heterogeneity in tangible assets and technologies. In developed countries, agricultural productivity is of importance and is supported by Research and Development studies and uses technological agriculture, whereas old-type agricultural activities is commonly used in others.The analyses were repeated for developed and developing countries separately (tablo 1). Hausman test specifies random effects model for eapursue in both models. But, while there is a positive effect of regulatory qualities on agricultural efficiency in developing countries, this is not validated in developed countries. This result indicates developing countries can increase their efficiencies in agriculture by ruling regulatory qualities, permitting and promoting the development of private sectors. None of the other variables in the model were found affecting significantly agricultural efficiency of countries28)1.(7)1.(6)1.(5)1Re .(Re 4)1.(3)1.(2)1.(101.t Edut Edu t Edu t ContCorr t ContCorr t RuleLaw t RuleLaw t gQual t gQual t GovEffec t GovEffec t PolStab t PolStab t Acc Voice t Acc Voice t Efficiency t Efficiency1164N izamettin Bayyurt and Senem Yılmaz / P rocedia - Social and Behavioral Sciences 58 ( 2012 )1158 – 1165Tablo1: Random-effects GLS regression resultsDeveloped Developing OverallB Z B Z B Z Constant 0.812 1.67 0.238 3.78 0.242 3.9 PolStab -0.055 -1.21 -0.007 -0.23 -0.019 -0.72 RegQual 0.046 0.93 0.095* 1.89 0.070* 1.76 RuleLaw 0.085 1.21 -0.033 -0.55 -0.044 -0.9 VoiceAcc -0.029 -0.71 -0.016 -0.34 -0.035 -0.99 Corruption 0.030 0.82 -0.071 -1.22 -0.027 -0.75 GovEffec 0.129 0.21 0.250 0.6 -0.021 -0.52Edu 0.049 1.25 -0.075 -1.58 0.250 0.73Edu t-2-0.802* -1.87 -0.242** -2.11 -0.247** -2.47 CountryType 0.082** 3.06 Number of obs 320 100 220Number of groups 64 20 44R-sq: within 0.0026 0.1689 0.0133between 0.257 0.0016 0.287overall 0.166 0.0222 0.178Wald chi2(9) 18.68 14.7 19.12Prob > chi2 0.028 0.0653 0.0142Hausman chi2 9.35 2.19prob>chi2 =0.32 Prob>chi2 =0.97**: significant at 5% , *: significant at 10%References[1] Binswanger,H.ve Deininger,K.Literature, 35, 1997, issue 4, ss.19582005, /a/aea/jeclit/v35y1997i4p1958-200August 2010.[2] Charnes, A., Cooper, W.W., Rhodes, E., (1978), Measuring the Efficiency of Decision Making Units, EJOR, Vol.2, pp.429-444.[3]Development, Vol.27, 1999, Issue:6, pp.10591067., /science/article/B6VC6-3X5H9TD-1B/2/15393eefc6f3cea1e6b5f5153c61c146, Retrieved: July 24, 2010.[4] Dayal, E.,(Mar., 1984), Agricultural Productivity in India: A Spatial Analysis, Annals of the Association of AmericanGeographers, Vol. 74, No. 1, pp. 98-123.[5]Fakayode, B.S., Omotesho, O.A., Tsoho, A.B., and Ajayi, P.D., (2008), An Economic Survey of Rural Infrastructures andAgricultural Productivity Profiles in Nigeria, European Journal of Social Sciences, Vol. 7, No. 2, pp. 158-171.1165 N izamettin Bayyurt and Senem Yılmaz / P rocedia - Social and Behavioral Sciences 58 ( 2012 )1158 – 1165[6] Fare, R., Grosskopf, S., Lindgren, B., Rots, P., (1992), Productivity changes in Swedish pharmacies 1980-1989: Anonparametric Malmquist approach, J. Product. Anal, Vol: 3, pp. 85-101.[7] Graham, J., Amos, B., Plumptre, T.,(20Governance, Ottawa, Canada./jspui/bitstream/123456789/11092/1/Principles%20for%20Good%20Governance%20in%20the%2021st%20Century.pdf?1 68[8]Huntington, S.P. Political Order in Changing Societies, New Haven, CT: Yale University Press, 1968.[9] /governance/wgi/pdf/va.pdf).[10]Jemma, M.M.B., and Dhif, M.A., (Dec 19-21, 2005), Agricultural Productivity and technological gap between MENA regionand some European countries: A Meta Frontier Approach, ERF(Economic Research Forum) 12th Annual Conference: Reform-Made to Last, Cairo,Egypt, Conference Paper No: 122005023.[11]Krueger,A., Schiff, M. ve Valdes, A., Political Economy of Agricultural Pricing Policy, Baltimore, MD: Johns HopkinsUniversity Press, 1991.[12]Lio, M. and Liu, M-C.,(2008), Governance and Agricultural Productivity: A Cross-National Analysis, Food Policy, Vol. 33, pp.504-512.[13]Governance, Vol. 6, 2004, issue 1, January, pp. 7590, /a/spr/ecogov/v6y2004i1p75-90.html[14]Millan, J.A. and Aldaz, N., (1998), Agricultural Productivity of the Spanish Regions: a Non-Parametric Malmquist Analysis,Applied Economics Vol.30, No.7, pp. 875-884.[15]Minh, N.K. and Long, G.T., (Sept., 2008), Measuring Agricultural Production Efficiency In Vietnam: An Application of DataEnvelopment Analysis (DEA), Vietnam Development Forum, Working Paper 0813,.vn/workingpapers/vdfwp0813.[16] cPerspectives, Vol.10, 1996, pp. 324, /jep/index.php[17]Serrao, A., (July 27-30, 2003), Agricultural Productivity Analysis of European Union and Eastern Regions, AmericanAgricultural Economics Association Annual Meeting, Montreal, Canada.[18]-/sebin/q/r/What%20Do%20the%20Worldwide%20Governance%20Indicators%20Measure.pdf。
英语托福试题及答案
英语托福试题及答案一、听力部分1. 问题:What is the main topic of the lecture?答案:The main topic of the lecture is the impact of industrialization on the environment.2. 问题:According to the professor, what is the primarycause of air pollution?答案:The primary cause of air pollution, according to the professor, is the burning of fossil fuels.3. 问题:What is the student's suggestion to reduce pollution?答案:The student suggests using renewable energy sourcesto reduce pollution.二、阅读部分1. 问题:What does the author argue about the role of technology in education?答案:The author argues that technology has the potentialto enhance learning experiences but also emphasizes the importance of its proper integration into the curriculum.2. 问题:What evidence does the author provide to support the benefits of technology in education?答案:The author provides evidence such as increasedstudent engagement, access to a wider range of resources, and the ability to personalize learning.3. 问题:What is the author's view on the challenges of integrating technology into education?答案:The author believes that challenges include the need for teacher training, the digital divide, and the risk of distraction.三、口语部分1. 问题:Describe a memorable event from your childhood.答案:One memorable event from my childhood was my first visit to a zoo, where I was amazed by the variety of animals and learned about their habitats.2. 问题:Why do you think it is important to learn a second language?答案:Learning a second language is important because it opens up opportunities for communication, broadens cultural understanding, and enhances cognitive abilities.3. 问题:What are some ways to improve your English speaking skills?答案:Some ways to improve English speaking skills include practicing with native speakers, joining language exchange groups, and using language learning apps.四、写作部分1. 问题:Do you agree or disagree with the following statement? University education should be free for all students.答案:[Your response should be a well-organized essay that includes an introduction, body paragraphs with supporting arguments, and a conclusion.]2. 问题:Some people believe that the government should spend more on art and culture, while others think that this money should be used for other public services. Discuss both views and give your opinion.答案:[Your response should be a well-organized essay that presents the arguments for both views, provides your own opinion, and includes a conclusion.]3. 问题:Describe a person who has had a significant influence on your life and explain why this person is important to you.答案:[Your response should be a descriptive essay that outlines the person's characteristics, the impact they have had on you, and the reasons for their significance.]。
DEA方法介绍ppt课件

5
DEA基本原理和模型
定义:
权系数
1 2 3 … j …n
v1
1 x11 x12 x13 … x1j … x1n
v2
2 x21 x22 x23 … x2j … x2n
. . . . . . ….
s.t.
r 1 m
1, j 1,2,n
vi xij
i 1
u 0, v 0
10
❖ 上述规划模型是一个非线性分式规划,使用Charnes- Cooper变化,令:
t
1 vT x0
,
w
tv,
tu
由t
1 vt x0
wt x0
1
可变成如下的线性规划模型P:
max hj0 T yo
(P)
s.t.wT x j T y j 0, j 1,2,n
22
5个DMU 1年资料 1个产出 2个投入
23
DEA主要应用领域
❖ 企业效率、银行效率、铁路运营、 地区FDI引进效 率、投资基金业绩、中国各地区健康生产效率、并 购效率、电力改革绩效、钢铁行业能源效率、中国 企业规模经济效率、科研机构规模效益、寿险公司 规模效率、中国全要素生产率估算与分析、农业创 新系统,各省劳动生产率、投资规划,方案评价、可 持续发展能力、环境效率、能源效率、空港效率、 煤炭采选效率等等
vi
.. .
.
. Xij … .
. . . . . . ….
vm
m xm1 xm2 xm3 … xmj … xmn
n个 决策单元 (DMU)
m种输入
电化学阻抗谱(eis)

电化学阻抗谱(eis)英文回答:Electrochemical impedance spectroscopy (EIS) is a powerful technique used to characterize the electrochemical properties of materials and interfaces. It involvesapplying a small-amplitude alternating current (AC) signalto an electrochemical cell and measuring the resulting current response. The impedance of the cell is then calculated as the ratio of the AC voltage to the AC current.EIS can be used to study a wide range ofelectrochemical phenomena, including:Corrosion: EIS can be used to study the corrosion behavior of metals and other materials. By measuring the impedance of a metal sample in a corrosive environment, itis possible to determine the rate of corrosion and the mechanisms involved.Battery performance: EIS can be used to study the performance of batteries. By measuring the impedance of a battery during charging and discharging, it is possible to determine the battery's capacity, efficiency, and self-discharge rate.Fuel cell performance: EIS can be used to study the performance of fuel cells. By measuring the impedance of a fuel cell during operation, it is possible to determine the cell's efficiency and power output.Sensor development: EIS can be used to develop new sensors. By measuring the impedance of a sensor in the presence of a target analyte, it is possible to determine the sensor's sensitivity and selectivity.EIS is a versatile technique that can be used to study a wide range of electrochemical phenomena. It is a powerful tool for understanding the behavior of materials and interfaces, and it has applications in a variety of fields, including corrosion science, battery research, fuel cell development, and sensor development.中文回答:电化学阻抗谱(EIS)是一种用于表征材料和界面的电化学性质的有效技术。
2024年高考第二次模拟考试英语(新高考Ⅰ卷01含听力)(考试版)A4
2024年高考英语第二次模拟考试高三英语(考试时间:120分钟试卷满分:150分)注意事项:1.答卷前,考生务必将自己的姓名、考生号等填写在答题卡和试卷指定位置上。
2.回答选择题时,选出每小题答案后,用铅笔把答题卡对应题目的答案标号涂黑。
如需改动,用橡皮擦干净后,再选涂其他答案标号。
回答非选择题时,将答案写在答题卡上。
写在本试卷上无效。
3.考试结束后,将本试卷和答题卡一并交回。
第一部分:听力(共两节,满分30 分)第一节(共5小题;每小题1.5分,满分7.5分)听下面5段对话。
每段对话后有一个小题,从题中所给的A、B、C三个选项中选出最佳选项。
听每段对话前,你将有时间阅读各个小题,每小题5秒钟;听完后,各小题将给出5秒钟的作答时间。
每段对话仅读一遍。
1.What does the woman suggest doing?A.Going on a diet. B.Having some ice cream. C.Seeing a play.2.What is the man doing?A.Showing a way. B.Asking for directions. C.Making an invitation. 3.Where does the conversation take place?A.In a theater. B.In a shop. C.In a children’s park.4.Why does the man call the woman?A.To buy a plane ticket. B.To book a hotel room. C.To leave a message for someone. 5.What are the speakers talking about?A.A teacher. B.A task. C.A movie.第二节(共15小题,每小题1.5分,满分22.5分)听下面 5 段对话或独白。
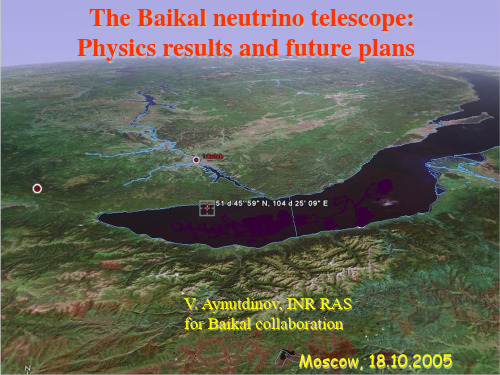
The Baikal Neutrino Telescope Physics Results and Future Plans贝加尔湖中微子望远镜物理结果与未来计划
- Prompt muons and neutrinos - Exotic HE muons
Search for exotic particles
- Magnetic monopoles
Atmospheric Neutrinos
372 Neutrinos in 1038 Days (1998-2003)
* Diffuse astroph.flux BBareckmg*srsohGuoRnwdBe:rcsofrrroemlated flux
h.e. downward muons
- HE atmospheric muons Final re*jecPtrionmopftbackground by „ener*gyExcuott“ic(Nhit)
NT-200 is used to watch the
volume below for cascades.
Diffuse Neutrino Flux
NT200 (1038 days)
DIFFUSE NEUTRgI=N1.O5 FLUX
(Ф ~ E-2, 10 TeV < E < 104 T2eV)
➢ Nizhny Novgorod State Technical University, Russia.
➢ St.Petersburg State Marine University, Russia.
➢ Kurchatov Institute, Moscow, Russia.
BAIKAL in CernCourier 7/8-2005
Outline:
Baikal
A N
N
Neutrino telescope NT200 (1998)
- 1、下载文档前请自行甄别文档内容的完整性,平台不提供额外的编辑、内容补充、找答案等附加服务。
- 2、"仅部分预览"的文档,不可在线预览部分如存在完整性等问题,可反馈申请退款(可完整预览的文档不适用该条件!)。
- 3、如文档侵犯您的权益,请联系客服反馈,我们会尽快为您处理(人工客服工作时间:9:00-18:30)。
Measuring the Efficiency of University Libraries Using DataEnvelopment AnalysisNevena Stancheva1, Vyara Angelova2University of Economics - Varna, BulgariaINFORUM 2004: 10th Conference on Professional Information ResourcesPrague, May 25-27, 2004AbstractData envelopment analysis is a non-parametric linear programming-based technique used for measuring the relative performance of organizational units where the presence of multiple inputs and outputs makes comparisons difficult. The aim of this paper is to apply Data envelopment analysis in order to measure the efficiency of University Libraries. T he panel data of five University Libraries for years 2002 and 2003 has been estimated. We identified six inputs and three outputs.The input variables are staff, print edition expenses, electronic edition expenses, building space, wages, library technical equipment. As output variables we estimated: number of registered readers, number of customers served, number of borrowed items. We found that three libraries form the efficiency frontier and the other two are inefficient for 2002 and 2003. A benchmark model is recommended for inefficient units.1. IntroductionBecause of their specific organization, University Libraries present certain difficulties in their efficiency evaluation. One recent approach to the evaluation of library efficiency is Data envelopment analysis (DEA). There have been a number of studies that applied DEA technique in order to assess the efficiency of different types of libraries. The most recent and accomplished is the paper of Shim3, where a comparison of DEA applications in libraries is put forward. Chen, Vitaliano and Shim examine academic libraries and Hammond, Sharma et al., and Worthington study the efficiency of public libraries. Easun is one of the firsts to apply DEA approach to evaluate school libraries. The aim of the present paper is to apply DEA to measure the efficiency of University Libraries, in the town of Varna, Bulgaria.2. Background of Data envelopment analysis (DEA)Data envelopment analysis (DEA), occasionally called frontier analysis, was first put forward by Charnes, Cooper and Rhodes in 1978. It is a linear programming-based technique for evaluating the performance of administrative units. Examples of such decision making units (DMUs) to which DEA has been applied are: banks, mutual founds, police stations, hospitals, tax offices, defense bases,insurance companies, 1Assistant Professor, Department of International Economic Relations, University of Economics-Varna e-mail: nevenasisi@abv.bg2 Bibliographer in Information Bibliographic Sector, University of Economics, Varna, e-mail:veripa@abv.bg3 Shim, W., Applying DEA Technique to Library Evaluation in Academic Research Libraries, Library Trends, Vol. 51, No 3,2003, p312-332schools, libraries and university departments. The method can successfully be applied to profit and non-profit making organizations, as well. DEA can handle multiple inputs and multiple outputs as opposed to other techniques such as ratio analysis or regression. The performance of a unit is evaluated by comparing its performance with the best performing units of the sample. Best performing units form the efficiency frontier. If the unit is not on the efficiency frontier it is considered to be inefficient. Hence, DEA is called frontier analysis. The aim of DEA is to quantify the distance to the efficient frontier for every DMU. The measure of performance is expressed in the form of efficiency score. After the evaluation of the relative efficiency of the present set of units, the analysis shows how inputs and outputs have to be changed in order to maximize the efficiency of the target DMU. DEA suggest the benchmark for each inefficient DMU at the level of its individual mix of inputs and outputs. The basic mathematical formulation of DEA has the following form:Maximizesubject to:And u rb, v ib >=e for all r,i (where r = 1,2,….,R and i = 1,2,…,N)WhereE b is the efficiency of any unit b;y rj is observed quantity of output r produced by unit j = 1,2,…,Nx ij is observed quantity of input I used by unit j = 1,2,…..,Nu rb is the weight (to be determined) given to output r by base unit bv ib is the weight (to be determined) given to input i by base unit be is a very small positive number.The u’s and v’s are the variables of the problem and are constrained to be greater than or equal to some small positive quantity e in order to avoid any input or output being totally ignored in determining efficiency. Charnes, Cooper and Rhodes proposed that each unit should be allowed to adopt the most favorable set of weights. The linear program solution technique will attempt to make the efficiency of the unit as large as possible. This search procedure will terminate when some of the efficiencies hit 1. DEA gives the weights of inputs and outputs leading to the calculated efficiency. The unit is efficient if the efficiency is equal to 1 and inefficient if it is less than 1. If represented graphically, for a given set of units, the efficient DMUs form the frontier that encloses the inefficient ones (the whole data set). Hence the name of analysis - data envelopment analysis. So, the efficient units use its mix of inputs better than inefficient ones or the efficient units manage to produce more outputs using a given mix of inputs. An input-oriented measure quantifies the input reduction, which is necessary for a DMU to become efficient, holding the output constant. Similary, an output-oriented measure quantifies the necessary output expansion, holding the input constant. A non-oriented measure quantifies the improvements when both inputs and outputs can be modified simultaneously. DEA suggest the creation of virtual unit B’for the inefficient unit B. B’ lies on the efficient frontier and is the best practice for unit B, if it aims to be efficient. The outputs and inputs of such a virtual unit are linear combinations of corresponding outputs and inputs of all other units. Thus DEA gives inputs/outputs targets for inefficient units – a benchmarks. The benchmark represents the peer group for the inefficient DMU.Since the technique was first proposed much theoretical and empirical work has been done. Many studies have been published dealing with applying DEA in real-world situations. The most important task is to determine the proper set of inputs and outputs for the observed units. Having reviewed literature on economics of hospitals, we concluded that the authors use tree categories of inputs: labour, supplies and capital. Labour is number of physicians, surgeons, nurses, technical staff; the suppliers are pharmaceutical and others; capital includes equipment, vehicles and building space. There are four types of outputs: inpatient days, outpatient visits, surgical operations, and live births. When DEA is undertook to evaluate bank branch efficiency inputs are: staff, interest costs, non-interest costs – expenses for rent, electricity, printing, advertising, post and telephone, repair and maintenance, etc. and the outputs are: number of transactions – deposits, loans, advances, mortgages etc. One of the strengths of DEA is the fact that inputs and outputs can be measured in different units for example dollars, square meters, number of staff, etc. The analysis can be run using one input and several outputs or vice versa estimating one output produced by multiple inputs. DEA can be run with a very small data set, as is the case in this paper.The first and probably most difficult step in efficiency evaluation is to decide which inputs and outputs data should be included.The literature on applying the DEA technique to library evaluation shows various schemes of inputs and outputs sets. The inputs usually are library staff (Chen 1997; Sharma, Leung and Zane 1999), weekly hours (Vitaliano 1998), volumes held (Shim 2000), book collection (Sharma, Leung and Zane 1999), material resources (Easun 1992). The most frequently used outputs are total circulation, reference transactions, library visits, interlibrary lending, online search and provision of information. The inputs or outputs that can be controlled by the DMUs are called “standard” or “discretionary” variables. “Nondiscretionary” variables are beyond the control of library administration, like population density, area size, resident population, nonresidential borrowers, and socioeconomic indices.2. Research Framework and Data SetWe have estimated the following six inputs: number of staff (Staff), printed edition expenses (ExPrIss), expenses on electronic databases and software (ExDB), building space (Scale), wages (Wages), technical equipment (MTB). We have defined three outputs: registеred readers (Reg), customers served (Serv), books borrowed (Borr). Nondiscretionary inputs and outputs are not included, because the Libraries are situated in the same town. Number of staff includes director, bibliographers and technical personnel of the library. Printed edition expenses are textbooks, dictionaries, periodicals (newspapers and journals) purchased by the University plus all printed editions given as a grant by foundations or projects; expenses on electronic databases and software include electronic editions, software packages and all Internet resources paid for by the University. Building space is the area used for reading-rooms, checking out service and the information sector. Wages are the gross sum for twelve months. Technical equipment includes computers, furniture, electric devices etc. The wages, technical equipment and expenses are measured in Bulgarian leva(1BGL=0,5EUR approximately). The building space is measured in square meters. All outputs are measured in numbers. DEA can handle inputs and outputs measured in different units.The data was analyzed using a program called EMS - Efficiency Measurement System version 1.3. The type of analysis is input oriented, with radial distance and constant returns of scale.We have collected the data by conducting an inquiry into five University Libraries in Varna, Bulgaria. As mentioned this fact minimizes the deviations caused by the environmental factors if the analysis is undertaken for DMUs located in different places. The estimated units are the Libraries in F1-Naval Academy, F2-Medical Academy, F3-Technical University, F4-University of Economics and F5-Free University. It is important to notice that the Universities are different types, but the Libraries’ reports have similar structure.Data for 2002DMU Staff{I} ExPrIss{I} ExDB{I} Scale{I} Wages{I} MTB{I} Serv{O} Reg{O} Borr{O} F1naval 413170 27002000179001405214120 170025520F2med 873520 126561700297009468214600 285030260F3techn 1120883 27002000413671540483065 5638142250F4ec 14102009 22282000772808456882250 6533304584F5free 86450 1700800460801720033818 520248701Results for 2002DMU Score Benchmarks ExPrIss- ExDB- MTB- Wages- Borr+ Serv+ F1naval 75,66% 3 (0,18) 5 (0,14) 5399,741335,565582,860 6214,795138,22F2med 70,41% 3 (0,51) 41207,097545,958876,30 41647,1527389,22F3techn 100,00% 2F4ec 100,00%0F5free 100,00% 1Data for 2003DMU Staff{I} ExPrIss{I} ExDB{I} Scale{I} Wages{I} MTB{I} Serv{O} Reg{O} Borr{O} F1naval 439511 24402000184801670212170 140635217F2med 877788 95201700307919468214930 239538690F3techn 1023165 35002000429174594273250 5139131005F4ec 1376444 283720007423412185986474 6702308276F5free 870230 222520004690012040035095 561250147Results for 2003DMU Score Benchmarks ExPrIss- ExDB- MTB- Wages- Borr+ Serv+ F1naval 75,26% 3 (0,27) 23397,07878,702165,7 625,197870,77F2med 64,96% 3 (0,47) 39733,594552,8540092,50 22364,0819207,72F3techn 100,00% 2F4ec 100,00%0F5free 100,00%03. ResultsAs can be seen from the table above, the Libraries in the Technical University, in the University of Economics and in the Free University form the efficiency frontier for the two observed periods. The Libraries in the Medical Academy and in the Naval Academy work less efficiently during the period. The Library in Naval Academy efficiency is 75,66% in year 2002 and 75,26% in year 2003. The efficiency of the Library in the Medical Academy decreases from 70,41% in year 2002 to 64,96% in year 2003. DEA recommend benchmarks for the inefficient Libraries. For the Library in Naval Academy it is advisable to follow the model of DMU F3 - the Technical University or that of F5 - the Free University in the year 2002. Numbers in brackets show the corresponding intensities. The Library in Technical University is pointed as a benchmark twice – for the Library in the Naval Academy and for the Library in the Medical Academy. The Library in the Free University is referenced once – in 2002 to be an additional benchmark for the Library in the Naval Academy.In order to improve their efficiency, the Libraries in the Naval Academy and in the Medical Academy can choose from the following variants or some mix of those:1. Year 2002 the Library in the Naval Academy could reduce its expenses onprinted editions by 5399,74 BGL, or reduce its electronic edition expenses by 1335,56 BGL.2. The Library in the Naval Academy could make some efforts to increase itsoutputs – the borrowed literature approximately by 6214 or customers served by 5138.3. The Library in the Naval Academy uses technical equipment, which could bedecreased by 5582,85 BGL.4. For year 2003 the Library in the Medical Academy could decrease itsexpenses on printed books and journals by 39733,59 BGL or it could reduce its expenses, made for electronic issues by 4552,85 BGL.5. The expenses on technical equipment of the Library in the Medical Academyexceed with 40092,5 BGL.6. If the Library in the Medical Academy aims to improve its relative efficiency,it has to increase the borrowed items by 22364 or to increase the number ofserved readers by approximately 19207.The analyses of 2002 for the Library in the Medical Academy and of 2003 for the Library in the Naval Academy are made in the same way.4. ConclusionsData envelopment analysis seams to be a useful tool for small data sets estimation. When the DEA was undertaken in a group of University Libraries in the same town, the problem with population density, area size, resident population and others environment details was overcome. The method identifies best practices for the purpose of benchmarking. The analysis provides the precise corrective figure for every output and input in order to improve the efficiency of an inefficient University Library. The library administration might choose a new strategy, based on the results of DEA, in order to operate in a more efficient mode. However, this does not meanthat the results are directly transformed into attainable recommendations. In our case we apply Data envelopment analysis, using nine variables, which are not related to internal service quality. This analysis estimates the relative operating efficiency of University Libraries irrespective of quality comparisons. The Libraries of the Medical Academy and the Naval Academy tend to have lower efficiency score due to special features and resources needed. Further research - focusing on quality and specific characteristics of the different Libraries - might provide interesting insights. References:Shim, W. (2003), Applying DEA technique to Library Evaluation in Academic Research Libraries, Library Trends, Vol. 51 (3), pp 312-332Dyson, R. G., Thanassoulis, E. & Boussofiane, A. (1990). A DEA (Data Envelopment Analysis) tutorial [Online]. Available from /∼bsrluCharnes, A., Cooper, W. W., & Rhodes, E. (1978). Measuring the efficiency of decision making units European Journal of Operations Research, 2, pp 429 444.Easun, M. S. (1992). Identifying efficiencies in resource management.: An application of data envelopment analysis to selected school libraries in California. Ph.D. Diss., University of California, Berkeley.Emrouznejad, A. (2001). An extensive bibliography of Data Envelopment Analysis (DEA), Volume I: Working Papers. Business School, University of Warwick, Coventry CV4 7AL, England. [Online]. Available from/bibliography/index.htm.Hammond, C. J. (2002). Efficiency in the provision of public services: A Data Envelopment Analysis of UK public library systems. Applied Economics, 34 (5), pp 649 - 657.Sharma, K. R., Leung, P., & Zane L. (1999). Performance measurement of Hawaii state public libraries: An application of Data Envelopment Analysis (DEA). Agricultural and Resource Economics Review, 28 (2), pp 190-198Vitaliano, D. F. (1998). Assessing public library efficiency using Data Envelopment Analysis. Annals of Public and Cooperative Economics, 69 (1), pp 107-122.Chen, T. Y. (1997). An evaluation of the relative performance of university libraries in Taipei. Library Review, 46 (3), pp 190 - 201.。