测序cheaper-sequencing
测序覆盖率低的原因
测序覆盖率低的原因英文回答:The low sequencing coverage can be attributed to several factors. One possible reason is the presence of repetitive sequences in the genome. Repetitive sequences are regions of DNA that are repeated multiple times, making it difficult for the sequencing technology to accurately determine the number of repeats. As a result, these regions may be poorly covered or completely missed during sequencing. For example, if a repetitive sequence is not fully covered by sequencing reads, it would result in a lower coverage for that particular region.Another reason for low sequencing coverage could be the presence of sequencing errors. Despite advancements in sequencing technologies, errors can still occur during the sequencing process. These errors can lead to incorrect base calls, resulting in low quality reads. Low quality reads are more likely to be discarded during the data processingsteps, leading to a lower overall coverage. For instance,if a sequencing error occurs in a region that is criticalfor the coverage calculation, it could significantly impact the final coverage value.Furthermore, the presence of GC-rich or AT-rich regions in the genome can also contribute to low coverage. These regions have a high percentage of guanine-cytosine (GC) or adenine-thymine (AT) base pairs, respectively. GC-rich regions can be challenging for sequencing technologies asthe high GC content can cause issues with DNA denaturation and amplification. Similarly, AT-rich regions can bedifficult to sequence due to the weaker hydrogen bonding between adenine and thymine. As a result, these regions may have lower coverage compared to other regions in the genome.In addition, low sequencing coverage can be caused by inadequate library preparation. Library preparation is a crucial step in the sequencing workflow, and any errors or inconsistencies during this process can result in low coverage. For example, if the DNA fragments are notproperly fragmented or size-selected, it can lead to biasedrepresentation of certain regions in the library. This bias can then translate into lower coverage for those regions during sequencing.Lastly, technical limitations of the sequencing platform can also contribute to low coverage. Different sequencing platforms have different capabilities and limitations, and some platforms may inherently have lower coverage compared to others. For instance, certain sequencing platforms may have limitations in read length or throughput, which can impact the overall coverage. Additionally, the sequencing depth or number of reads generated per sample can also affect the coverage. If the sequencing depth is not sufficient, it can result in lower coverage for the target regions.中文回答:测序覆盖率低的原因有多种。
第三代测序技术(单分子实时DNA测序)与第二代测序技术(高通量测序技术)简介
第三代测序技术(单分子实时DNA测序)与第二代测序技术(高通量测序技术)简介第三代测序技术(单分子实时DNA测序)与第二代测序技术(高通量测序技术)简介第三代测序技术简介如果有人告诉你用显微镜实时观测单分子DNA聚合酶复制DNA,并用它来测序,你一定会认为他异想天开,没有一点生物的sense。
我最初就是这样认为的,然而它不仅可以实现,而且已经实现了~这个就是被称为第三代的测序技术,Pacific Biosciences公司推出的“Single Molecule Real Time(SMRT) DNA Sequencing”(单分子实时DNA测序)。
我有幸在NIH听到了这个技术发明人Stephen Turner博士的讲座,根据自己粗浅的理解记录整理一下。
要实现单分子实时测序,有三个关键的技术。
第一个是荧光标记的脱氧核苷酸。
显微镜现在再厉害,也不可能真的实时看到“单分子”。
但是它可以实时记录荧光的强度变化。
当荧光标记的脱氧核苷酸被掺入DNA链的时候,它的荧光就同时能在DNA链上探测到。
当它与DNA链形成化学键的时候,它的荧光基团就被DNA聚合酶切除,荧光消失。
这种荧光标记的脱氧核苷酸不会影响DNA聚合酶的活性,并且在荧光被切除之后,合成的DNA链和天然的DNA链完全一样。
第二个是纳米微孔。
因为在显微镜实时记录DNA链上的荧光的时候,DNA链周围的众多的荧光标记的脱氧核苷酸形成了非常强大的荧光背景。
这种强大的荧光背景使单分子的荧光探测成为不可能。
Pacific Biosciences公司发明了一种直径只有几十纳米的纳米孔[zero-mode waveguides (ZMWs)],单分子的DNA聚合酶被固定在这个孔内。
在这么小的孔内,DNA链周围的荧光标记的脱氧核苷酸有限,而且由于A,T,C,G这四种荧光标记的脱氧核苷酸非常快速地从外面进入到孔内又出去,它们形成了非常稳定的背景荧光信号。
而当某一种荧光标记的脱氧核苷酸被掺入到DNA链时,这种特定颜色的荧光会持续一小段时间,直到新的化学键形成,荧光基团被DNA聚合酶切除为止(见图)。
DNA的质量监测通常有两个方法

2)DNA的质量监测通常有两个方法:首先OD260/OD280比值应该在1.8左右(1.7-1.9),否则意味着DNA样品中存在大量的蛋白质或RNA污染。
其次,琼脂糖电泳分析时应主要以超螺旋条带为主。
最多不超过三条带(分别为超螺旋DNA,线性化DNA和环状DNA)。
否则意味质粒DNA的质量不高,应该重新制备。
2.限制性内切酶的活性1)限制性内切酶一般需要低温保存,而且反复的升降温过程对酶活性的损害很明显。
因而为了确保在有效期内的限制性内切酶不会失活,限制性内切酶的日常保存和使用应当很小。
2)建议购买具有保温功能的冻存盒保存限制性内切酶(-20度),而且取用限制性内切酶时,也应该使用具有保温功能的冻存盒,尽量防止酶的温度反复出现大的波动。
3.限制性内切酶的用量1)限制性内切酶的单位定义通常为:在合适的温度下,完全消化1ugDNA底物所需的酶量定义为一个单位。
2)在这个单位定义中,有几个不确定因素:首先是底物,不同的酶单位定义是选择的底物可能不同(常用的几个底物DNA包括:Lambda DNA ,AD2 DNA 和一些质粒DNA);第二个不确定因素是限制性内切酶在底物DNA上的酶切位点的个数。
由于单位定义中要求完全消化,因而底物上某个酶的酶切位点的个数的多少,就直接影响了该酶的单位定义。
3)因而,在进行酶切时,用1ul酶(一般10IU/ul)消化1ugDNA的通常做法是很不科学的,这也导致在实际工作中,大家要进行多次预实验才能确定最合适酶切条件。
4)以前,我推荐了一个在线的双酶切设计软件,double digestion designer, 可以精确地计算酶切时的限制性内切酶的用量。
使用中,能够注意到,用来进行双酶切的两个酶的用量有时竟然相差近20倍(EcoRI + NheI),而且发现,小片段PCR产物(100-500bp)进行酶切时,需要的酶量比质粒DNA酶切时用量多10倍以上。
5)该软件目前可以免费使用,用户名和密码都是test。
高通量测序 名词解释
高通量测序基础知识汇总一代测序技术:即传统的Sanger测序法,Sanger法是根据核苷酸在待定序列模板上的引物点开始,随机在某一个特定的碱基处终止,并且在每个碱基后面进行荧光标记,产生以A、T、C、G结束的四组不同长度的一系列核苷酸,每一次序列测定由一套四个单独的反应构成,每个反应含有所有四种脱氧核苷酸三磷酸(dNTP),并混入限量的一种不同的双脱氧核苷三磷酸(ddNTP)。
由于ddNTP缺乏延伸所需要的3-OH 基团,使延长的寡聚核苷酸选择性地在G、A、T或C处终止,使反应得到一组长几百至几千碱基的链终止产物。
它们具有共同的起始点,但终止在不同的的核苷酸上,可通过高分辨率变性凝胶电泳分离大小不同的片段,通过检测得到DNA碱基序列。
二代测序技术:next generation sequencing(NGS)又称为高通量测序技术,与传统测序相比,二代测序技术可以一次对几十万到几百万条核酸分子同时进行序列测定,从而使得对一个物种的转录组和基因组进行细致全貌的分析成为可能,所以又被称为深度测序(Deep sequencing)。
NGS主要的平台有Roche(454 & 454+),Illumina(HiSeq 2000/2500、GA IIx、MiSeq),ABI SOLiD等。
基因:Gene,是遗传的物质基础,是DNA或RNA分子上具有遗传信息的特定核苷酸序列。
基因通过复制把遗传信息传递给下一代,使后代出现与亲代相似的性状。
DNA:Deoxyribonucleic acid,脱氧核糖核酸,一个脱氧核苷酸分子由三部分组成:含氮碱基、脱氧核糖、磷酸。
脱氧核糖核酸通过3',5'-磷酸二酯键按一定的顺序彼此相连构成长链,即DNA链,DNA链上特定的核苷酸序列包含有生物的遗传信息,是绝大部分生物遗传信息的载体。
RNA:Ribonucleic Acid,,核糖核酸,一个核糖核苷酸分子由碱基,核糖和磷酸构成。
htseq进行counts计算的原理
htseq进行counts计算的原理
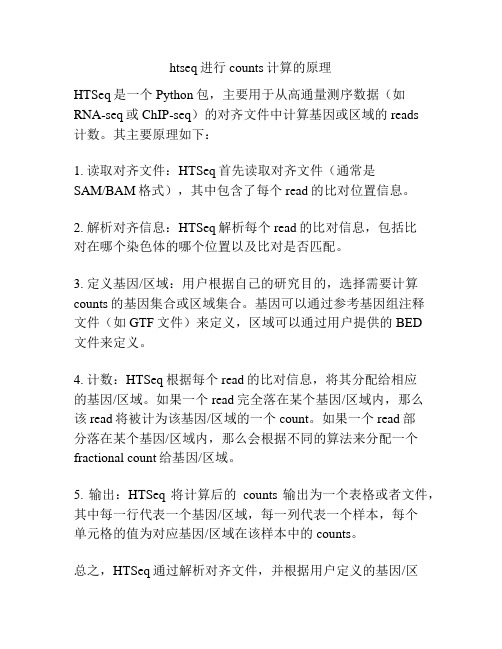
HTSeq是一个Python包,主要用于从高通量测序数据(如
RNA-seq或ChIP-seq)的对齐文件中计算基因或区域的reads
计数。
其主要原理如下:
1. 读取对齐文件:HTSeq首先读取对齐文件(通常是
SAM/BAM格式),其中包含了每个read的比对位置信息。
2. 解析对齐信息:HTSeq解析每个read的比对信息,包括比
对在哪个染色体的哪个位置以及比对是否匹配。
3. 定义基因/区域:用户根据自己的研究目的,选择需要计算counts的基因集合或区域集合。
基因可以通过参考基因组注释
文件(如GTF文件)来定义,区域可以通过用户提供的BED
文件来定义。
4. 计数:HTSeq根据每个read的比对信息,将其分配给相应
的基因/区域。
如果一个read完全落在某个基因/区域内,那么
该read将被计为该基因/区域的一个count。
如果一个read部
分落在某个基因/区域内,那么会根据不同的算法来分配一个fractional count给基因/区域。
5. 输出:HTSeq将计算后的counts输出为一个表格或者文件,其中每一行代表一个基因/区域,每一列代表一个样本,每个
单元格的值为对应基因/区域在该样本中的counts。
总之,HTSeq通过解析对齐文件,并根据用户定义的基因/区
域来计算reads的counts,从而得到了不同基因/区域在样本中的表达水平。
这些counts可以用于后续的差异表达分析、基因表达分析等。
单细胞测序技术——从基因表达到突变检测

单细胞测序技术——从基因表达到突变检测随着生命科学技术的迅猛发展,测序技术也随之不断更新。
在最新的测序技术中,单细胞测序技术可以说是一种非常重要的技术。
与传统的批量测序技术不同,单细胞测序技术可以对单个细胞进行测序,获得单细胞水平的信息。
本文将从基因表达到突变检测这两个方面来介绍单细胞测序技术。
一、基因表达测定基因是遗传信息的基本单位,它通过转录成为 RNA 分子,进而被翻译成蛋白质,来完成对生物体的调控和表达。
在传统的批量测序技术中,大量细胞混合在一起,使得基因表达数据存在种种噪音和偏差,难以精确地研究不同类型细胞间的差异性。
而单细胞测序技术可以获得单个细胞的基因表达信息,从而解决以上问题。
目前,单细胞测序技术主要分为两种:基于微流控芯片的技术和基于膜片染色技术的技术。
前者是通过微流控芯片将单个细胞捕获进氢氧化盐水滴中,再分别分装到独立反应室,分别应用PCR扩增等方法进行基因序列测序。
后者则是将单个细胞分别分装到涂在玻璃片上的单元中,溶解后进行反应扩增等。
基因表达测定的数据分析主要有两大类:one-sample analysis 和differential analysis。
one-sample analysis是对单个细胞进行基因表达谱的分析,主要是绘制某个基因的表达、不均匀性和遗传标记等。
differential analysis则是通过比较不同的细胞,寻找它们之间的差异,如基因型、表达谱、开关元件、微环境等。
二、突变检测癌症是基因突变的结果,而单个单个细胞的突变程度不同,所以对单个单个细胞进行基因突变测序是解决人类癌症研究难题的重要途径之一。
此外,单细胞测序技术还可以帮助研究器官发育,了解体内细胞的分化及神经科学等诸多学科。
单细胞测序技术的突变检测可以分为 Point mutation、indel mutation和 Structural variation 三大类。
其中 Point mutation包括Base substitution和tandem repeat expansion;indel mutation 包括deletion、insertion、mini-satellite variation和Complex variations;Structural variation 包括 Copy number variation和Inversion等。
《二代测序简介》PPT课件

陈竺,日本血吸虫基因组
.
10
Next-Gen Platforms
GA – Illumina/Solexa
SBS with reversible fluorescent terminators
GS FLX – Roche/454 Life Sciences
SBS through pyrosequencing
• 宏基因组学(Metagenomics) • 泛基因组学(Pangenomics)
.
3
3
Key Genomics Technologies
1975 - Southern DNA hybridization technique
1977 - Sanger’s chain-termination and Maxam、Gilbert’s
.
6
Limitation of 1st Gen Sequencer
Throughput
Time-consuming separation of chainterminated fragments
Hard to produce massively parallel system based electrophoretic separation
Template DNA immobilized on primer coated capture beads thru hybridization (1 fragment on each bead)
Thermocyle to amplify (forward primer is biotinylated)
– Asymetric Adaptors ligated (one biotinylated)
测序基础知识--整理

测序基础知识--整理测序: 如何计算测序深度,或产出的数据量? 10的9次⽅=1G 如果测序的read是pair-end的、且每条read长150bp,则,平均测序深度为=(reads数×150bp×2)/(3*10的10次⽅)。
即:测序得到的碱基总数/⼈类基因组的碱基对数=平均测序深度。
⽐如,我想得到30x的测序数据,那么需要的数据量是90G的数据。
(此处,还不甚了解,我觉得应该是900G的数据啊) (⼈类基因组有30亿个碱基对(3*10的10次⽅)) 测序错误率:⼀般选择的阀值是10的-3次⽅,即测序错误率是0.001。
(PCR的错误率是10的-6次⽅) coverage与depth的概念:coverage指的是测序数据覆盖的⼈类基因组的碱基数。
depth指的是平均每个碱基被测序read覆盖的次数(即被测到的次数)。
index的含义:index⽤来区分不同的样本。
单端index共6个碱基,排列组合,共4的6次⽅个碱基,⽆法区分66个样本。
故,需要采⽤双端index。
双端index,分为i5和i7端。
i5端有8个碱基,i7端有12个碱基。
测序的cycle:⼀个cycle读取⼀个碱基。
也称为:base call。
若有index序列,则测序仪会多读⼏个cycle。
⽂库构建: 加Y型adapter的⽬的:1)区分read1和read2,即DNA链的两端;2)防⽌adapter⾃连。
Y型adapter不是互补的,两端的序列不⼀致。
10ng的DNA就可以建库,测序。
WGS: 全基因组的重复率是20%,⽤picard统计duplicate的⼯具(原理:map位置相同,cigar值相同)。
建库流程:提取全基因组,打断、末端不平加A,加adapter,PCR扩增,测序。
区别cfDNA的靶向建库:cfDNA已经是断裂的⽚段,所以不需要打断、末端补平加A的步骤,只要提取游离DNA后,⽤引物扩增即可。
- 1、下载文档前请自行甄别文档内容的完整性,平台不提供额外的编辑、内容补充、找答案等附加服务。
- 2、"仅部分预览"的文档,不可在线预览部分如存在完整性等问题,可反馈申请退款(可完整预览的文档不适用该条件!)。
- 3、如文档侵犯您的权益,请联系客服反馈,我们会尽快为您处理(人工客服工作时间:9:00-18:30)。
Gane Ka-Shu Wong: Beijing Institute of Genomics and The University of Washington Genome Center
Eric Lander
·complete gene expression profile, as well as other appropriate technologies
analysis of healthy individuals to identify targets for drug intervention
2. 3.
to predict the future of science, find where the money is going
TCGA: the cancer genome atlas
/index.asp
GOAL: Identify all genomic alterations significantly associated with all major cancers. i) create a large collection of appropriate clinically annotated samples from all major types of cancer ii) completely characterize each sample in terms of: ·all regions of genomic loss or amplification ·all mutations in the coding regions of all human genes ·all chromosomal rearrangements ·all regions of aberrant methylation
RNA expression analysis may go back to counting tags (end of arrays)
hypothetical cost estimate if Solexa can deliver as promised Solexa’s 1G Analyzer will sequence one billion bp at $1000 to $3000 per run equivalent to 40 million tags for expression analysis assuming 25 bp per read an experiment with one million tags per sample will cost as little as $25 to $75 digital techniques are free of hybridization related problems
40% reduction in LDL cholesterol from nonsense mutations in PCSK9
Distribution of plasma LDL-C levels in African American subjects without (upper) and with (lower) a nonsense mutation in PCSK9. These mutations occur at low frequencies (combined frequency 2%) in African Americans and at rare frequencies in European Americans (<0.1%). Cohen JC, … Hobbs HH (2005) Nat Genet 37: 161.
predictions are difficult, especially when it comes to the future (Niels Bohr)
1. More sequencing: tree of life, phylogenetic shadowing to identify species-specific functional elements, metagenomics of difficult to culture microbes, paleogenomics of extinct species, genetic variation (especially in biomedical context), massively parallel signature sequencing, mapping regions under selective sweep, and the cancer genome atlas Computational biology: bigger machines, better algorithms Screening facility: ‘big pharma’ to academia and back
but read lengths are shorter and data qualities are lower
evolutionary
drops of water in an emulsion are independent reaction vessels
Dressman D, … Vogelstein B (2003) Proc Natl Acad Sci USA 100: 8817 each bead captures a single molecule; PCR eliminates need for cloning
OPTION 1 disease gene mutation loss-offunction found in blood injectable protein study pathway ??? gain-offunction loss-offunction OPTION 2 healthy gene mutation
revolutionary
2005: current costs on capillary sequencers is about $30 million or a penny per finished base
2006: Solexa will do 15x in 3 months for only $100K
FPGA based supercomputer dedicated to sequence alignments
Dawning 4000H designed and built in partnership with Institute of Computing Technology at the Chinese Academy of Sciences
the human genome project was NOT just about DNA sequencing
we did not invent DNA sequencing; we simply made it cheaper
the essence of the human genome project and it’s offspring the human hapmap project was really about improving the core technologies of genetics: sequencing, genotyping
mapping of selective sweep for high altitude fitness in Tibetans
chromosomes from different individuals
adaptive allele
candidates: HIF-1 and NO pathway
physonect siphonophore, Marrus sp., photographed during NOAA Arctic Hidden Ocean expedition in support of the Census of Marine Life ©2005
sequencing of the genomes for all major evolutionary lineages
chicken SNPs corresponding to mutations in human disease genes
2.83 million variant sites chicken genome 1065 human genes taken from OMIM 995 chicken orthologs chicken SNP map 520 cSNPs in 245 genes 6 cSNPs in disease site 5 cSNPs tolerant in SIFT 1 cSNP intolerant in SIFT
Shields R (2006) MIAME, we have a problem. Trends Genet 22: 65-66
biological diversity is a wondrous thing
NIH will only fund genomes of obvious importance to human research
philanthropy agency with an interest in biodiversity
corporations developing ever cheaper technology
consortium organized by James Rothman (Columbia) needs brute force computing power and expertise to assemble data