雅思小作文线形图句式与词汇
(完整版)雅思小作文必背词汇
meanwhile
at the same time
minimally
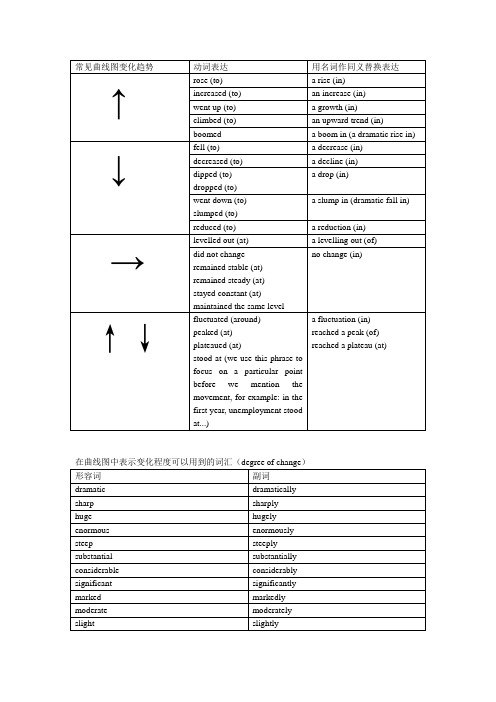
在曲线图中表示变化程度可以用到的词汇(speed of change)
形容词
副词
rapid
rapidly
quick
quickly
swift
swiftly
sudden
suddenly
steady
steadily
gradual
gradually
slow
slowly
描述扇形图常用句
The highest
常见曲线图变化趋势
动词表达
用名词作同义替换表达
↑
rose (to)
a rise (in)
increased (to)
an increase (in)
went up (to)
a growth (in)
climbed (to)
an upward trend (in)
boomed
a boom in (a dramatic rise in)
no change (in)
↑↓
fluctuated (around)
peaked (at)
plateaued (at)
stood at (we use this phrase to focus on a particular point before we mention the movement, for example: in the first year, unemployment stood at...)
a reduction (in)
→
levelled out (at)
作文范文之雅思作文线状图
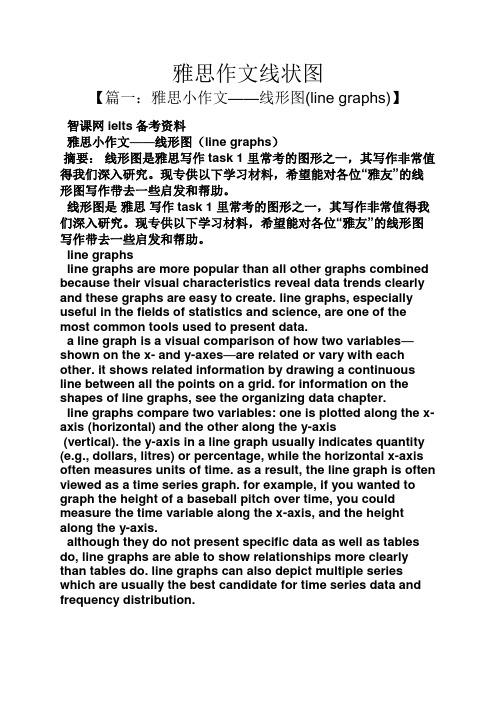
雅思作文线状图【篇一:雅思小作文——线形图(line graphs)】智课网ielts备考资料雅思小作文——线形图(line graphs)摘要:线形图是雅思写作task 1 里常考的图形之一,其写作非常值得我们深入研究。
现专供以下学习材料,希望能对各位“雅友”的线形图写作带去一些启发和帮助。
线形图是雅思写作task 1 里常考的图形之一,其写作非常值得我们深入研究。
现专供以下学习材料,希望能对各位“雅友”的线形图写作带去一些启发和帮助。
line graphsline graphs are more popular than all other graphs combined because their visual characteristics reveal data trends clearly and these graphs are easy to create. line graphs, especially useful in the fields of statistics and science, are one of the most common tools used to present data.a line graph is a visual comparison of how two variables—shown on the x- and y-axes—are related or vary with each other. it shows related information by drawing a continuous line between all the points on a grid. for information on the shapes of line graphs, see the organizing data chapter.line graphs compare two variables: one is plotted along the x-axis (horizontal) and the other along the y-axis(vertical). the y-axis in a line graph usually indicates quantity (e.g., dollars, litres) or percentage, while the horizontal x-axis often measures units of time. as a result, the line graph is often viewed as a time series graph. for example, if you wanted to graph the height of a baseball pitch over time, you could measure the time variable along the x-axis, and the height along the y-axis.although they do not present specific data as well as tables do, line graphs are able to show relationships more clearly than tables do. line graphs can also depict multiple series which are usually the best candidate for time series data and frequency distribution.e graphs share a similar purpose. the column graph, however, reveals a change in magnitude, whereas the line graph is used to show a change in direction.in summary, line graphsshow specific values of data wellreveal trends and relationships between datacompare trends in different groups of a variablegraphs can give a distorted image of the data. if inconsistent scales on the axes of a line graph force data to appear in a certain way, then a graph can even reveal a trend that is entirely different from the one intended. this means that the intervals between adjacent points along the axis may be dissimilar, or that the same data charted in two graphs using different scales will appear different.example 1 – plotting a trend over timefigure 1 shows one obvious trend, the fluctuation in the labour force from january to july. the number of students at andrews high school who are members of the labour force is scaled using intervals on the y-axis, while the time variable is plotted on the x-axis.the number of students participating in the labour force was 252 in january, 252 in february, 255 in march, 256 in april, 282 in may, 290 in june and 319 in july. when examined further, the graph indicates that the labour forceparticipation of these students was at a plateau for the first four months covered by the graph (january to april), and for the next three months (may to july) the number increased steadily. figure 1. labour force participation in andrews high schoolexample 2 – comparing two related variablesfigure 2 is a single line graph comparing two items; in this instance, time is not a factor. the graph compares thenumber of dollars donated by the age of the donors. according to the trend in the graph, the older the donor, the more money he or she donates. the 17-year-old donors donate, on average, $84. for the 19-year-olds, the average donation increased by $26 to make the average donation of that age group $110.figure 2. average number of dollars donated at evergreen high school, by age of donorexample 3 – using correct scalewhen drawing a line, it is important that you use the correct scale. otherwise, the lines shape can give readers the wrong impression about the data. compare figure 3 with figure 4:figure 3. number of guilty crime offenders, grishamvillefigure 4. number of guilty crime offenders, grishamvilleusing a scale of 350 to 430 (figure 3) focuses on a small range of values. it does not accurately depict the trend in guilty crime offenders between january and may since it exaggerates that trend and does not relate it to the bigger picture. however, choosing a scale of 0 to 450 (figure 4) better displays how small the decline in the number of guilty crime offenders really was.example 4 – multiple line graphsa multiple line graph can effectively compare similar items over the same period of time (figure 5).figure 5. cell phone use in anytowne, 1996 to 2002figure 5 is an example of a very good graph. the message is clearly stated in the title, and each of the line graphs is properly labelled. it is easy to see from this graph that the total cell phone use has been rising steadily since 1996,except for a two-year period (1999 and 2000) where the numbers drop slightly. the pattern of use for women and men seems to be quite similar with very small discrepancies between them.相关字搜索:雅思【篇二:线状图】如何写好开头段1表示展示,显示的单词归纳1. show. to make sth. clear; to prove sth.证明,表明v. to say what sb./sth. is like 描写,描绘;叙述揭示;揭露;暴露;泄露4. display v. /displei/ to show signs of sth., especially a quality or feeling 显示;表现;显露5. illustrate v. to use pictures, photographs, diagrams, etc. ina book, etc. (用图、实例等)说明,阐明6.demonstrate v. to show sth. clearly by giving proof or evidence 显示,表露to show sb./sth., especially in a picture 展示;描述8. indicatev. to show that sth. is true or exists 表明;象征;暗示9.unfold v. to be gradually made known; to gradually make sth. known to other people显露,表露;呈现10. exhibit v. to show signs of sth?especially a quality or feeling 表尔,显出11. depict v. to show or represent sth. in a work of art such asa drawing or painting描绘,描画;描述12. outline 描绘以上动词在语义都接近,但需注意:它们后面所跟的宾语不同总结起来就是而担其它的一般只接名词宾语!对...进行分析the table gives a breakdown of different types of family who were living in poverty in australia in 2009.提供关于...的信息the chart gives information about post-school qualifications in terms of different levels of further education reached by men and women in australia in 2009.比较the charts compare the sources of electricity in australia and france in the years 1980....a glance at the graph provided reveals some striking similarities between chinese and us birth rates during the period 1920-2000.....5.given are two graphs concerning criminality in britain.其它替换词★number 丨nambs/数字★figure 丨figa/数字★percentage百分率,百分比the percentage of aged couples who lived in poverty in australia in 1999 was 4%. ★proportion 比例,比率this bar chart indicates the proportion of medical complaints of patients visiting therapists in australia in 2012.★rate 比例,比率;率the bar chart reveals different rates of post-school qualifications in australia in 2010. ★amount. /smaunt/数量,数额(一般与不可数名词连用)theres been a great amount of research into the subject.强化练习到尼泊尔的游客来自何处)in march 2010.有多少降雨)over a year,.(3) the chart gives 混合型汽车在全球的销售)between 2006 and 2009.不同交通方式)used by overseas visitors to travel in new zealand.少图书馆的书.) over this four-year period.售) in japan, the us and the rest of the world from 2006 to 2009.2.时间的连接词练习(二选一)1.the number of students who took spanish was 150 in/on 2010.2.according to the data, mandarin decreased during/at that period.3.since/from 2000, the trends have changed greatly.4.the chart shows the number of people going abroadfrom/between 2000 and 2010.5.in general, all the figures steadily increased over/from 1911 to 2011 .6.during the period 1980 and/to 1990, there was a gradual decrease.7.i have been learning japanese for/in two years now.8.the chart shows changes in irish school eollment figures over/at a 20-year period.9.on/in may 4,2012,in plain sight concluded its fifth and final season.10.the 12th china beijing international high-tech expo will be held in/on may.11.the number started a long decline from 1930onwards/afterwards.12.the period 1250 to/and 1350 is a period of religious and secular literature in english.13.the charts indicate how much a uk school spent on different costs in/for four separate years: 1981,1991,2001 and 2011.表示连续的时间段2. during the same period3. in the no. years spanning from 19xx through 19xx4. from then on= from this time onwards= in the subsequent years.句子翻译练习1.以上的线状图表明了在英国冬季和夏季的一天中用电的需求量。
雅思写作之小作文常用描述图表词汇__
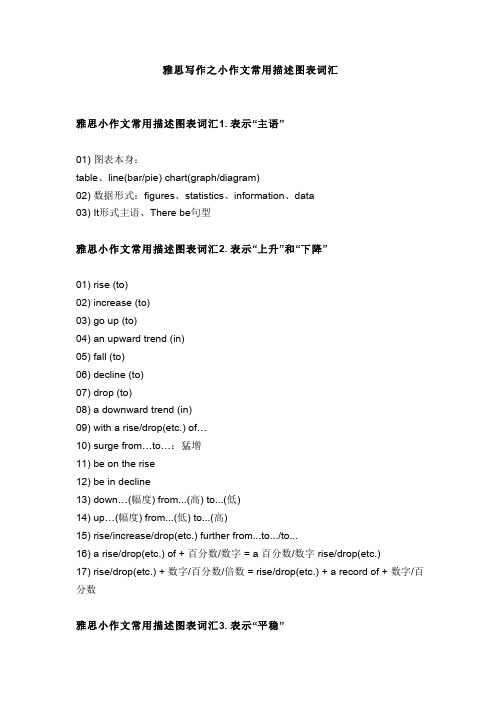
雅思写作之小作文常用描述图表词汇雅思小作文常用描述图表词汇1. 表示“主语”01) 图表本身:table、line(bar/pie) chart(graph/diagram)02) 数据形式:figures、statistics、information、data03) It形式主语、There be句型雅思小作文常用描述图表词汇2. 表示“上升”和“下降”01) rise (to)02) increase (to)03) go up (to)04) an upward trend (in)05) fall (to)06) decline (to)07) drop (to)08) a downward trend (in)09) with a rise/drop(etc.) of…10) surge from…to…:猛增11) be on the rise12) be in decline13) down…(幅度) from...(高) to...(低)14) up…(幅度) from...(低) to...(高)15) rise/increase/drop(etc.) further from...to.../to...16) a rise/drop(etc.) of + 百分数/数字 = a 百分数/数字 rise/drop(etc.)17) rise/drop(etc.) + 数字/百分数/倍数 = rise/drop(etc.) + a record of + 数字/百分数雅思小作文常用描述图表词汇3. 表示“平稳”01) remain stable (at)02) stay constant (at)03) maintain the same level (at)04) remain around that figure05) reach a plateau:到达(上升后的)平稳期 06) no change (in) 07) be flat at:平稳在… 08) level out at:平稳在…雅思小作文常用描述图表词汇4. 表示“波动”、“最高值”和“最低值”01) hover around:在…徘徊02) fluctuate around/at:在…波动(点)03) fluctuate between...and...:在…波动(范围)04) rise and drop (between…and…):起伏(在…之间)05) peak at:在…达到最大值06) hit a peak(of…)07) reach the highest point at:在…达到最大值08) reach a bottom at:在…达到最低值09) reach the lowest point at:在…达到最低值雅思小作文常用描述图表词汇5. 表示“变化程度”01) dramatic → dramatically:巨大02) significant → significantly:巨大03) moderate → moderately:适度04) slight → slightly:微小05) minimal → minimally:极其微小雅思小作文常用描述图表词汇6. 表示“变化速度”01) sudden → suddenly:忽然02) rapid → rapidly:快速03) steady → steadily:平稳04) gradual → gradually:逐渐雅思小作文常用描述图表词汇7. 表示“说明”01) show02) illustrate03) describe04) unfold05) reveal雅思小作文常用描述图表词汇8. 表示“大约”01) about02) nearly03) around04) approximately雅思小作文常用描述图表词汇9. 表示“占据”01) make up02) take up03) account for04) be composed of05) constitute06) comprise07) have/be/reach/hit雅思小作文常用描述图表词汇10. 表示“关于”01) about02) regarding03) concerning04) related to05) with regard to = as to:关于,就…而论(做状语)。
雅思小作文模板
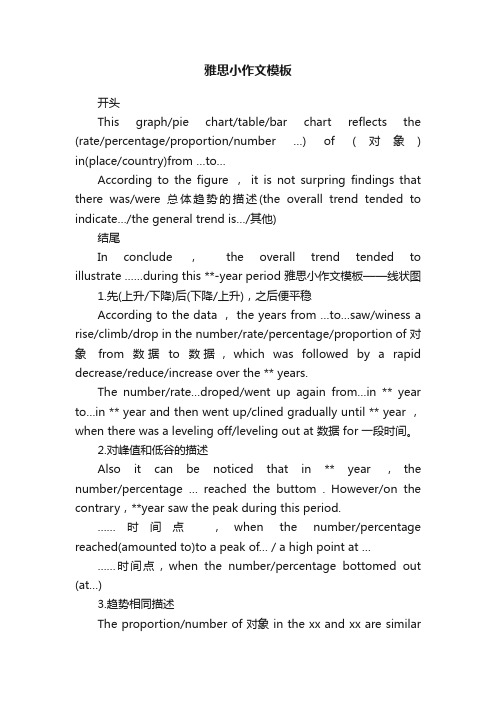
雅思小作文模板开头This graph/pie chart/table/bar chart reflects the (rate/percentage/proportion/number …) of (对象) in(place/country)from …to…According to the figure ,it is not surpring findings that there was/were 总体趋势的描述(the overall trend tended to indicate…/the general trend is…/其他)结尾In conclude ,the overall trend tended to illustrate ……during this **-year period 雅思小作文模板——线状图1.先(上升/下降)后(下降/上升),之后便平稳According to the data ,the years from …to…saw/winess a rise/climb/drop in the number/rate/percentage/proportion of 对象from数据to数据,which was followed by a rapid decrease/reduce/increase over the ** years.The number/rate…droped/went up again from…in ** year to…in ** ye ar and then went up/clined gradually until ** year ,when there was a leveling off/leveling out at 数据 for 一段时间。
2.对峰值和低谷的描述Also it can be noticed that in ** year ,the number/percentage … reached the buttom . However/on the contrary,**year saw the peak during this period.……时间点,when the number/percentage reached(amounted to)to a peak of… / a high point at ………时间点,when the number/percentage bottomed out (at…)3.趋势相同描述The proportion/number of 对象 in the xx and xx are similarand follow the same trend.In ** the figures were xx% and xx% respectively,rising to xx% and xx% respectively in **,after dipping to xx% and xx% respectively in **.(总体的趋势介绍)Thereafter,分开介绍即可第二篇:雅思小作文常用句式 19300字注意时态,第一段一般是一般现在时,接下来基本上是过去时,因为都是过去的数据了 Task 1 summarizationFirst paragraphtranslate the subject.words may be used: be made up of… ;be composed of…Main partAccording to the graph… , more specificallyIt is manifest from the graph that… , to be more exactthe greatest increase is in…rising from …to …next came sth.over the same period.word may be used:go up/increase/growjump/shoot up/surgedecline/drop/fallplunge/plummet (急剧下降)sharply/rapidly/dramaticallyslow/gentlefluctuatelevel off at/level out at 平稳peak at/reach the highest point atbottom at/reach the bottom ataccount for/make up/occupyabout/around/nearly/approximatelyrespectively (eg:In the 2004 Olympics,China and Russia won x and y gold medals respectively)expect/predict(eg:A is expected/predicted to reach…)Last paragraphTherefore, it can be clearly seen from the graph that…As a matter of fact, the issue of whether/ the phenomenon that/ the issue that ________________________is a complex and controversial(复杂的) one. On one hand, many people may feel that ___1____,and correspondingly(相关的)___解释1___; on the other hand, it can be noted that ___2___and hence (因此)__2的结果_. There is no universal/ definite answer to this question; so different people can hold different opinions due to their distinct backgrounds and values. As far as I am concerned, while I agree that under some circumstances___1__, ___2___, is somehow reasonable, however my opinion is that _________ and it can be greatly substantiated by the reasons addressed below.B:1) the speaker asserts that____复述或解释题目观点___,Although the speaker’s position is not wholly insupportable, far more compelling arguments can be made for ____自己的观点_____2) the issue of whether to ____复述_____ is a complex one, since it involves a conflict between our interest in ___doing___ and a legitimate need to ____do____. In my point of view, the final judgment should depend on a case-by-case analysis of two key factors.TOPIC:1) Since I _______________, I prefer to ___________________.2) In the past, I have often been pleasantly surprised by_________; therefore, I would rather ____________________.3) While there still exist ___________________,our resources/attention should be focused here not in other place.4) If you define ____题目中你认为不对的观点____, then I would gave to agree that today.5) ______结果____is important to me, so I would prefer to ____观点______.承接性句子1) My reasons for this view involve the notions of respect and trust.二、中间段1)first…….Second…….finally2)firstly.....for example; another opinion.....say,.. (i)addition,……3)Although w e m a y n o t h a v e c o n c l u s i v e s c i e n t i f i c e v i d e n c e o f a c a u s e - e f f e c t r e l a t i o n s h i p , a m p l e e v i d e n c e e s t a b l i s h e s s i g n i f i c a n t c o r r e l a t i o n . M o r e o v e r , b o t h c o m m o n s e n s e a n d o u r e x p e r i e n c e s i n f o r m u s t h a t p e o p l e t e n d t o _ _ _ _ _ _ _ _ _ _ _ . / p >。
雅思小作文条图

表达极值常用方法
动态柱状图练习
The bar chart shows the time spent by UK residents on different types of telephone calls between 1995 and 2002. Local fixed line calls were the highest throughout the period, rising from 72 billion minutes in 1995 to just under 90 billion in 1998. After peaking at 90 billion the following year, these calls had fallen back to the 1995 figure by 2002. National and international fixed line calls grew steadily from 38 billion to 61 billion at the end of the period in question, though the growth slowed over the last two years.
Sample Answer
静态柱状图练习
家庭作业
谢谢
Thank You
成都市锦江区银石广场F17
Floor 17, YinShi Plaza,Jinjiang Disteict, ChengDu, P.R.China
ห้องสมุดไป่ตู้
Sample Answer
There was a dramatic increase in mobile calls from 2 billion to 46 billion minutes. This rise was particularly noticeable between 1999 and 2002, during which time the use of mobile phones tripled. To sum up, although local fixed line calls were still the most popular in 2002, the gap between the three categories had narrowed considerably over the second half of the period in question.
雅思小作文常用词汇和套句汇总

雅思小作文常用词汇和套句汇总Ⅰ、开头结尾段常用词汇句型一、开头段常用词汇: “显示”“表明”“说明”————show, show,give, reveal, present, describe, depict, demonstrate, illustrate, indicate, reflect 。
领域领域 area/aspect/field/region/sphere area/aspect/field/region/sphere二、开头常用句式1. 根据这幅图我们可以看出According to the chart, it is clear that…2. 这幅图描述了…在…(时间起始)的数量变化 the chart shows the changes in the number of sth. over the period from … to …(between…and…)3. 从这幅图我们看到从从这幅图我们看到从......到到....的数据变化的数据变化的数据变化 the thechart shows the changes in the number of sth. over the period from… to …三、结尾常用句式在研究了这幅图之后,在研究了这幅图之后,我们了解到我们了解到我们了解到 when whenwe study the chart, it is apparent that1) We can conclude from the table that...2) In short ( = In brief), ...3) In conclusion, ...4) To conclude, it seems clear that...5) From the table/diagram, we can see... 6) As can be seen from the chart/table/diagram, ...7) It is clear/apparent from the chart/graph/table/diagram that...Ⅱ、各种图表常见词汇及句型一、饼状图(Pie chart )1. 常用词常用词1)名词:名词:◆percentage 百分比◆proportion 份额份额2)动词:动词:占:Comprise ,make up, constitute, account for, take up ,consume 占(份额), occupy, composeis divided into…parts 分为……部分部分consist of/ be comprised of 由…构成 consume the larges/smallest portion 占最大/小的份额小的份额与…相比较compare/comparison/by contrast/ in sharp contrast to 比…多outnumber/exceed 3)短语及副词)短语及副词与…相反on the contrary 几分之几几分之几one half/ one third/ one fifth/ two thirds/ two fifths 大约、大概大约、大概about/around/almost/nearly/roughly/approximately 分别/各自各自respectively 与…相比:Compared with ,compared to ,in comparison with ,in comparison to ,by comparison with ,by comparison to2. 常用套句常用套句1)The graph, presented in a pie chart, 1)The graph, presented in a pie chart, shows the general trend in…shows the general trend in…该图以饼图形式描述了……总的趋势。
雅思小作文写作模板 曲线图题型
雅思小作文写作模板曲线图题型导语:文考试当中占有很大的比重,它注重考察学生的综合能力。
以下是为大家精心的雅思小作文写作模板:曲线图题型,欢送大家参考!· 先根据横轴分析变化,然后再进行比拟。
· 第一段介绍核心信息(e.g.时间地点研究对象);一句话即可· 第二三段先分析第一个时间点,再分析后一个时间点。
雅思小作文曲线图常用句型&短语:Excel in something = have advantage in something图表描述::The g raph shows/illustrates/displays …表曲线:· 表程度:Felldramatically/significantly/astonishingly/considerably/stead ily to approximately 100 and 200 respectively; noticeable decrease· Slightly/marginally more women than men …· 表上升 The graph showed an upward trend/ something soars to…; Increase/ rise/ grow/ go up/ improve/ climb/ boom/ leap· 表下降:decrease/fall/drop/dip/godown/decline/reduce· Exceed/overtake/outnumber – e.g. Men with postgraduate diplomas clearly outnumbered their female counterparts.· 数值相同:Coal as a source for only 25 units of electricity in 1980, which was matched by natural gas · 数值不方便时可用括号表述。
雅思小作文曲线图必备词汇
下降
(1) The number of Japanese tourists dropped / declined /
went down / fell / reduced by *** / to ***. (2) Beef consumption has declined dramatically / significantly / sharply / steadily / moderately from *** to ***. (3) The annual production rate was on the decline, down from *** to ***. (4) The divorce rate showed / witnessed / saw a falling / downward trend. (5) There was a slight decrease in the amount of fish consumed.
平均
mean/average take an average average out at…
strike a balance
占多少
account for, make up, take up, cover,
represent , occupy, constitute, comprise, consist of be due to/attributed to
倍数
两倍:double, twice The total output is double that of last year. The total output has doubled since last year. The total output is twice as much as last year. 三倍:triple, three times 四倍:fourfold, four times a fourfold increase the rate increases fourfold
雅思小作文常用语句汇总
小作文普通图表题开头段改写1.图表形式:Graph-line graphChart-pie chart, bar chartTableProcess diagramMap2.动词形式:Show/Illustrate/indicate/reveal /compare(一般用于静态图)3.数据内容:变化:changes in通用表达:Different kinds of n.→直接罗列具体的n.词性转换:The consumption of n.= the amount of n. consumed地点:In a European country= in a certain/particular European country4.时间段:over a period of x years/from A to B/between A and B/throughout the period of5.常用句型:动态图:The line graph illustrates changes in the amounts of fish lamb, chicken and beef consumed in a certain European country=The line graph illustrates how the consumption of fish, lamb and chicken changed in a European country.静态图:The table compares xx in term of xxx中间段写作动态图(描述趋势)1.变化描述①上升:动词:increase/rise/grow/soar/double/triple名词:increase/rise/growth/upward trend/increment其他:down / up from + 数字+ 时间点②下降:动词:decrease/fall/drop/decline/dip(微小下降)名词:decrease/fall/drop/decline/dip/downward trend③保持稳定:keep/remain/maintain + stable/constant④波动:fluctuate(fluctuation不可数名词)⑤达到顶峰:peak at+data/reach a peak of⑥达到谷底:bottom at+data/reach a bottom of/reach a trough of*顶峰和谷底一定是在波动过程中达到的极值而非最大最小值⑦最大值/最小值:maximum/minimum最大值的其他表达:rank the first/top the list表示某个数据极小:Xx are no longer significant主要数据:Dominant=main剩余的:The remainder⑧相似或相等:be similar to/ be equal with/be matched by⑨放缓:slow (down)⑩开始于/达到/结束于:start at/reach/end at⑪超过:overtake/outnumber(一定是数量上)/surpass⑫数量回落至最初:it was the same to the xxxx(年份)figure⑬波动变化:with some fluctuation/in spite of some fluctuation⑭达到:stand at/reach+数字⑮A和B同时发生:A coincide with B2.修饰词汇的使用:大约:about/around/almost/approximately显著的变化:obvious/significant/noticeable/considerable/dramatic(一定是最显著的变化)微小的变化:slight/insignificant快速变化:sharp/rapid缓慢变化:slow稳定的变化:steady/gradual稳健的增长:robust growth3.主语描述①数量描述:The number of+可数名词The amount of+不可数名词或后缀单位的可数名词(tones, grams, miles, times等)The quantity of+不可数名词或可数名词(无生命的)A figure(用来代替data,data在雅思写作中不常用)for②比例描述:Percentage of:只能是百分比Proportion of:可以是单纯的比例比例占有:account for/share/make up/represent/constitute/take up③状态描述:前三大:top three/the 3 highest ranking xx4.连接词①当段落内部只有一个对象时:And then; after that;②当段落内部有多个对象时:趋势相反或趋势相同A呈现出与B相反的趋势:In contrast; oppositely; conversely; however; A saw an opposed trend; on the other hand与此相同的是:Similarly,……; A saw a similar trend③ What is also worth mentioning is that④To be precise, xx5.常用句型①动词句型写作对象(主语)+趋势+数据范围(第一次写的时候一定要带完整单位)+时间范围Eg.The consumption of chicken increased significantly from about 140 grams per person per week to 250 grams between 1979 and 2004 = The amount of chicken consumed rose dramatically from 140grams per person per week to 250 grams during the period from 1979 to 2004.②名词句型△there be句型There was a significant increase in the consumption of chicken from 140 grams per person per week to 250 grams between 1979 and 2004.△被动句型A dramatic rise can be seen/observed in the consumption of chicken from 140 grams per person per week to 250 grams between 1979 and 2004.静态图(比较差异)比较差异:A最大,while B最小;比较级相似或相等:be similar to/ be equal with/A which is matched by B倍数:xx is twice bigger than that of xx/ xx is twice as big as that of xx数据范围:range from xxx to xxx都大于或小于多少流程图(process program/flow chart/diagram)The depicted diagram outlines the process of xxx内容物:原材料(raw materials)设备(equipment, apparatus)处理办法(be done)产物或中间产物(product)步骤:stage/phase/step设备:equipment/apparatus总结段:一般写有多少个步骤A consists of x distinct steps/stagesIt requires x steps中间段:1.第一句话交代原材料As for cement making, limestone and clay are the raw materials used in this process.2. 任何一个设备的后面都可以跟where从句In the first stage, limestone and clay are sent to a crusher, where they are crushed to produce powder.3. 任何两个步骤之间都可以使用once/after( 一旦…)进行连接Once/after the powder is mixed in a mixer, it is further transported to a rotating heater, where it is heated for sometime.4. 任何两个步骤之间也可以使用after which进行连接Then the powder is mixed in a mixer, after which it is further transported to a rotating heater, where it is heated for some time.5. 任何一个产物的后面都可以跟一个非限制性定语从句(, which)In step four, the mixture is ground by a grinder and at the same time it is manufactured to cement, which also needs to be packed into bags in the final stage.6. 同一个步骤中有两个处理过程while,时间状语从句7. 合理的使用过渡词进行过渡In the first/initial stage,the whole process begins with doing/n.In step two,The second step involves doing…...The whole process ends at…...The resulting xx(产物某某)8.常用动词:运输:transfer/transport/send/pass through/bring/carry结尾段:介绍一下有几个步骤,分别为哪些地图题(map)开头段:用一个地方的变化用change 不同的用compareThe map illustrates /compare changes in the layout/ geographies ofHow xxx transform over a time span of x years between xx and xx概述段:总结最主要的特点Overall, the xxx underwent considerable changes地图的内容:建筑物:building/block道路:road/street/railway功能性设施:car park/ garden地理状况:建筑:1.有什么:there is a A in the east(或其他方位)of B=A is located/sited/situated in the B=A lies in the xxx2.位置关系①in 包含关系; on 接壤关系;to 隔海相望关系②附近:close to/ next to /near by③对面:opposite道路/河流1.位置关系:环绕surround;穿过cross2.沿着:along/alongside3.对面:across the road4.两边:on the road; 离路还有一段距离:off the road5.功能:①连接:link=connect②通向:lead to= provide access to= sb. access to sp. Through the road6.相交:the two road cross in the xxx功能性设施1.停车场:parking space/accommodate car parking地理变迁1.有无的变化(when the building work has been done,xxx)原来的:original拆除:be knocked down/ be demolished/ be removed/be eliminated/be pulled down/there will no longer be/this will be achieved by removing新修(additions):be built/ be constructed/ be established/be added/open up/be installed取代:A is replaced/renovated by B=A is removed to give/make way to the construction of B=A is converted to B(升级)2.大小的变化①扩大:the size of A increase =the car park was expanded/extended/enlarged to the east to the west(有了方位上的延伸)/augmented/②缩小:the size of A decrease=the car park narrow/shrink3.多少的变化:The number of xx increase/decrease/keep unchanged结尾段同一个地方的变化:总结最主要的变化不同地方的比较:总结最主要的差异或共同点。
lesson-3-雅思小作文-线图
thereafter in the percentage. The percentage
reached the bottom of 3% at 3:00 a.m, when there
was a slight rise afterwards.
P4: BODY
P5
The general trend was that the percentage of both radio and television audiences rose first and then decrease, while the total number of the latter was bigger than the former. In addition, the prime time for radio and television was 8 am and 8 pm, respectively.
三线图写法
方法1 以不同时间段为基准,分段描述 方法2
找相似的2条图为一组描述,其余的单独描述 方法3
分别描述三条图
The graph below shows the proportion of the population aged 65 and over between 1940 and 2040 in three different countries.
Scotland experienced a decline in the number of registered marriage.
趋势做主语:
A very noticeable trend for the registered marriage was a dramatic drop during 1960-1970.
- 1、下载文档前请自行甄别文档内容的完整性,平台不提供额外的编辑、内容补充、找答案等附加服务。
- 2、"仅部分预览"的文档,不可在线预览部分如存在完整性等问题,可反馈申请退款(可完整预览的文档不适用该条件!)。
- 3、如文档侵犯您的权益,请联系客服反馈,我们会尽快为您处理(人工客服工作时间:9:00-18:30)。
上升:rise, increase, incline, ascend, surge, rocket up,
下降: fall, decrease, decline, descend, fall, plunge
幅度大:significantly, dramatically,considerably,noticably, markedly, greatly,
幅度小:minorly, slightly
慢:slowly, gradually
快:rapidly, sharply,
中等;moderately,modestly
持平:level off, stay constant, stablize
波动:fluctuate flctuation
达到顶点:peak at, reach the peak of , summit/climax, the highest point, hit a record high,
达到低谷: bottom at, reach the bottom of,reach the valley of, lowest point
居高不下:reach a plateau of
句型:
5 v+adv.
The rate of crimes increased rapidly from 1990 to 2000.
6.There is a +adj +n
There was a rapid increase in the crime rate from 1990 to 2000.
7. …show an upward/ downward trend
The crime rate shows an upward trend from 1990 to 2000.
8. 时间见证
The last decade in the 20th centure witnessed the growth in the rate of crime.
加入数据
分词形式 The rate of crimes increased rpidly, inclining/ from 15% in 1990 to 25% in 2000.
副词形式The rate of crimes increased rpidly, up from 15% in 1990 to 25% in 2000.
定语从句The rate of crimes increased rpidly, which inclined from 15% in 1990 to 25% in 2000.
…表大概
Approximately, roughly, about, nearly/ less than, more than 表推测
It can be expected/ predicted/speculated that….
It is possible to expect/predict/speculate…
表分别是
Respectively, seperately, each
A and
B ascended gradually, rising from 2to 5 and 3 to 4 respectively.。