One-step synthesis of Ag–reduced graphene oxide nanocomposites and their surface-enhanced Raman
L-半胱氨酸改性氧化石墨烯去除水中Hg(Ⅱ)

第50卷第4期2021年4月应用化工Applied Chemical IndustryVol.50No.4Apr.2021半胱氨酸改性氧化石墨烯去除水中H g(n)赵博涵蔦林海英▽,冯庆革i,朱奕帆i,廖玉莲i(1•广西大学资源环境与材料学院广西高校环境保护重点实验室,广西南宁530004;2.广西博世科环保科技股份有限公司,广西南宁530007)摘要:通过简单一步合成法,以L-半胱氨酸(L-Cysteine)作为改性剂,合成了工业级半胱氨酸功能化氧化石墨烯吸附剂L-Cyslein e-G0o考察了不同条件下L-Cysleine-GO对Hg(H)吸附性能的变化,如pH、吸附剂投加量、接触时间等;通过FTIR、拉曼光谱和SEM等表征手段,以探究该材料的吸附性能及机理。
实验结果表明,当初始Hg(fl)浓度为200mg/L、pH为7、投加量为1g/L、吸附时间为60min、温度为25t时,最大吸附量为160.71mg/g。
准二级动力学、Freundlich模型与微观表征结果提示吸附机理为疏基等官能团对Hg(D)的化学键合、材料对汞的静电吸附作用,主要为多层化学吸附。
关键词:氧化石墨烯;水中Hg(I)的去除;L-半胱氨酸改性;一步合成法;吸附机理解析中图分类号:TQ424文献标识码:A文章编号:1671-3206(2021)04-0991-06Removal of Hg(U)from water by L-Cysteinemodified graphene oxideZHAO Bo-han,UN Hai-ying1'2,FENG Qing-ge,ZHU Yi-fan,UA0Yu-lian(1.Key Laboratory of Environmental Protection,College of Resources,Environment and Materials,Guangxi University,Nanning 530004,China;2.Guangxi Bossco Environmental Protection Technology Co.,Ltd.,Nanning530007,China)Abstract:Graphene oxide modified with L-Cysteine(L-Cysteine-GO)was prepared by one-step synthesis with L-Cysteine as the modifying agent.The adsorption performance of L-Cysteine-GO on Hg(U)was investigated at different factors such as pH,the dosage of material and contact time.FTIR,Raman spectroscopy and SEM were used to investigate the adsorption properties and mechanism of the materials.The results showed that the maximum adsorption capacity was160.71mg/g when the material was added into initial concentration of200mg/L at pH7,at25弋with the dosage of1g/L in60min.With combination of pseudo-second order kinetics,Freundlich model and material microstructure,it was suggested that the adsorption process can described to the chemical bonding of sulfhydryl groups and Hg(H),electrostatic adsorption between material and Hg(U),which was dominantly controlled by the multi-layer chemical adsorption.Key words:graphene oxide;removal of Hg(H)in water;L-Cysteine modification;one-step synthesis;adsorption mechanism identification现代化工、燃煤、氯碱和混汞炼金等行业所产生的重金属汞污染⑴,因其可对人体产生较高的毒性,导致神经、大脑和肾脏的接触性损害,而备受关注3〕。
Pin Assignment for Multi-FPGA Systems 1 (Extended Abstract)
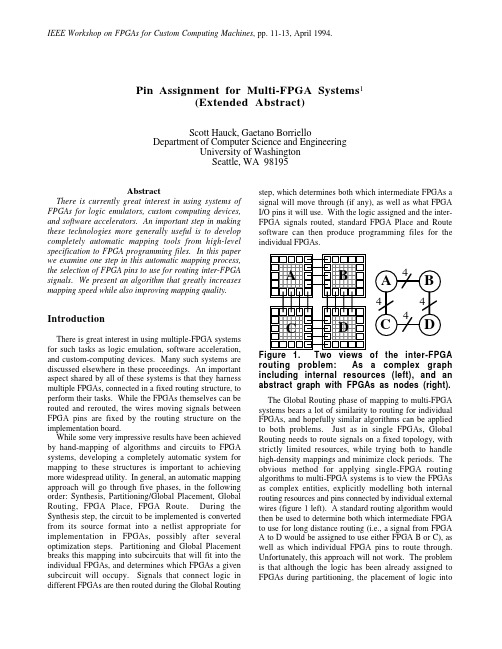
IEEE Workshop on FPGAs for Custom Computing Machines, pp. 11-13, April 1994.Pin Assignment for Multi-FPGA Systems1(Extended Abstract)Scott Hauck, Gaetano BorrielloDepartment of Computer Science and EngineeringUniversity of WashingtonSeattle, WA 98195AbstractThere is currently great interest in using systems of FPGAs for logic emulators, custom computing devices, and software accelerators. An important step in making these technologies more generally useful is to develop completely automatic mapping tools from high-level specification to FPGA programming files. In this paper we examine one step in this automatic mapping process, the selection of FPGA pins to use for routing inter-FPGA signals. We present an algorithm that greatly increases mapping speed while also improving mapping quality. IntroductionThere is great interest in using multiple-FPGA systems for such tasks as logic emulation, software acceleration, and custom-computing devices. Many such systems are discussed elsewhere in these proceedings. An important aspect shared by all of these systems is that they harness multiple FPGAs, connected in a fixed routing structure, to perform their tasks. While the FPGAs themselves can be routed and rerouted, the wires moving signals between FPGA pins are fixed by the routing structure on the implementation board.While some very impressive results have been achieved by hand-mapping of algorithms and circuits to FPGA systems, developing a completely automatic system for mapping to these structures is important to achieving more widespread utility. In general, an automatic mapping approach will go through five phases, in the following order: Synthesis, Partitioning/Global Placement, Global Routing, FPGA Place, FPGA Route. During the Synthesis step, the circuit to be implemented is converted from its source format into a netlist appropriate for implementation in FPGAs, possibly after several optimization steps. Partitioning and Global Placement breaks this mapping into subcircuits that will fit into the individual FPGAs, and determines which FPGAs a given subcircuit will occupy. Signals that connect logic in different FPGAs are then routed during the Global Routing step, which determines both which intermediate FPGAs a signal will move through (if any), as well as what FPGA I/O pins it will use. With the logic assigned and the inter-FPGA signals routed, standard FPGA Place and Route software can then produce programming files for the individual FPGAs.Figure 1. Two views of the inter-FPGA routing problem: As a complex graph including internal resources (left), and an abstract graph with FPGAs as nodes (right).The Global Routing phase of mapping to multi-FPGA systems bears a lot of similarity to routing for individual FPGAs, and hopefully similar algorithms can be applied to both problems. Just as in single FPGAs, Global Routing needs to route signals on a fixed topology, with strictly limited resources, while trying both to handle high-density mappings and minimize clock periods. The obvious method for applying single-FPGA routing algorithms to multi-FPGA systems is to view the FPGAs as complex entities, explicitly modelling both internal routing resources and pins connected by individual external wires (figure 1 left). A standard routing algorithm would then be used to determine both which intermediate FPGA to use for long distance routing (i.e., a signal from FPGA A to D would be assigned to use either FPGA B or C), as well as which individual FPGA pins to route through. Unfortunately, this approach will not work. The problem is that although the logic has been already assigned to FPGAs during partitioning, the placement of logic intoindividual logic blocks will not be done until the next step, FPGA placement. Thus, since there is no specific source or sink for the individual routes, standard routing algorithms cannot be applied.The approach we take here is to abstract entire FPGAs into single nodes in the routing graph, with the arcs between the nodes representing bundles of wires. This solves the unassigned source and sink problem mentioned above, since while the logic hasn’t been placed into individual logic blocks, partitioning has assigned the logic to the FPGAs. It also simplifies the routing problem, since the graph is much simpler, and similar resources are grouped together (i.e. all wires connecting the same FPGAs are grouped together into a single edge in the graph). Unfortunately, the routing algorithm can no longer determine the individual FPGA pins a signal should use, since those details have been abstracted away. It is this problem, the assignment of interchip routing signals to FPGA I/O pins, that the rest of this paper addresses. Pin assignment for multi-FPGA systems One solution to the pin assignment problem is quite simple: ignore it. After Global Routing has routed signals through intermediate FPGAs, those signals are then randomly assigned to individual pins. While this simple approach can quickly generate an assignment, it gives up some optimization opportunities. A poor pin assignment can not only result in greater delay and lower logic density, but can also slow down the place and route software, which must deal with a more complex mapping problem.A second solution is to use a topology that simplifies the problem. Specifically, topologies such as bipartite graphs only connect logic-bearing FPGAs with routing-only FPGAs. In this way, the logic-bearing FPGAs can be placed initially, and it is assumed that the routing-only FPGAs can handle any possible pin assignment. More details on such an approach can be found in [1]. However, it is important to note that these approaches only apply to topologies such as bipartite graphs and partial crossbars, topologies where logic-bearing FPGAs are not directly connected.A third approach is to allow the FPGA placement tool to determine its own assignment. This requires that the placement tool allow the user to restrict the locations where an I/O pin can be assigned (e.g., Xilinx APR and PPR placement and routing tools [4]). With such a system, I/O signals are restricted to only those pin locations that are wired to the proper destinations. Once the placement tool determines the pin assignment for one FPGA, this assignment is propagated to the attached FPGAs. It is important to note that this does limit the number of placement runs that can be performed in parallel. Specifically, since the assignment from one FPGA is propagated to adjacent FPGAs only after that entire FPGA has been placed, no two adjacent FPGAs can be placed simultaneously. Since the placement and routing steps can be the most time-consuming steps in the mapping process, achieving the greatest parallelism in this task can be critical. Also, while the iterative placement approach can optimize locally, creating good results in a single FPGA, it ignores more global optimization opportunities. Finally, there are some topologies for which iterative placement may be unable to determine a correct pin assignment, because the placement of one FPGA may use up resources required in another FPGA. Force-directed pin assignment for multi-FPGA systemsAs we have discussed, pin assignment via sequential placement of individual FPGAs can be slow, cannot optimize globally, and may not work at all for some topologies. What is necessary is a more global approach which optimizes the entire mapping, while avoiding sequentializing the placement step. Intuitively, the best approach to pin assignment would be to simultaneously place all FPGAs, with the individual placement runs communicating with each other to balance the pin assignment demands of each FPGA. In this way a global optimum could be reached, and the mapping of all FPGAs would be completed as quickly as any single placement could be accomplished. Unfortunately, tools to do this do not exist, and the communication necessary to perform this task could become prohibitive. Our approach is similar to simultaneous placement, but we will perform the assignment on a single machine within a single process. Obviously, with the placement of a single FPGA consuming considerable CPU time, complete placement of all FPGAs simultaneously on a single processor is impractical, and thus simplification of the problem will be key to a workable solution.Our approach is to use force-directed placement of the individual FPGAs [3]. In force-directed placement, the signals that connect logic in a mapping are replaced by springs between the signal’s source and each sink, and the placement process consists of seeking a minimum net force placement of the logic. By finding this minimum net force configuration, we expect to minimize wirelength in the resulting mapping. To find this configuration, the software randomly chooses a logic block and moves it to its minimum net force location. This hill-climbing process continues until a local optimum is found, at which point the software accepts the current configuration.Force-directed placement may seem a poor choice for pin assignment, and is generally felt to be inferior tosimulated annealing for FPGA placement. Two reasons for this are the difficulty force-directed placement has with optimizing for goals other than wirelength, and the inaccuracy of the spring approximation to routing costs. However, force-directed placement can handle all of the optimization tasks involved in pin assignment, and the spring metric is the key to efficient handling of multi-FPGA systems.Figure 2. Example of spring simplification rules. Source circuit at top has node U replaced at middle, and any springs created in parallel to others are merged at bottom.As implied earlier, we will not simply place individual FPGAs, but will in fact use force-directed placement simultaneously on all FPGAs in the system. To make this tractable, we can simplify the mapping process. Specifically, since we are only performing pin assignment, we do not care where the individual logic blocks are placed. Thus, we can examine the system of springs built for the circuit mapping, and use the laws of physics to remove nodes corresponding to FPGA logic blocks, leaving only I/O pins. As shown in the example of figure 5, the springs connected between an internal logic node and its neighbors can be replaced with a set of springs connected between the node’s neighbors while maintaining the exact same forces on the other nodes. By repeatedly applying these simplification rules to the logic nodes in the system, we end up with a mapping consisting only of I/O pins, with spring connections that act identically to the complete mapping they replace. In this way, we simplify the problem enough to allow the pin assignment of a large system of FPGAs to be performed efficiently.We have performed comparisons of our force-directed approach with iterative placement approaches, as well as random pin assignments, on several current multi-FPGA systems. The results have shown that the force directed approach is faster than all other alternatives, including random, by up to almost a factor of ten. It also produces higher-quality results than the other approaches, yielding up to an 8.5% decrease in total wirelength in the system. Our algorithm works on arbitrary topologies, including those for which iterative placement approaches generate incorrect results. Complete results, along with a more thorough discussion of this topic, can be found in [2]. References[1] P. K. Chan, M. D. F. Schlag, "Architectural Tradeoffs in Field-Programmable-Device-Based Computing Systems", IEEE Workshop on FPGAs for Custom Computing Machines, pp. 152-161, 1993.[2] S. Hauck, G. Borriello, "Pin Assignment for Multi-FPGA Systems", University of Washington, Dept. of Computer Science & Engineering Technical Report #94-04-01, April 1994.[3] K. Shahookar, P. Mazumder, “VLSI Cell Placement Techniques”, ACM Computing Surveys, Vol. 23, No. 2, pp. 145-220, June 1991.[4] Xilinx Development System Reference Guide and The Programmable Logic Data Book, Xilinx, Inc., San Jose, CA, 1993.1 This paper is an extended abstract of University of Washington, Dept. of Computer Science & Engineering Technical Report #94-04-01, April 1994.。
预氧化技术

3 Introduction
• ClO2 oxidation prior to chlorination can reduce the levels of THM and total organic halogen (TOX) formation (Lykins and Griese,1986; Linder et al., 2006 ).
(1) the changes of NOM properties with ClO2 pretreatment.
(2) the formation of regulated and emerging DBPs from ClO2 preoxidation and in combination with chlorination or chloramination.
第33页,共33页。
• 与浊度不同,滤后水高锰酸盐指数自运行开始后一直保持稳定,说 明生物过滤对水中易氧化有机物的去除相关性不大;滤后水UV254 变化很小,说明难生物降解(shēnɡ wù jiànɡ jiě)有机物很难在生物 过滤中被去除; O3 —生物过滤对DOC 的去除率稍高。O3 和PPC 预氧化后SUVA 相对于空白试验分别降低和升高(见表1) ,而 O3 —生物过滤出水SUVA 升高较明显(见表2) ,说明O3 预氧化更 有助于生物过滤对可生物降解(shēnɡ wù jiànɡ jiě)有机物的去除。
transformed large aromatic and long aliphatic chain organic structures to small
and hydrophilic organics.
第33页,共33页。
Conclusion
基于果糖和多巴胺的碳点制备及性能

第 43 卷第 3 期2024年 5 月Vol.43 No.3May 2024中南民族大学学报(自然科学版)Journal of South-Central Minzu University(Natural Science Edition)基于果糖和多巴胺的碳点制备及性能张洋洋1,崔丽丽1,刘科2,程盈盈1,余燕敏1*(1 湖北文理学院基础医学院,湖北襄阳441053;2 湖北文理学院低维光电材料与器件湖北省重点实验室,湖北襄阳441053)摘要以果糖为碳源,多巴胺(DA)为氮源,一步水热法制备N掺杂碳点(N-CDs).分别采用X-射线衍射仪(XRD)、高分辨透射电子显微镜(HR-TEM)、X射线光电子能谱仪(XPS)、紫外-可见吸收光谱(UV-Vis)和傅里叶变换红外光谱仪(FT-IR)等表征手段对N-CDs的结构、形貌、表面官能团及光学性质进行分析,用MTT法研究细胞毒性,用共聚焦显微技术研究细胞成像性能.结果表明:N-CDs为平均粒径约1.76 nm的球形颗粒,表面富含羟基、羧基、氨基和羰基等官能团,荧光激发和发射波长分别为440 nm和536 nm. N-CDs水溶性好,低细胞毒性,浓度为0.5 mg‧mL-1时,Hela细胞的存活率高于93%,且N-CDs易通过细胞膜进入细胞质中,在细胞内展现出较亮的荧光信号.该方法简便、绿色环保,N-CDs具有低细胞毒性,可在细胞内荧光成像,有望应用于癌细胞的早期诊断.关键词果糖;多巴胺;碳点;荧光性能;细胞成像中图分类号O657.3 文献标志码 A 文章编号1672-4321(2024)03-0319-07doi:10.20056/ki.ZNMDZK.20240304Preparation and properties of carbon dots based on fructose and dopamine ZHANG Yangyang1,CUI Lili1,LIU Ke2,CHENG Yingying1,YU Yanmin1*(1 School of Basic Medicine, Hubei University of Arts and Science, Xiangyang 441053,Hubei, China;2 Hubei Key Laboratory of Low Dimensional Optoelectronic Materials and Devices, Hubei University ofArts and Science, Xiangyang 441053,Hubei China)Abstract Nitrogen doped carbon dots (N-CDs)were synthesized via one-step hydrothermal method using fructose as carbon source and dopamine (DA) as nitrogen source. The structure, morphology, surface functional groups and optical properties of N-CDs were characterized via X-ray diffraction (XRD),high-resolution transmission electron microscopy (HRTEM),X-ray photoelectron spectrometer (XPS),ultraviolet-visible absorption spectrum (UV-vis),Fourier-transform infrared spectroscopy (FT-IR)and other characterization techniques. The cytotoxicity was studied by MTT assay,and cell imaging performance was studied by confocal microscopy. The results showed that the N-CDs were spherical particles with an average particle size of about 1.76 nm. The surface was rich in functional groups,such as hydroxyl, amino, carboxyl and carbonyl groups. The fluorescence excitation and emission wavelengths of the N-CDs were 440 nm and 536 nm, respectively. The N-CDs demonstrated good water solubility and low cytotoxicity. At a concentration of 0.5 mg∙mL-1, the survival rate of Hela cells was higher than 93%. N-CDs could easily enter the cytoplasm through the cell membrane and showed bright fluorescence signal in the cell. This method is simple,green and environmentally friendly. The N-CDs have low cytotoxicity and can be used in intracellular fluorescence imaging, which is highly desirable for the early diagnosis of cancer cells.Keywords fructose; dopamine; carbon dots; fluorescence properties; cell imaging收稿日期2023-04-01* 通信作者余燕敏(1985-),女,副教授,博士,研究方向:功能纳米材料的设计合成及其应用,E-mail:yuyanmin2005@ 基金项目国家自然科学基金资助项目(51809087);中国国家留学基金资助项目(202008420051);湖北省教育厅科学技术研究资助项目(Q20182601)第 43 卷中南民族大学学报(自然科学版)碳点(carbon dots,CDs)是一种新型发光碳纳米材料,主要由C、H、O元素构成,与传统半导体量子点相比,CDs具有水溶性好、荧光性能强、生物相容性好、低毒性、低成本、易制备、易功能化等优点[1-3],已在化学传感[4]、生物医学[5-6]、离子检测[7-8]和催化学[9-10]等领域展现极好的应用前景.高效、灵敏地监测单个细胞的生命活动进程,将对阐明细胞生理过程产生极大的促进作用.CDs作为细胞生命动态过程及动物活体内肿瘤的靶向荧光示踪剂,因其高灵敏度、低毒性、良好的时空分辨率、操作简单和无创实时等优点成为监测细胞生命活动进程的首选方法[11-13].目前,CDs制备方法主要有水热法[14-15]、热解法[16-17]、微波辅助法[18]、激光消融法[19]等,其中水热合成法,因其操作简单,绿色经济等优点,成为合成CDs 的主要方法[20].本文采用简易的水热法,以含有多羟基D-果糖为碳源,含酚羟基和氨基的多巴胺为氮源,一锅水热合成N-CDs.合成的N-CDs为尺寸均匀的球形纳米颗粒,平均粒径约为1.76 nm,表面含羟基、羧基、氨基和羰基等官能团,具有良好的水溶性和生物相容性,荧光特性优异.N-CDs具有低细胞毒性,易通过细胞膜进入细胞质中,在细胞内展现出较亮的荧光信号.本合成方法操作简单、绿色环保,制备的N-CDs发光性能稳定,细胞毒性低,在细胞成像尤其是肿瘤细胞成像中具有潜在的应用价值. 1 实验部分1.1 试剂和仪器果糖(国药集团化学有限公司);多巴胺(上海源叶生物科技有限公司);超纯水采用Millipore系统的二次水;Hela细胞(普诺赛公司);DMEM/High Glucose、磷酸盐缓冲液(PBS)、MTT、DMSO、10%胎牛血清购自武汉塞维尔生物科技有限公司.所用试剂均为分析纯.傅立叶变换红外光谱仪(FT-IR,Nicolet IS 5);X 射线衍射仪(XRD,Rigaku Ultima IV);场发射透射电镜(TEM,JEOL JEM-2100 F);X射线光电子能谱(XPS,Thermo Fisher Scientific K-Alpha Plus);荧光光谱仪(Hitach F-4600);多功能荧光酶标仪(Molecular Devices SpectraMax i3x);电子分析天平(Mettler Toledo AL104);电热鼓风干燥箱(上海博迅实业有限公司医疗设备厂,GZX-9030MBE);荧光共聚焦显微镜(Leica TCS SP8).1.2 实验方法1.2.1 N-CDs的制备称取2.0 g果糖和0.02 g多巴胺,溶于15 mL的去离子水,搅拌5 min后,转移至50 mL的聚四氟乙烯里衬水热反应釜中,于电热恒温鼓风干燥箱180 ℃下加热24 h,反应结束后自然冷却至室温.将所得溶液在4500 r·min-1转速下离心5 min,6次后用0.22 µm 的微孔滤膜过滤得到黄色滤液,即N-CDs溶液,置于4 ℃冰箱保存备用.采用同样方法不添加DA制备CDs,不添加果糖制备DA参照溶液.1.2.2 细胞毒性采用MTT法检测N-CDs的细胞毒性.Hela细胞以每孔8×10³个细胞接种于96孔板,每孔体积为100 µL.将96孔板置于细胞培养箱(5% CO2,37 ℃)培育24 h,然后加入不同浓度的碳点100 µL继续培养24 h后,用PBS清洗3遍,每孔加入含有MTT的新鲜培养基100 µL,放入细胞培养箱继续培养4 h.吸弃上清液,每孔加100 µL DMSO,轻微震荡.酶标仪测量每孔在490 nm波长处的吸光度值,记录并处理实验结果.以未处理细胞的吸光度值为100%,计算在不同浓度的N-CDs,细胞的存活率.1.2.3 细胞成像将对数生长期Hela细胞按照每孔1×10⁴个分散于装有载玻片的六孔板中,于细胞培养箱37 ℃下培养24 h.细胞贴片后,加入制备的N-CDs继续孵育6 h.取出载玻片,用PBS溶液把细胞洗涤3遍.细胞固定之后,用共聚焦显微成像技术观察细胞的成像情况.2 结果与讨论2.1 碳点合成条件优化运用单因素法对制备N-CDs的条件(反应温度、反应时间、果糖用量和果糖-DA用量比)进行优化,以制备光学性能优异的N-CDs.实验结果表明最佳合成条件为:反应温度180 ℃、反应时间24 h,果糖用量2.0 g,DA用量为0.02 g.考察水热反应温度和反应时间对CDs荧光强度的影响,结果见图1.由图1(a)可知:反应时间24 h时,制备的CDs荧光性能最强;由图1(b)可知:反应温度180 ℃时,CDs荧光性能最强.故本研究选择反应时间24 h、反应温度180 ℃.320第 3 期张洋洋,等:基于果糖和多巴胺的碳点制备及性能2.2 CDs 和N -CDs 表征和性质不同果糖用量制备的CDs 的TEM 结果见图2(a )‒2(f ).由图可知:用果糖制备的碳点均呈球形结构,水溶性好,分散性良好.果糖用量为0.5、1.0、1.5、2.0、2.5、3.0 g 时,合成的CDs 平均粒径分别为4.06、4.10、2.56、1.70、2.50、3.05 nm ,表明果糖用量影响碳点的粒径.当果糖的量大于2.0 g 后,CDs 球形颗粒出现团聚现象;用量3.0 g 时,团聚明显.添加氮源DA 后,制备的N -CDs 的TEM 结果见图2(g )、2(h ).由图可知:DA 的加入量0.2 g 时,N -CDs 平均粒径约为3.9 nm ;DA 用量0.02 g 时,制备的N -CDs 平均粒径约为1.76 nm.图3为CDs 和N -CDs 的XRD 图.图中CDs 和N -CDs 均在2θ为19˚~23˚处有一个较宽的衍射峰,该衍射峰归属为石墨结构的(002)面[21-22].由谢乐公式可知:半峰宽越大,粒径越小;如表1所示:果糖用量为2.0 g 时,半缝宽最宽,粒径较其他用量小,与TEM 结果相符.N -CDs 的XRD 图谱在2θ为22.58˚处均有一个宽的衍射峰,与CDs 相比,衍射峰的半缝宽较CDs 变窄,粒径较CDs 增大,表明DA 的加入对CDs 晶型的影响较小.图4为CDs 和N -CDs 的FT -IR 图.图4(a )为不同果糖用量1.0、1.5、2.0、2.5 g 制备的CDs 的FT -IR 图,由图可知:不同果糖用量制备的CDs 的红外特征吸收峰一致,说明果糖用量不影响CDs 的官能团组成.3373 cm -1馒头式吸收峰为―OH 的伸缩振动峰;1707、1309、1205 cm -1吸收峰分别归属为C =O 的伸缩振动峰,C ―H 弯曲振动峰和C ―O 伸缩振动峰[23-24];1452 cm -1和871 cm -1的O ―H 的变形震动峰[25]说明果糖为碳源制备的CDs 含有羟基、羧基和羰基等官能团,CDs 良好的水溶性与这些基团相关[23-27].图4(b )中,DA 为前驱物制备的DA 溶液的红外谱图中1638 cm -1强吸收峰,归属于DA 苯环中的C =C 的伸缩振动峰.在N -CDs 的红外特征吸收峰中,与CDs 的50055060065070002004006008001000120014001600 16 h 20 h 24 h 28 hF L i n t e n s i t y2004006008001000120014001600F L i n t e n s i t yλ/nm (a) 反应时间500550600650700λ/nm (b) 反应温度220 ℃200 ℃180 ℃160 ℃图1 CDs 荧光性能Fig.1 Fluorescence spectra of CDs(a) 0.5 g(b) 1.0 g(c) 1.5 g(d) 2.0 g(h) 0.2 g fructose-0.02 g DA(g) 2.0 g fructose-0.2 g DA(f) 3.0 g(e) 2.5 g345Diameter/nm1230102030Diameter/nm2435Diameter/nm2435Diameter/nm1324Diameter/nmF r e q u e n c y /%346505Diameter/nm2354Diameter/nm1243Diameter/nmF r e q u e n c y /%510152025F r e q u e n c y /%5F r e q u e n c y /%F r e q u e n c y /%0F r e q u e n c y /%F r e q u e n c y /%F r e q u e n c y /%图2 不同果糖用量制备的CDs (a -f )和N -CDs (g -h )的TEM 图Fig.2 TEM images of CDs (a -f ) and N -CDs (g -h ) prepared with different amounts of fructose321第 43 卷中南民族大学学报(自然科学版)特征吸收峰相比,3373 cm -1馒头式吸收峰变宽,为―OH 和―NH 的伸缩振动峰,C =O 的伸缩振动峰发生了改变,由1707 cm -1改变至1671 cm -1,且在1081 cm -1呈现C ―N 吸收峰,在1522 cm -1呈现N ―H 的特征峰,说明N 元素成功掺入CDs 形成N -CDs ,结构中含有羟基、羧基、氨基和羰基等官能团[27].XPS 研究CDs 和N -CDs 的元素组成和元素化合价态,如图5所示.图5(a )可知,XPS 全谱图中有2个明显的峰,对应结合能为284.6 eV 和532.7 eV ,归属为C 1s 和O 1s ,说明CDs 主要含C 和O 两种元素,与CDs 相比,N -CDs 的XPS 全谱图中新出现了400.0 eV 吸收峰,归属为N 1s ,说明DA 的加入,成功将N 元素掺杂入CDs.由图5(b )中的O 1s 高分辨扫描XPS 谱图,对其去卷积分峰拟合,CDs 在531.5 eV 和533 eV 处有2个峰,分别归属为C =O 和C ―O (H ),N -CDs 在531.5、532.3、533.3 eV 处有3个峰,分别归属为C =O 、C ―O ―C 和C ―O (H ) [22].图5(c )的C 1s 高分辨XPS 谱图分峰拟合结果显示:CDs 在284.78、286.48、288.53 eV 处有3个峰,分别归属为C ―C 、C ―O 和C =O 基团.N -CDs 在284.58、285.38、286.53、288.63 eV 处有4个峰,分别归属为C ―C 、C ―N 、C ―O 和C =O 基团[22].图5(d )是N 1s 的高分辨XPS 谱图分峰拟合,图中结合能399.7、401.5 eV 分别归属C ―N ―C 键和H ―N键,表明合成的N -CDs 含有羟基、羧基、氨基和羰基等官能团,与FT -IR 结果一致.XPS 价带谱包含元素的化学信息和电子结构信息,且线形与价电子结构有密切的关系[28].由图5(e )可见:CDs 与N -CDs 的价带谱上均有3个基本峰,与石墨碳价带谱近似,说明合成碳点有石墨烯结构特征[29],与XRD 结论一致.图6为DA 、CDs 和N -CDs 的紫外-可见吸收光谱、激发/发射光谱.由图6(a )‒(c )中,DA 主要吸收峰位于227 nm 处,CDs 的主要吸收峰位于296 nm 处,N -CDs 的紫外光谱图中存在227 nm 和296 nm 两处吸收峰,分别对应于π-π*、n -π*跃迁[30-31].荧光光谱图6(d )‒(f )为DA 、CDs 和N -CDs 在不同激发波长(380 nm~460 nm ,间隔10 nm )扫描下的荧光光谱图,由图可知,DA 、CDs 和N -CDs 的最大发射波长分别位于475、540、536 nm.当激发波长由380 nm 增加到460 nm 时,荧光强度先增大后减小,荧光发射峰发生红移,位置与强度对激发波长具有较强的依赖性,主要由1020304050607080CDs-1N-CDs CDs-2CDs-3CDs CDs-4CDs-52θ/(°)图3 CDs 、N -CDs 的XRD 图Fig.3 XRD pattern of the CDs and N -CDs表1 不同果糖用量制备碳点的XRD 衍射峰参数Tab.1 XRD diffraction peak parameters of quantum dots preparedwith different amount of fructose样品CDs -1CDs -2CDs -3CDsCDs -4CDs -5N -CDs 果糖用量/g0.51.01.52.02.53.02.0半缝宽/(˚)17.1216.8721.3822.1917.9618.4220.312θ/(˚)19.4219.7020.4820.4820.0620.8222.5820406080100σ/cm -1σ/cm -1(τ)λ/%20406080100(τ)λ/%图4 CDs 和N -CDs 的傅里叶变换红外光谱Fig.4 FT -IR spectra of CDs and N -CDs322第 3 期张洋洋,等:基于果糖和多巴胺的碳点制备及性能于碳点表面的缺陷作为激发能阱和粒子粒径对光的选择性不同所致[30],此现象属于石墨碳点的典型特征[25,30].采用不同浓度(0~1.0 mol ‧L -1)NaCl 溶液中N -CDs荧光光谱的方法研究N -CDs 离子稳定性,N -CDs 具有良好的离子稳定性,当浓度为1 mol ‧L -1时,荧光强度减弱仅11%.氙灯持续照射N -CDs 溶液,研究光稳定性,实验结果表明:N -CDs 溶液荧光强度随着氙灯的不断照射呈现出非常微小的下降趋势,其氙灯照射100 min 后的荧光强度仍有最初强度的92%,表530531532533534535N-CDsO 1sC—O—CC—O (H)CDsC =OC—O (H)C =O282284286288290CDsC—C C—NC—OC =O N-CDsC 1sC—CC =O C—O396398400402404N 1sN-CDsC—N—CN—HCDsN-CDs24681020040060080010001200(a) 全谱CDsN-CDsC 1sN 1sO 1s E b /eV (d) N 1sE b /eV (e) 价带谱E b /eV (b) O 1sE b /eV (c) C 1sE b /eV 图5 CDs 和N -CDs 的XPS 谱图Fig.5 XPS spectra of the CDs and N -CDs4505005506006507001 380 nm2 390 nm3 400 nm4 410 nm5 420 nm6 430 nm7 440 nm8 450 nm 9460 nmF L i n t e n s i t y1234567894505005506006507001 380 nm 2 390 nm 3 400 nm 4 410 nm 5 420 nm 6 430 nm 7 440 nm 8 450 nm 9460 nmF L i n t e n s i t y1234567894004505005506006501 380 nm 2 390 nm 3 400 nm 4 410 nm 5 420 nm 6 430 nm 7 440 nm 8 450 nm 9460 nmF L i n t e n s i t y123456789200300400500600700800A b s o r b a n c eEmExAbsF L i n t e n s i t y200300400500600700800A b s o r b a n c eEmEx AbsF L i n t e n s i t y200300400500600700800A b s o r b a n c eλ/nm (a) DAλ/nm (d) DAλ/nm (b) CDsλ/nm (e) CDsλ/nm (c) N-CDsλ/nm (f) N-CDsF L i n t e n s i t yAbsExEm图6 紫外-可见吸收光谱、荧光激发、荧光发射光谱和不同激发波长下的荧光光谱Fig.6 UV -vis absorption , fluorescence excitation and fluorescence emission spectra and fluorescence spectra of CDs at the various excitation wavelengths323第 43 卷中南民族大学学报(自然科学版)明N -CDs 光稳定性良好.2.3 碳点生物成像性能2.3.1 细胞毒性采用MTT 法测定CDs 与N -CDs 对Hela 细胞的体外细胞毒性,结果如图7所示.由图7可知:在CDs 和N -CDs 浓度为0.5 mg ‧mL -1条件下,Hela 细胞的存活率分别为85%和93%,当浓度高达1.0 mg ‧mL -1条件时,Hela 细胞的存活率有所下降,存活率可达70%和84%.MTT 实验表明,CDs 和N -CDs 具有较低的细胞毒性.2.3.2 细胞成像将合成的N -CDs 与Hela 细胞共培养6 h ,在激发波长405 nm 条件下,Hela 细胞的荧光共聚焦显微结果见图8.由图8可知:细胞孵育情况良好,N -CDs 标记的Hela 细胞在405 nm 激发下,可发出较亮的绿光,表明N -CDs 通过细胞膜进入Hela 细胞中.细胞成像的结果说明,N -CDs 具有良好的生物相容性,在细胞中保持良好的荧光性能,且N 元素掺杂,修饰的CDs 提高其在细胞成像中的荧光强度,表明N -CDs 有望运用在Hela 细胞的靶向识别和成像.3 结语本文采用水热法一步合成了生物相容性好、水溶性好、粒径均一的氮掺杂-碳点复合材料(N -CDs ),合成过程原料简单易得,操作简便.原料果糖用量对量子点粒径影响明显,果糖用量为2.0 g 时,多巴胺为0.02 g 时,制得碳点呈球形,分散性好,粒径约1.76 nm.多巴胺为氮源,由于多巴胺分子间力,N -CDs 分散性明显增大.通过N -CDs 与Hela 细胞共培养可知N -CDs 具有低细胞毒性,在恶性肿瘤细胞中能发出较强的荧光,说明碳点对恶性肿瘤细胞具有识别作用,在癌症的早期诊断中具有优异的潜在的应用价值.参 考 文 献[1] JOHN J , MATHEW R M , THOMAS T , et al. Tunablelight emission using crystalline carbon dots [J ]. Journal of Optics , 2019, 48(2): 288-293.[2] ZHI B , CUI Y , WANG S , et al. Malic acid carbon dots :From super -resolution live -cell imaging to highly efficient separation [J ]. ACS Nano , 2018, 12(6): 5741-5752.[3] 王强, 胡旭虎.荧光碳点在环境监测中的应用研究[J ].中南民族大学学报(自然科学版), 2017, 36(4): 22-26.[4] YI Z , LI X , ZHANG H , et al. High quantum yieldphotoluminescent N -doped carbon dots for switch sensing and imaging [J ]. Talanta , 2021, 222: 121663.[5] ZHANG Z , FAN Z. Application of cerium -nitrogen co -doped carbon quantum dots to the detection of tetracyclines residues and bioimaging [J ]. Microchemical Journal , 2021, 165: 106139.[6] HUO X Y , LIU L Z , BAI Y F , et al. Facile synthesis ofyellowish -green emitting carbon quantum dots and their applications for phoxim sensing and cellular imaging [J ]. Analytica Chimica Acta , 2022, 1206: 338685.[7] GUO J Q , YE S , LI H , et al. Novel fluorescent probesbased on nitrogen -sulfur co -doped carbon dots for chromium ion detection [J ]. New Journal of Chemistry , 2021, 45(10): 4828-4834.[8] PICARD M , THAKUR S , MISRA M , et al. Miscanthusgrass -derived carbon dots to selectively detect Fe 3+ ions [J ]. RSC Advances , 2019, 9(15): 8628-8637.[9] LI W D , LIU Y , WU M , et al. Carbon -quantum -dots -loaded ruthenium nanoparticles as an efficient electrocatalyst for hydrogen production in alkaline media [J ]. Advanced Materials , 2018, 30(31): e1800676.[10] QU D , ZHENG M , DU P , et al. Highly luminescent S ,N Co -doped graphene quantum dots with broad visible20406080100ρ/(mg·ml -1)C e l l v i a b i l i t y /%图7 CDs 和N -CDs 培养48 h 后的细胞毒性Fig.7 Cytotoxicity after culturing Hera cells using CDs and N -CDs for 48 h图8 Hela 细胞的共聚焦荧光图像Fig.8 Confocal fluorescence images of Hela cells324第 3 期张洋洋,等:基于果糖和多巴胺的碳点制备及性能absorption bands for visible light photocatalysts[J].Nanoscale, 2013, 5(24): 12272-12277.[11]YU C,QIN D,JIANG X,et al. Facile synthesis of bright yellow fluorescent nitrogen-doped carbon quantumdots and their applications to an off‒on probe for highlysensitive detection of methimazole[J]. MicrochemicalJournal, 2021, 168: 106480.[12]LI Z,WANG Q,ZHOU Z,et al. Green synthesis of carbon quantum dots from corn stalk shell by hydrothermalapproach in near-critical water and applications in detectingand bioimaging [J]. Microchemical Journal, 2021, 166(13): 106250.[13]LIU L,MI Z,HUO X,et al. A label-free fluorescence nanosensor based on nitrogen and phosphorus co-dopedcarbon quantum dots for ultra-sensitive detection of newcoccine in food samples[J]. Food Chemistry,2022,368: 130829.[14]GAO S,WANG X,XU N,et al. From coconut petiole residues to fluorescent carbon dots via a green hydrothermalmethod for Fe3+ detection[J]. Cellulose, 2021, 28(3):1647-1661.[15]WANG Y,LIU Y,ZHOU J,et al. Hydrothermal synthesis of nitrogen-doped carbon quantum dots fromlignin for formaldehyde determination[J]. RSCAdvances, 2021, 11(47): 29178-29185.[16]李志英,李洋. 红枣碳量子点荧光探针的制备及对食品中赖氨酸的检测[J]. 化学研究与应用,2018,30(11): 1902-1907.[17]EL-MALLA S F, ELSHENAWY E A, HAMMAD S F,et al. N-doped carbon dots as a fluorescent nanosensor fordetermination of colchicine based on inner filter effect[J].Journal of Fluorescence, 2021, 31(3): 675-684.[18]ARCHITHA N, RAGUPATHI M, SHOBANA C, et al.Microwave-assisted green synthesis of fluorescent carbonquantum dots from Mexican Mint extract for Fe3+ detectionand bio-imaging applications[J]. EnvironmentalResearch, 2021, 199: 111263.[19]SIDOROV A I,LEBEDEV V F,KOBRANOVA A A,et al. Formation of carbon quantum dots and nanodiamondsin laser ablation of a carbon film[J]. QuantumElectronics, 2018, 48(1): 45-48.[20]SINGH V, RAWAT K S, MISHRA S, et al. Biocompatiblefluorescent carbon quantum dots prepared from beetrootextract for in vivo live imaging in C. elegans and BALB/cmice[J]. Journal of Materials Chemistry B,2018,6(20): 3366-3371.[21]LI H T,HE X D,KANG Z H,et al. Water-soluble fluorescent carbon quantum dots and photocatalystdesign[J]. Angewandte Chemie (International Ed inEnglish), 2010, 49(26): 4430-4434.[22]LIU Y,ZHOU L,LI Y,et al. Highly fluorescent nitrogen-doped carbon dots with excellent thermal andphoto stability applied as invisible ink for loading importantinformation and anti-counterfeiting[J]. Nanoscale,2017,9(2): 491-496.[23]HSU P C, CHANG H T. Synthesis of high-quality carbon nanodots from hydrophilic compounds:Role of functionalgroups[J]. Chemical Communications, 2012, 48(33):3984-3986.[24]MEHTA V N, JHA S, SINGHAL R K, et al. Preparation of multicolor emitting carbon dots for HeLa cell imaging[J].New Journal of Chemistry, 2014, 38(12): 6152-6160.[25]张现峰,芦静波,王学梅. 温敏性碳量子点的快速制备、荧光性质及细胞成像应用[J]. 分析测试学报,2018, 37(2): 198-203.[26]LIU G,WANG X,HAN G,et al. Earth abundant colloidal carbon quantum dots for luminescent solarconcentrators[J]. Materials Advances,2020,1(2):119-138.[27]胡国文,乔玉玲. 叶酸修饰的碳量子点在体外癌细胞成像中的应用[J]. 应用化学, 2020, 37(9): 1003-1009.[28]朱永法,郑斌,姚文清,等. 电子能谱线形分析研究碳物种的化学状态[J]. 分析化学, 1999, 27(1): 10-13.[29]BAKER S N, BAKER G A. Luminescent carbon nanodots:Emergent nanolights[J]. Angewandte Chemie(International Ed in English),2010,49(38):6726-6744.[30]杨彩玲,赵国虎,张鸣,等.氮掺杂碳量子点荧光猝灭法测定柠檬黄[J]. 化学研究与应用, 2019, 31(7):1293-1298.[31]黄湘,周莉佳,粟小燕,等. 基于甘草酸的荧光纳米碳点的合成及性能研究[J]. 化学试剂, 2022, 44(8):1142-1147.(责编&校对刘钊)325。
晶体自范性和自生成模板法结合生长组装多级纳米结构_谢毅

570
中国科学技术大学学报
第 38 卷
acted as the suppo rt fo r the co nst ruction of rutile TiO 2 3D hollow nanostructures . F urthermo re , VOOH hollo w “ dandelions” w ere sy nthesized owi ng t o the planar sheet nature of the bui lding blo cks in the newphased VOOH and the in-si tu produced N 2 gas bubbles as t he templates t hat acted as the sheet-like nanouni t ssupport er . Also , tit anat e 3D t ubular hierarchit ect ures w ere successfully prepared undergoing t he self-produced template methodolog y coupled w it h precurso r tem plat ing approach based on the similar st rategy . T he appearance of tit anat e nanof lakes i s actually the o ut w ard em bodiment o f the internal crystal st ructure , w hile the sacri ficed t em plat ing ef fect of the int ermediate precurso r of T iO x Cl2 -2x ( EN ) y is w ell underst ood . Key words : crystal g ro w th ; self-limi tatio n prope rty ;self-produced t emplate st rategy ; t hree-dimensi onal hie ra rchi tectures ; cry st al st ruct ure
荧光定量PCR

聚合酶链式反应( PCR) 可对特定核苷酸片断进行指数级的扩增。
在扩增反应结束之后,我们可以通过凝胶电泳的方法对扩增产物进行定性的分析,也可以通过放射性核素掺入标记后的光密度扫描来进行定量的分析。
无论定性还是定量分析,分析的都是PCR 终产物。
但是在许多情况下,我们所感兴趣的是未经PCR 信号放大之前的起始模板量。
例如我们想知道某一转基因动植物转基因的拷贝数或者某一特定基因在特定组织中的表达量。
在这种需求下荧光定量PCR 技术应运而生。
实时定量PCR技术,是指在PCR反应体系中加入荧光基团,利用荧光信号积累实时监测整个PCR进程,使每一个循环变得“可见”,最后通过Ct值和标准曲线对样品中的DNA (or cDNA) 的起始浓度进行定量的方法。
实时荧光定量PCR是目前确定样品中DNA (或cDNA) 拷贝数最敏感、最准确的方法。
Real-Time PCR and Conventional PCR常规PCR ProcessIn theory, product accumulation is proportional to 2n, where n is the number of amplification cycle repeatsReality vs. Theory Amplification is exponential, but the exponential increase is limited:-A linear increase follows exponential-Eventually plateaus常规PCR方法的局限性分析:-无法对起始模板准确定量,只能对终产物进行分析-必须在扩增后用电泳方法分析,费时费力而且EB有毒-无法对扩增反应实时检测定量的最佳时期Quantitative information comes from monitoringthe early stages of amplification荧光定量PCR和常规PCR技术的区别常规PCR是通过电泳对扩增反应的最终产物进行定性分析(定量不准确);荧光定量PCR是在PCR反应体系中加入荧光基团,利用荧光信号积累实时监测整个PCR进程,使每一个循环变得“可见”,通过Ct值和标准曲线对样品中的DNA (or cDNA) 的起始浓度进行定量的方法(准确定量)。
Dept.ofComputerScience
Introduction
of the problem) can be reduced to the same problem for a di erent, normally smaller instance, called the kernel of the program. Second. the same works propose a novel graph representation of logic programs, called Extended Dependency Graphs (EDG), which allowed us to characterize stable models of a program in terms of distinguished 2-colorings of its EDG. These colorings are called admissible. In other words, there is a one-to-one correspondence between the answer sets of a kernel program Ker( ) and admissible 2-colorings of the related Extended Dependency Graph EDG(Ker( )). Therefore, the ASP problem is rephrased in terms of nding particular colorings of directed graphs; this problem will be called Admissible Coloring Problem (ACP). Since the ASP problem is NP-complete, so is ACP, hence exact solutions to ACP cannot be found in polynomial time (of course, in the worst case). Our approach, described in the rest of the paper, is to relax the problem to that of optimizing a suitable objective function (called tness from now on). More precisely, we try to solve ACP by means of a continuous model of computation. We propose: 1. to relax ACP to combinatorial optimization problem, by associating each instance of the problem to a suitable tness function, so that admissible colorings are exactly global maxima of every tness function, 2. to maximize a tness function by using the genetic model proposed in (Bertoni et al., 2000). In this model, the tness function corresponds to a discretetime system whose attractors are local maxima of the tness function itself. In this Section we show a reduction from ASP computation to a particular type of graph coloring introduced in (Brignoli et al., 1999). The rst step consists in reducing the original program to a new, smaller program Ker( ) which is equivalent to the original as far as existence and number of answer sets are concerned.
LUNARPRODIGY

GE HealthcareGE imagination at workLunar ProdigyDirect-Digital DensitometryProdigy.A breakthrough in fracture risk assessment.At GE Healthcare, we’re firmly committed tofinding new and more effective ways to helpphysicians diagnose osteoporosis and assessfracture risk.That’s why we developed the innovativeProdigy – the first system designed to lookbeyond bone mineral density to become themost complete bone assessment tool everdevised. Prodigy’s improved technologydetects subtle bone changes in a variety ofclinical conditions and provides Advanced HipAnalysis and Lateral Vertebral Assessment.Utilizing Direct-digital detector technology,Prodigy delivers rapid scans, near radio graphicimaging and dose efficiency three to five timesbetter than existing fan beam systems. And itscomprehensive capabilities cover a completerange of applications.Prodigy’s unique software platform, enCORE™,optimizes productivity with automation break-throughs that save time and ensure consistentresults. And paperless digital reporting makesdensitometry results accessible quickly andeasily.Looking ahead, Prodigy links you to the futurewith extensive options for connecting withlocal facility networks and the Internet, forinstant integration of bone assessment resultsacross your entire healthcare system.The precise depth and location of bone canvary significantly from patient to patient,depending on patient age, size and shape.The wide-angle design used by competitivefan beam systems is subject to distortioncaused by magnification. This makes itdifficult to determine the true bone areaand geometry with any degree of accuracy.With these technological limitations,competitive systems can only estimate themineral content, geometry and size of bonebased on an approximation of its depth.Prodigy’s unique technology eliminates all ofthis guesswork. Its narrow-angle fan beammakes multiple passes across the patient toacquire multiple images, with each imageoverlapping the previous one.Then, Multi-View Image Reconstruction – animaging technique perfected in computedtomography, or CT – slides these overlappingimages together for a perfect match.The result: the exact depth of the bone isdetermined accurately in every patient,ensuring precise, reliable, consistentmeasurement of area, bone mineral contentand geometry such as hip axis length (HAL).“HAL has been demonstrated in several prospectivestudies to predict fractures. Each centimeter (10%)increase in HAL increases hip fracture risk by 50-80%,depending on the study. Precision error of HAL on theProdigy, determined from 43 subjects scanned multi-ple times, was 0.7%. While HAL cannot be viewed asa stand-alone clinical predictor, it can potentially pro-vide utility in conjunction with BMD to identify high-risk patients.”Kenneth G. Faulkner, Ph.D.Chief ScientistGE HealthcareComplete accuracyfrom any angle.WIDE-ANGLE FAN BEAM NARROW-ANGLE FAN BEAMSINGLE SWEEPMULTI-VIEWBy reconstructing multiple images acquired by multiplepasses of its narrow-angle fan beam, Prodigydetermines the exact location, and the precise size andshape, of the spine and hip to accurately determinebone area, bone mineral content and bone geometry,such as hip axis length.Wide-angle fan beam designs used by competitivesystems don’t correct for magnification. Differencesin bone depth across patients, or even changes inpositioning of the same patient, are projected asdifferent sizes on the detector, making it difficult toaccurately measure hip axis length.Prodigy’s narrow-angle fan beam reducesdistortion due to magnification. The multi-view imagereconstruction algorithm discerns the bone’s truedepth, for accurate determination of bone mineralcontent, size and geometry.Expanded clinical utility .Right down to the bone.Evidence continues to mount that there isadditional clinical information to be derivedfrom femoral bone density measurements –if the necessary analysis software wereavailable.Now, for the first time ever, the GE LunarProdigy delivers these remarkableanalytical capabilities. Advanced Hip AnalysisThe Prodigy provides the first majoradvances in femoral densitometry analysissince the introduction of DXA system soft-ware in 1987. These advances are includedin the new Advanced Hip Analysis software,available exclusively on the Prodigy.Advanced Hip Analysis includes all thestandard femoral regions of interest thathave been previously available, but nowincludes the addition of other key measure-ments and assessments:• Hip Axis Length (HAL) has been demon-strated in prospective studies as aneffective adjunct to femur bone densityin predicting fracture risk.• DualFemur ™Assessment identifies theweakest femur while improving precisionover single-femur measurements.• New diagnostic regions of interest such asthe upper neck can now be accuratelyassessed.• Femur Strength Index : A unique Indexcombining geometrical parameters andBMD for a better assessment.“Advanced Hip Analysis combines several advances in DXA measurement of the proximal femur into a single software package. It maintains the conventional femoral regions of interest, but with a precision previously only obtained at the spine. This feature alone represents a significant advance in femoral densitometry.”Kenneth G. Faulkner, Ph.D.Chief Scientist GE HealthcareDual femur assessmentSingle Femur Dual Femur Precision Precision Total Femur Region 1.0% CV 0.6% CVLateral Vertebral Assessment-quantifiedProdigy’s Lateral Vertebral Assessment-quantified (LVAq) improves fracture riskassessment by identifying and quantifyingexisting vertebral fractures – which at leastdouble future fracture risk regardless of apatient’s bone density.LVAq subtracts soft-tissue artifacts forbetter bone images and easier visualassessment. In addition, reference data isprovided for vertebral height and A/P ratio,and the Morphometry Wizard feature allowsfor easy step-by-step quantification.Total Body AssessmentThe ultimate in skeletal assessment, theTotal Body exam provides both bone densityand body compositon (i.e., % fat) results.With an FDA-approved, gender-matcheddatabase, total body results expand theutility beyond osteoporosis managementwhere the combined results are used in avariety of secondary conditions, or whenspine/hip measurements are compromised.Orthopedic AnalysisThe enCORE software platform facilitatesaccurate, customized analysis. Hipprostheses, metal fastenings and otherartifacts are easily excluded from theanalysis region for accurate bone densityresults. Customized regions of interest ofany shape and size can be quickly definedfor greater utilization, and customizedenCORE analysis assures precise resultswhile expanding your clinical and researchteral Vertebral Assessment-quantifiedTotal Body AssessmentOrthopedic AnalysisOneVision reporting automatically generatesa single, concise clinical report for all scansperformed during a patient's visit. Standardtext can be customized with patient-specificcomments and changes to save time andeliminate transcription costs.Loaded with features for faster, easier and more convenientoperation, the Prodigy will streamline performance and throughput in the busiest practices, clinics and departments.Revolutionary enCORE software optimizes productivity.Based on Windows XP ® Professional, GE Lunar’s unique enCOREsoftware provides true Windows capabilities, including right-clickmenus, drag-and-drop editing and integration with other applica-tions. Multiple scans can also be opened simultaneously. enCORE’s intuitive graphical interface provides ease-of-use, fast throughput and automation that frees the operator for other tasks.One-step AutoAnalysis delivers fast, precise, consistent results.Excellent precision, or reproducibility, is key to detecting smallchanges in bone density. enCORE’s AutoAnalysis calculates results in just one keystroke, for fast, precise analysis. Only GE Lunaroffers true one-button analysis, eliminating operator variability,subjective decisions and inconsistent analysis in over 90% of scans.OneVision scanning and reporting saves time and costs.The Prodigy automatically combines scans of the spine and bothhips into one comprehensive exam, acquired in one process andevaluated in one analysis. Rather than receiving multipleassessment reports, the referring physician receives a single,consolidated report that combines all risk assessment analysesfor greater convenience and time savings.No speed limit.MeasureAnalyzeA state-of-the-art fracture risk assessment tool, Prodigy will serve your needs exceptionally well today – and continue serving those needs just as effectively far into the future.Digital connectivity and network integration provide fast, widespread communications. Utilizing Prodigy’s enCORE software, bone density results can be digitally transmitted throughout your healthcare enterprise – or anywhere in the world via the Internet – for viewing on remote workstations.Exclusive DICOM and HL7 compatibility ensures maximum connectivity.A Prodigy exclusive, DICOM seamlessly integrates densitometry results with Radiology Information Systems (RIS) and Picture Archival and Communication Systems (PACS). Digital densitometry results may then be viewed on remote DICOM review stations. With Worklist, patient information can also be received directly from scheduling applications via HL7 or DICOM for faster throughput and reduced data entry errors.TeleDensitometry™speeds reports toreading or referring physicians.With TeleDensitometry, digital paperless reports are sent as faxes or as simple attachments to standard email messages that can be viewedon any personal computer without the need for special software. The digital report contains all the information found in the standard hard-copy report, including patient information, high-resolution images, a reference graph, a clinical results table and a trending graph to monitor changes over time.GE Continuum protects your investment.To keep your bone densitometry and assessment capabilities current through rapid advances in technology, new features and applications can be easily added to your Prodigy as economical software upgrades, ensuring you of state-of-the-art system perfor-mance for years to come.A platform for productivity. Today and tomorrow.Comprehensive Clinical Capabilities• Advanced Hip Analysis• Lateral Vertebral Assessment-quantified • Total Body Assessment• AP Spine• Forearm• Orthopedic Analysis• Ultra Low-Dose PediatricsFor more than 100 years, healthcare providers worldwide have relied on GE Healthcare for medical technology,services and productivity solutions.So no matter what challenges yourhealthcare system faces – you can alwayscount on GE to help you deliver the highest quality healthcare.For details, please contact your GE representative today.GE imagination at workGE HealthcareInternet – info.lunar@GE Medical Systems Lunar, Europe Kouterveldstraat 20B-1831 Diegem BelgiumPhone: +32-2-719 72 03Fax: +32-2-719 72 05GE Medical Systems, A General Electric Company, going to market as GE Healthcare.General Electric Company reserves the right to make changes in specifications and features shown herein, or discontinue the product described at any time without notice or obligation.Contact your GE Representative for the most current information.SL270EU 11/04 © 2004 GE HealthcareTechnical SpecificationsAvailable Applications and Options AP Spine FemurDualFemurAdvance Hip Assessment with Hip Axis Length, Cross Sectional Moment of Inertia and Femur Strength Index Total Body*Body Composition* (with fat/lean assessment)Dual Energy Vertebral Assessment (DVA)ForearmLateral Spine BMDOrthopedic Hip Analysis Pediatric*Infant Total Body***Small Animal OneVision OneScanComposer with 10-year Fracture Risk assessment Practice Management Report Dexter PDA interface software**Computer Assisted Densitometry (CAD)TeleDensitometry**DICOM (Worklist -Color Print and Store)** Multi User Data Base Access (3/10)**HL7 Bidirectional interface **enCORE™ Software PlatformAdvanced intuitive graphical interfaceMultiple Patient directories with Microsoft Access ®databaseSmartFan™ for scan window optimization and dose reductionAutomated Scan mode selection AutoAnalysis™ for a better precision Customized Analysis for clinical flexibility Exam Comparison processBMD or sBMD results (BMC and Area)Extensive Reference Data> 12,000 subjects – NHANES and several Regional Lunar Reference Data User defined Reference PopulationT-score, Z-score, % Young-Adults and % Age-Match Automated WHO Background evaluationPatient trending with previous exam importation Multiple languages available Multimedia Online HelpTypical Scan Time and Radiation Dose at the best Precision AP Spine : 30 sec : 0.037mGy (< 1%CV) Femur : 30 sec : 0.037 mGy (< 1%CV)Total Body/ Body Comp. : 4 min 30sec: 0.0003 mGy (< 1%CV)Calibration and Quality AssuranceAutomated test program with complete mechanicalsand electronics tests and global measurement calibration Automated QA Trending with complete storageScanning MethodNarrow FanBeam (4,5°angle) with SmartFan, MVIR and TruView algorithmsX-ray characteristicsConstant potential source at 76kV Dose efficient K-edge filterDetector technologyDirect-Digital CZT (Cadmium Zinc Telluride) detector Energy sensitive solid state Array MagnificationNone - Object-plane measuredDimensions (L x H x W) and weight 263 x 111 x 128 cm - 272 kg (Full)202 x 111 x 128 cm - 254 kg (Compact)Vinyl table padExternal shieldingNot required : X-ray safety requirements may vary upon destination. Please inquire with local regulatory authorities.GE Healthcare recommends consulting your local regulatory agency to comply with local ordinances.Environnemental requirements Ambient temperature: 18-27°C Power: 230/240 VAC ±10%, 10A,50/60 HzHumidity: 20% - 80%, non-condensingComputer workstationWindows XP ®ProfessionalIntel processor computer, printer and monitor Contact GE Healthcare or our local distributor for the detailed current configuration and optional hardware.* on full size table only** networking is under the user’s responsibility *** for research only。
- 1、下载文档前请自行甄别文档内容的完整性,平台不提供额外的编辑、内容补充、找答案等附加服务。
- 2、"仅部分预览"的文档,不可在线预览部分如存在完整性等问题,可反馈申请退款(可完整预览的文档不适用该条件!)。
- 3、如文档侵犯您的权益,请联系客服反馈,我们会尽快为您处理(人工客服工作时间:9:00-18:30)。
TECHNICAL ARTICLEOne-step synthesis of Ag–reduced graphene oxide nanocomposites and their surface-enhanced Raman scattering activityS.Lin,X.S.Zhao,Y.F.Li,C.Liang,a)K.Huang,Y.Sheng,H.Wang,C.X.Ye,X.Xu,Y.F.Zhou,D.Y.Fan, Y.F.Shang,H.J.Yang,R.Zhang,Y.G.Wang,and M.LeiSchool of Science,Beijing University of Posts and Telecommunications,Beijing100876,China(Received20April2014;accepted17June2014)Ag–reduced graphene oxide(Ag/rGO)nanoparticle composites were synthesized through a facileone-step hydrothermal reaction using GO and silver carbonate(Ag2CO3)as raw materials.The homo-geneous silver nanospheres with an average size of50nm well dispersed on the surface of rGO wereobtained without other additives.During the formation process,GO both promotes the dispersion ofAg2CO3in aqueous solution and acts as the substrate of silver cations,and the hydrolysis of Ag2CO3provides silver cations and alkaline condition.Moreover,GO further serves as reducing agent to gen-erate elemental silver in the alkaline condition.The as-prepared materials exhibit excellent surface-enhanced Raman scattering activities when used to detect the Raman signals of R6G absorbed onthe Ag/rGO substrate.©2014International Centre for Diffraction Data.[doi:10.1017/S0885715614000608]Key words:Ag–reduced graphene oxide nanoparticle composites,chemical synthesis,surface-enhanced Raman scatteringI.INTRODUCTIONGraphene and its derivatives have attracted considerable attention owing to their remarkable electrical,optical,thermal, chemical,and mechanical properties.Graphene oxide(GO) is a strongly oxidized form of graphene,retaining the basic framework of graphene and containing abundant oxygen-containing functional groups(Li and Richard,2008;Liu et al.,2011;Wang et al.,2013a,2013b).The interesting struc-ture of GO confirms highly hydrophilia and manipuility to construct a series of nanocomposites for many applications (Chen et al.,2011).As a noble metal,Ag has been the focus of scientific research,possessing excellent optical property and outstand-ing catalytic performance.Interaction between graphene and Ag can improve the surface-enhanced Raman scattering (SERS)activity of Ag–graphene oxide composites(Ag/GO). Considerable attention has been focused on the composites. However,most of the methods still involved multi-steps such as preparation of functional GO(Kumar et al.,2013) and required strong reducing agents,including ethylene glycol,hydrazine,sodium borohydride,and methanol.These synthesis methods were complicated and risky for the environ-ment(Xu et al.,2009;He et al.,2012).In this study,the Ag–reduced graphene oxide(Ag/rGO)composites with uniform size and good dispersity were obtained through an environ-mental friendly one-step hydrothermal route using GO and sil-ver carbonate(Ag2CO3)as the raw materials exclusively.The structure,mechanism,and Raman properties of the compo-sites were investigated in detail.II.EXPERIMENTALThe crucial raw materials GO and Ag2CO3were prepared according to the literature(Huang et al.,2014a,2014b)and Dong et al.(2013),respectively.The Ag/rGO composites were fabricated via a one-step hydrothermal method.In a typi-cal procedure,10mg Ag2CO3powder was added into the cal-culated amount of GO solution in a15ml teflon-sealed autoclave and corresponding amount of deionized water was added to reach80%of autoclave capacity.The mixture should be dispersed by the ultrasonic processing for1h and vigorous stirring for4h.Then the autoclaves would be transferred into oven at80°C for8h and cooled down to room temperature naturally.The products were rinsed with deionized water and ethanol for several times,andfinally dried in vacuum at 40°C for12h.The silver colloid was prepared through a simple reaction reported by Qian et al.(2013).For the detection of SERS activity,a certain amount of various concentrations of solution R6G were mixed with the suspension of Ag/rGO and were allowed to stay for4h after the ultrasonic dispersion process. Finally,the mixture was dropped on the silicon slide and dried for the SERS detection.The structure properties were observed by the X-ray dif-fraction(XRD,PANalytical)andfield emission scanning elec-tron microscope(FESEM,S-4800,Hitachi).The atomic compositions and SERS activity were detected by Raman spec-troscopy(Horiba Jobin Yvon,France),Fourier-transformed infrared spectra(FTIR,Thermo Nicolet),and X-ray photo-electron spectroscopy(XPS,Perkin-Elmer,Al Kαradiation). III.RESULTS AND DISCUSSIONThe phase structure of the product wasfirst confirmed by the XRD.As shown in Figure1(a),GO displays a diffractiona)Author to whom correspondence should be addressed.Electronic mail:cliang@356Powder Diffraction29(4),December20140885-7156/2014/29(4)/356/5/$18.00©2014JCPDS-ICDD356peak at 11.9°,corresponding to the (001)-plane of the hexago-nal graphite structure (Xu et al.,2009;Qian et al.,2013),and the diffraction peaks of prepared Ag 2CO 3agree well with those of the standard monoclinic Ag 2CO 3(JCPDS No.26-0339).Four main peaks at 2θ=37.9°,44.1°,64.3°,and 77.2°emerge,which correspond to the (111),(200),(220),Figure 1.(Color online)(a)XRD patterns of GO,Ag 2CO 3,and Ag/rGO;(b –e)SEM images of pure Ag 2CO 3,GO sheets,hydrothermal treated pure Ag 2CO 3,and Ag/rGO composites,respectively.Figure 2.(Color online)(a)Raman,(b)FTIR spectra of GO and Ag/rGO,(c,e)XPS spectra of C1s peaks,and (d,f)Ag3d peaks for GO and Ag/rGO,respectively.357Powder Diffr.,Vol.29,No.4,December 2014One-step synthesis of Ag –reduced graphene oxide nanocomposites357and(311)planes of the cubic Ag(JCPDS no.99-0094), respectively,indicating that the metallic Ag is formed after the hydrothermal process.However,no obvious diffraction peaks of rGO are observed,which may be because of the relatively low content of rGO or the exfoliation of rGO(Xu et al.,2009).The morphology of the product was examined by FESEM.The rod-like Ag2CO3particles[Figure1(b)]display a relatively smooth surface and uniform size,and GO sheets [Figure1(c)]exhibit the typical crumpled structure.As shown in Figure1(d),no Ag nanospheres emerge in the absence of GO sheets.Inspiringly,the rod-like particles disap-pear,whereas the new sphere-like particles with average size of50nm covered with rGO sheets[Figure1(e)]generate after the GO-assisted hydrothermal reaction.It is believed that the anisotropic growth is inhibited with the wrapping GO,leading to the formation of Ag spheres.To further investigate the formation process,correspond-ing Raman,FTIR,and XPS spectra were measured.Two prominent peaks[Figure2(a)]correspond to D band about 1330cm−1and G band about1590cm−1for GO sheets are observed,which is assigned to the disorder originating from functional groups and E2g mode of C sp2atoms,respectively. The intensity ratio I D/I G of GO is1.13.However,the I D/I G of Ag/rGO composites decreases to1.02after the hydrothermal treatment.It is suggested that the oxygen-containing func-tional groups decrease and the GO is partially reduced into rGO(Kumar et al.,2013;Liu et al.,2013).In addition,the intensities of the D and G bands of Ag/rGO composites obviously increase in comparison with those of GO,which is because of the SERS activity(Ma et al.,2011;Huang et al.,2014a,2014b).The FTIR spectrum of GO and Ag/rGO composites is shown in Figure2(b).The characteristic absorption peaks of GO appear at3436,1713,1596,1401,and1027cm−1,corre-sponding to the–OH stretching vibrations,C=O stretching of COOH groups,sp2C–C bonds,O–H deformations of the C–OH groups,and C–O stretching vibrations,respectively (Yuan et al.,2012).The most obvious difference between the two spectrums is the intensity weakening of the vibration of C–OH groups,which reveals that C–OH groups play an important role for the reduction process of silver cations to metallic silver.To investigate the inner structure and the formation mech-anism,XPS spectra of GO and Ag/rGO composites are exhib-ited in Figures2(c)–2(f).The deconvoluted peaks of C1s XPS spectrum of GO[Figure2(c)]arising from284.7,286.9,and 288.6eV indicate the components of C–C/C=C(graphene bonding),C–O(hydroxyl and epoxy),and C=O(carboxyl), respectively(Yuan et al.,2012).As to Ag/rGO composites [Figure2(e)],the intensity of oxygen-containing functional groups decreases significantly.The elimination of hydroxyl, epoxyl,and carboxyl confirms the reduced process of GO to rGO and the important role of these functionalgroups.Figure3.(Color online)Schematic illustration of the mechanism for Ag/rGO composites.358Powder Diffr.,Vol.29,No.4,December2014Lin et al.358Meanwhile,two new peaks at 368.4and 374.4eV can be detected corresponding to the binding energies of Ag3d 3/2and Ag3d 5/2in the Ag3d XPS spectrum of Ag/rGO compo-sites [Figure 2(f )].The separation of spin-energy is measured to be 6eV,further con firming the formation of metallic silver (Ma et al.,2011).The consistent results illustrate that GO have played an important role during the hydrothermal formation process of Ag/rGO composites.First,GO promotes the dispersion of Ag 2CO 3in aqueous solution.The large number of functional groups can adsorb the particles in solution,making sure the Ag 2CO 3suf ficient decentralize.Another point,GO can be treated as a consumer of silver cations via combination by electrostatic adsorption and π–πorbitals interaction.The decreasing concentration of silver cation coupling with high temperature of 80°C,promotes hydrolysis of Ag 2CO 3to gen-erate Ag +,HCO 3−,and OH −,resulting in the alkaline con-dition.Besides,the functional groups,acting as anchor sites of silver cations,enable the subsequent in situ formation of Ag nanoparticles (Pasricha et al.,2009).Furthermore,the functional groups play the role of reducing agent.During the hydrothermal process,the hydroxyl groups based on the hexagonal basal plane are equivalent to phenolic entity in alkaline condition,with a protonation to generate strongly activated phenolate anions and achieve the electrophilic aro-matic substitution reaction to generate elemental silver by transferring electrons to silver cations (Manuel et al.,2005).In addition,GO is reduced to rGO,forming Ag/rGO compo-sites.As Figure 3shows,with the interaction of oxygen-containing functional groups,the silver ions are adsorbed on the rGO sheets and form Ag nanoparticles to achieve one-step synthesis in the absence of additional reductant.The SERS activity of as-prepared samples was further tested by R6G as the probing molecules.As Figure 4(a )shows,the strong characteristic Raman peaks of R6G on the Ag/rGO substrate at 614,777,921,1132,1186,1312,1364,1510,1579,and 1650cm −1observed in the spectra A are in good agreement with the previous reports.By contrast,the SERS signals of R6G on the silver colloid are signi ficantly reduced.Moreover,we cannot find any characteristic peaks of R6G on the GO bined with the above analysis,we consider that the better SERS activity of Ag/rGO results from the aggregated structures of Ag nanoparticles coupling with rGO.SERS spectra of R6G with different concentrations on Ag/rGO are displayed in Figure 4(b ).It is obvious that theSERS signals decrease with decreasing the concentration of R6G,and the spectrum 3becomes similar to rGO with further decrease.However,the bands at 614,777,and 921cm −1are still sensitive to detect the concentration of R6G.IV.CONCLUSIONSIn summary,Ag/rGO composites have been successfully fabricated through a facile one-step hydrothermal method using GO and Ag 2CO 3as starting reactants.The GO sheets are identi fied to serve as the dispersant,stabilizer,and redu-cing agent,whereas the Ag 2CO 3provides silver cations and alkaline condition.Silver cations are reduced into metallic Ag by hydroxyl groups mainly in the alkaline condition,and then causing the generation of rGO because of the decrease of oxygen-containing functional groups.The as-prepared Ag/rGO composites are testi fied to be an excellent substrate to probe molecules.The Ag/rGO composites exhibit better SERS activity than Ag colloid owing to the strong inter-action of Ag and rGO.ACKNOWLEDGEMENTSThis work was financially supported by the Program for New Century Excellent Talents in the University (grant no.NCET-13-0684),Fund of State Key Laboratory of Information Photonics and Optical Communications (Beijing University of Posts and Tele-Communications,People ’s Republic of China),National Natural Science Foundation of China (Grant numbers 61376018,51102019,61177085,61377097,61274012,and 51272031).Chen,J.L.,Zheng,X.L.,Wang,H.,and Zheng,W.T.(2011).“Grapheneoxide –Ag nanocomposite:in situ photochemical synthesis and application as a surface-enhanced Raman scattering substrate,”Thin Solid Films 520,179–185.Dong,H.J.,Chen,G.,Sun,J.X.,Li,C.M.,Yu,Y.G.,and Chen,D.H.(2013).“A novel high-ef ficiency visible-light sensitive Ag 2CO 3photocatalyst with universal photodegradation performances:simple synthesis,reaction mechanism and first-principles study,”Appl.Catal.B:Environ.134,46–54.He,Y.,Cui,H.,and Mater,J.(2012).“Synthesis of highly chemiluminescentgraphene oxide/silver nanoparticle nano-composites and their analytical applications,”J.Mater.Chem.22,9086–9091.Huang,K.,Lei,M.,Wang,Y.J.,Liang,C.,Ye,C.X.,Zhao,X.S.,Li,Y.F.,Zhang,R.,Fan,D.Y.,and Wang,Y.G.(2014a ).“GreenhydrothermalFigure 4.(Color online)(a)SERS spectra of R6G (10−6M)solution on the substrate of Ag/rGO (A),Ag colloids (B),and rGO (C).(b)SERS spectra of R6G of various concentrations on the Ag/rGO substrate.359Powder Diffr.,Vol.29,No.4,December 2014One-step synthesis of Ag –reduced graphene oxide nanocomposites359synthesis of CeO2NWs-reduced graphene oxide hybrid with enhanced photocatalytic activity,”Powder Diffr.29,8–13.Huang,K.,Li,Y.H.,Lin,S.,Liang,C.,Wang,H.,Ye,C.X.,Wang,Y.J., Zhang,R.,Fan,D.Y.,Yang,H.J.,Wang,Y.G.,and Lei,M.(2014b).“A facile route to reduced graphene oxide-zinc oxide nanorod composites with enhanced photocatalytic activity,”Powder Technol.257,113–119. Kumar,S.V.,Huang,N.M.,Lim,H.N.,Marlinda,A.R.,Harrison,I.,and Chia,C.H.(2013).“One-step size-controlled synthesis of functional gra-phene oxide/silver nanocomposites at room temperature,”Chem.Eng.J.219,217–224.Li,D.and Richard,B.K.(2008).“Graphene-based materials,”Science320, 1170–1171.Liu,L.,Liu,J.C.,Wang,Y.J.,Yan,X.L.,and Sun,D.D.(2011).“Facile synthesis of monodispersed silver nanoparticles on graphene oxide sheets with enhanced antibacterial activity,”New J.Chem.35,1418–1423. Liu,P.B.,Huang,Y.,and Wang,L.(2013).“Ordered mesoporous carbon-reduced graphene oxide composites decorating with Ag nanoparticles for surface enhanced Raman scattering,”Mater.Lett.97,173–176. Ma,J.Z.,Zhang,J.T.,Xiong,Z.G.,Yong,Y.,and Zhao,X.S.(2011).“Preparation,characterization and antibacterial properties of silver-modified graphene oxide,”J.Mater.Chem.21,3350–3352.Manuel,J.M.,Paul,R.K.,and Michael,T.B.(2005).“Binding interactions ofmono-and diatomic silver cations with small alkenes:experiment and the-ory,”Int.J.Mass Spectrom.241,109–117.Pasricha,R.,Gupta,S.,and Srivastava, A.K.(2009).“A facile andnovel synthesis of Ag–graphene-based nanocomposites,”Small5,2253–2259.Qian,Z.J.,Cheng,Y.C.,Zhou,X.F.,Wu,J.H.,and Xu,G.J.(2013).“Fabrication of graphene oxide/Ag hybrids and their surface-enhanced Raman scattering characteristics,”J.Colloid Interface Sci.397,103–107.Wang,P.,Wang,J.,Wang,X.F.,Yu,H.G.,Yu,J.G.,Lei,M.,and Wang,Y.G.(2013a).“One-step synthesis of easy-recycling TiO2–rGO nano-composite photocatalysts with enhanced photocatalytic activity,”Appl.Catal.B:Environ.132,452–459.Wang,P.,Wang,J.,Ming,T.S.,Wang,X.F.,Yu,H.G.,Yu,J.G.,Wang,Y.G.,and Lei,M.(2013b).“Dye-sensitization-induced visible-lightreduction of graphene oxide for the enhanced TiO2photocatalytic per-formance,”ACS Appl.Mater.Interfaces5,2924–2929.Xu,C.and Wang,X.(2009).“Fabrication offlexible metal-nanoparticlefilmsusing graphene oxide sheets as substrates,”Small5,2212–2217.Yuan,W.H.,Gu,Y.J.,and Li,L.(2012).“Green synthesis of graphene/Agnanocomposites,”Appl.Surf.Sci.261,753–758.360Powder Diffr.,Vol.29,No.4,December2014Lin et al.360。