聚合物分析DSC
交联聚合物玻璃化转变温度dsc曲线

交联聚合物玻璃化转变温度dsc曲线1. DSC曲线显示出交联聚合物的玻璃化转变温度。
The DSC curve shows the glass transition temperature of the cross-linked polymer.2.玻璃化转变温度是材料从玻璃态向橡胶态转变的温度。
The glass transition temperature is the temperature at which a material transitions from a glassy state to a rubbery state.3.在DSC曲线上,玻璃化转变温度对应于峰值处的温度。
On the DSC curve, the glass transition temperature corresponds to the temperature at the peak.4.玻璃化转变温度是材料性能的重要指标之一。
The glass transition temperature is one of the important parameters for material properties.5.通过DSC测试可以准确测定材料的玻璃化转变温度。
The glass transition temperature of the material can be accurately determined by DSC testing.6.低玻璃化转变温度的交联聚合物具有较好的柔韧性。
Cross-linked polymers with low glass transition temperatures have good flexibility.7.高玻璃化转变温度能够提高材料的刚性和稳定性。
A high glass transition temperature can increase the rigidity and stability of the material.8.玻璃化转变温度的测定可以帮助优化材料的加工工艺和应用性能。
DTA、DSC、TG、DTG测试方法和表征

颗粒过大的试样会爆裂而造成TG曲线 形状异常。 样品的装填方式对TG有影响,主要是 改变了热传导及质量传递性能。样品 装填越紧密,接触越好,有利于热传 导。
(3)试样性质的影响
试样的比热、导热性和反应热对热重 曲线都有影响
3.4TG, DTG在高分子科学与工程中应用
1、高分子材料热稳定性的评定
如图,比较了 五种高分子 材料的相对 热稳定性。 这种方法准 确可靠,目 前常被采用。
2、高分子材料的添加剂的分析
应用TG法分析高分子材 料中的各种添加剂,包 括有机的和无机的添加 剂,有着独特之处,比 一般的方法要简单方便。 图为:PVB中被快速测定 增塑剂含量。 1.萃取了增塑剂的PVB 3. PVB+增塑剂 2.PVB
我国第一台商品热天平是在60年代初由北京 光学仪器厂研制生产的
2.1.1热重法的定义
热重法是在程序控制温度下,测量物质 的质量与温度或时间的函数关系的一种技 术
W=f(T或t) 式中:W为物质质量,T为温度,t为时间
热重曲线或TG曲线
TG曲线纵坐标表示重量(mg),向下表示重 量减少,向上表示重量增加;横坐标表示温度 T(℃或K)或时间t,从左往右表示T或t增加
(4)共聚物结构的研究
用分析手段测定共聚物的热转变,可借以阐明 无规,嵌段共聚物的形态结构。
在差热曲线出现两个峰,表明是嵌段乙丙共聚物,一个峰
表示聚乙烯的熔点,另一个峰表示聚丙烯的熔点。只有 一个峰的是无规共聚物。 (a)嵌段共聚物(49%丙 烯);A乙烯B丙烯(b)无规共聚物 (15%丙烯)
(5)研究纤维的拉伸取向
dH/dt为DSC谱的纵坐标, dT/dt为升、降温 速率(在DSC实验中一般为定值),故纵 坐标的高低表明了此时样品比热的相对大 小。
dsc结晶度的测定方法

dsc结晶度的测定方法
DSC(差示扫描量热法)是测定聚合物结晶度的一种常用方法。
通过测试聚合物的DSC曲线,可以得到熔融曲线和基线包围的面积,从而换算成热量,即为聚合物中结晶部分的熔融热。
具体操作方法如下:
1. 测试聚合物的DSC曲线,记录熔融峰的热量。
2. 计算熔融峰的热量与100%结晶性聚合物的理论热焓之比,乘以100,即可得到聚合物的结晶度。
通过这种方式,可以获得聚合物结晶度对熔点、密度、磁导率和储能模量等物理性能的影响,有助于更好地了解聚合物的性能。
聚合物三种Tg测试方法(DSC,DMA,TMA)

聚合物三种Tg测试⽅法(DSC,DMA,TMA)The thermal properties of polymeric materials are important to the function of components and assemblies that will operate in warm environments. Glass Transition Temperature (referred herein as Tg) is the point at which a material goes from a hard brittle state to a soft rubbery state. Amorphous polymers only have a Tg. Crystalline polymers exhibit a Tm (melt temperature) and typically a Tg since there is usually an amorphous portion as well ("semi"-crystalline). Identifying the Tg of polymers is of interest for various reasons, but is most often used for quality control and research and development.There are three general techniques for measuring Tg:Differential Scanning Calorimetry (DSC) – This is probably the most traditional and common technique for most polymeric materials. Simply stated, DSC utilizes a heat flow technique and compares the amount of heat supplied to the test sample and a similarly heated "reference" to determine transition points. Tg is typically calculated by using a half-height technique in the transition region. The heating rate and sample heat history are a couple of factors that may affect the test result. Depending on the equipment capability, DSC can be used for a wide range of thermoplastic and thermoset polymers. For materials that have broad Tg's, DSC may not be sensitive enough to show a large enough transition for calculation purposes.Thermal Mechanical Analysis (TMA) – TMA is used to measure Coefficient of Thermal Expansion (CTE) of polymers. TMA uses a mechanical approach for measuring Tg. A sensitive probe measures the expansion of the test specimen when heated. Polymers typically expand as temperature is increased. From the expansion curve, a CTE canbe calculated over a temperature range. If a material goes through a Tg during a TMA test, the curve shape changes significantly and Tg can be calculated by using an onset technique. Amorphous polymers would typically not utilize the TMA approach because the material would soften to the point where the probe penetrates into the sample. Samples that remain somewhat rigid through Tg would be good candidates for Tg by TMA. The heating rate chosen can affect the Tg. Dynamic Mechanical Analysis (DMA) – DMA is probably the most sensitive technique (of the discussed methods)for Tg analysis. DMA measures the response of a material to an applied oscillatory strain (or stress), and how that response varies with temperature, frequency, or both. DMA is able to separate and measure the elastic and viscous components of polymers. How the material responds to the temperature increase can be illustrated by various means on the DMA graph. There are three typical approaches for reporting Tg by DMA. All techniques are viable but may yield different results. Several results may include: 1) Onset of the storage modulus curve; 2) Peak of the loss modulus curve; and/or 3) Peak of the Tan Delta curve.There also are different modes of oscillation used for DMA such as torsional, single and dual cantilever, tension, compression, three-point bend and compression. Various heating rates, frequencies and strains can be utilized as well. All of these variables can affect the Tg. Compared to DSC, DMA can be 10 to 100 times more sensitive to the changes occurring at the Tg. DMA is useful for polymers with difficult to find Tg's such as epoxies, polymers with Tg's well below ambient temperature and highly crosslinked polymers. It is important to note Tg by DMA can vary significantly from one reporting technique to the next.As you can see there are various approaches to obtain Tg of polymeric materials. Sometimes trial and error has to be used to see what technique is best. It is extremely important to know which technique and test parameters were used to determine Tg if comparing back to historical data. Similarly, if testing to a specification or industry standard, the technique and test parameters must be well defined. Even within a test technique, the means of obtaining the Tg can be performed various ways and the result can vary significantly. The Tg by DSC, TMA or DMA rarely will be the same and can vary by as much as 20°C or more.转⾃:Techniques for Obtaining Glass Transition Temperature of Polymeric Materials原⽂后⾯有条评论可以看看:DMA is probably the best equipment for this. It is typically preferable to have homogenous specimens for DMA testing, but it is unlikely DSC or TMA is going to be able to detect the Tg of the FRP or the Silicone. Since you have a multi-layer specimen, there may be some challenges in obtaining the Tg of both components. Depending on your objective, you may need to isolate the silicone layer from the FRP and test them separately.另外,我看了⼀家⽇本卖测试仪器的,对这些指标也做了些介绍,有兴趣可以看看。
实验1.聚合物的热分析 实验报告
实验五 聚合物差热热重同时热分析法差热分析是在温度程序控制下测量试样与参比物之间的温度差随温度变化的一种技术。
简称DTA(Differential Thermal Analysis)。
在DTA 基础上发展起来的另一种技术是差示扫描量热法。
差示扫描量热法是在温度程序控制下测量试样相对于参比物的热流速度随温度变化的一种技术。
简称DSC (Differential Scanning Calorimetry )。
试样在受热或冷却过程中,由于发生物理变化或化学变化而产生热效应,这些热效应均可用DTA 、DSC 进行检测。
DTA 、DSC 在高分子方面的应用特别广泛。
它们的主要用途是:①研究聚合物的相转变,测定结晶温度T c 、熔点T m 、结晶度X D 、等温结晶动力学参数。
②测定玻璃化转变温度T g 。
③研究聚合、固化、交联、氧化、分解等反应,测定反应温度或反应温区、反应热、反应动力学参数。
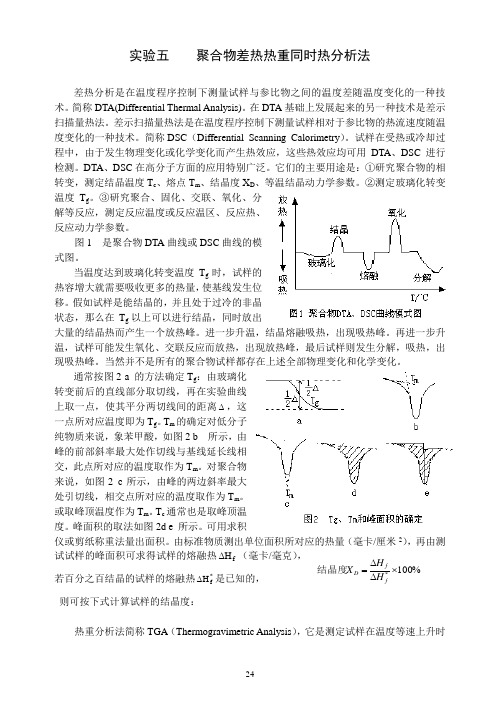
图1 是聚合物DTA 曲线或DSC 曲线的模式图。
当温度达到玻璃化转变温度T g 时,试样的热容增大就需要吸收更多的热量,使基线发生位移。
假如试样是能结晶的,并且处于过冷的非晶状态,那么在T g 以上可以进行结晶,同时放出大量的结晶热而产生一个放热峰。
进一步升温,结晶熔融吸热,出现吸热峰。
再进一步升温,试样可能发生氧化、交联反应而放热,出现放热峰,最后试样则发生分解,吸热,出现吸热峰。
当然并不是所有的聚合物试样都存在上述全部物理变化和化学变化。
通常按图2 a 的方法确定T g :由玻璃化转变前后的直线部分取切线,再在实验曲线上取一点,使其平分两切线间的距离∆,这一点所对应温度即为T g 。
T m 的确定对低分子纯物质来说,象苯甲酸,如图2 b 所示,由峰的前部斜率最大处作切线与基线延长线相交,此点所对应的温度取作为T m 。
对聚合物来说,如图2 c 所示,由峰的两边斜率最大处引切线,相交点所对应的温度取作为T m 。
聚合物结晶速度的测试方法 -回复

聚合物结晶速度的测试方法-回复聚合物结晶速度是指聚合物在固态下从无序状态向有序状态转变的速度。
了解聚合物的结晶速度对于聚合物的制备和性能控制非常重要。
本文将逐步介绍最常用的测试聚合物结晶速度的方法。
一、热差示扫描量热法(DSC)热差示扫描量热法是最常用的测试聚合物结晶速度的方法之一。
该方法通过测量物质在升温或降温过程中释放或吸收的热量,来确定其相变温度和结晶速度。
1. 准备样品:将聚合物样品切成均匀的小片,并进行表面处理以消除表面应力。
2. 扫描:将样品放置在DSC仪器中,根据需要选择升温或降温扫描模式。
开始时,将样品加热至高温区域,使其完全熔化。
然后,快速降温到低温区域,观察样品的结晶过程。
3. 分析结果:根据热容变化曲线和峰值位置确定结晶温度,利用半峰宽计算结晶速度。
二、X射线衍射(XRD)X射线衍射是一种可以确定聚合物结晶速度的非常重要的分析技术。
通过测量样品表面反射或绕射的X射线,在不同温度下观察结晶体和非晶体的特征峰,以及峰的强度和宽度的变化,来了解结晶速度。
1. 准备样品:将聚合物样品制备成块状或粉末状,需要确保样品表面平整。
2. 实验测量:将样品放置在X射线衍射仪器中,设置合适的入射角度和扫描范围。
逐渐升温或降温样品,记录X射线衍射图谱。
3. 数据分析:根据X射线衍射图谱的峰位、峰宽和峰强度,可以得到结晶特征参数。
通过对比不同温度下的数据,可以计算出聚合物的结晶速度。
三、偏光显微镜(POM)偏光显微镜是一种实时观察聚合物结晶过程的重要工具。
通过观察聚合物样品在显微镜下的反射和透射光的偏振状态来研究结晶速度。
1. 准备样品:将聚合物样品切割成薄片,并进行表面处理以消除表面应力。
2. 观察:将样品放置在偏光显微镜下,通过调节偏振光的角度和强度,观察样品在不同温度下的结晶行为。
3. 结果分析:根据观察到的结晶特征,如晶体形态、晶体尺寸和结晶速度,来评估样品结晶速度。
综上所述,热差示扫描量热法、X射线衍射和偏光显微镜是目前最常用的测试聚合物结晶速度的方法。
pa66的dsc曲线

pa66的dsc曲线
聚酰胺66(Polyamide 66,简称PA66)是一种合成聚合物,具
有优异的耐热性、耐化学品性和机械强度,广泛应用于工程塑料领域。
DSC(差示扫描量热法)是一种常用的热分析技术,用于研究材
料的热性质。
对于PA66的DSC曲线,我们可以从不同角度来进行全面的解读。
首先,DSC曲线通常显示了样品的热量变化与温度的关系。
对
于PA66,DSC曲线通常会显示两个主要的峰值,分别对应着其熔融
和结晶过程。
熔融峰通常出现在较低的温度范围内,表示PA66的熔
融温度。
结晶峰则出现在较高的温度范围内,表示PA66的结晶温度。
其次,DSC曲线还可以提供有关PA66的热性质和热行为的信息。
例如,曲线上峰值的面积可以用来计算PA66的熔融焓和结晶焓,这
些参数对于了解材料的热稳定性和热形态转变过程非常重要。
此外,DSC曲线还可以提供有关PA66的玻璃化转变温度和热分解温度等信息,这些参数对于材料的加工和应用具有指导意义。
此外,DSC曲线还可以用来研究PA66的晶态结构和热行为的变
化。
通过对曲线的形状和特征进行分析,可以了解PA66的结晶度、结晶速率、结晶动力学等信息。
这对于优化PA66的热处理工艺、改善材料的性能非常有帮助。
总之,PA66的DSC曲线可以提供关于其热性质、热行为和晶态结构的丰富信息。
通过对曲线的分析和解读,可以更好地了解和应用PA66材料。
简述dsc的测定原理、方法和应用。
简述dsc的测定原理、方法和应用
差示扫描量热法(Differential Scanning Calorimetry,DSC)是一种常用的热分析技术,用于测定物质在温度变化下的热特性。
下面是关于DSC的测定原理、方法和应用的简要概述:测定原理:DSC通过比较被测样品与参比样品之间的热量差异来分析样品的热性质。
样品和参比样品均受相同的温度变化,并通过测量它们之间的温差来计算样品吸放热的变化。
这种测量可以提供有关固、液、气相变、热容量和反应等性质的信息。
测定方法:DSC的测定方法包括样品和参比样品的制备和装填、温度控制和扫描速率、数据采集和分析等步骤。
样品和参比样品一起加热或冷却,期间测量温度差异所产生的热量变化。
通过控制加热速率和记录热量响应,可以获得样品的热性质。
应用:DSC在材料科学、化学、医药、食品和生物等领域具有广泛的应用。
一些主要的应用包括:
•确定材料的熔点、热分解、相变和结晶性质。
•研究聚合物的热性质、玻璃转变温度和热稳定性。
•表征药物的热性质、配方稳定性和反应动力学。
•分析食品的固-液相变、结晶过程和品质特性。
•研究生物分子的热稳定性、折叠和反应动力学。
此外,DSC还可用于评估材料的纯度、反应动力学参数、材料
的储存和运输条件等方面的研究。