研究生学术英语写作教程Unit 5 Reporting Results
研生学术英语写作教程Unit 5 Reporting Results
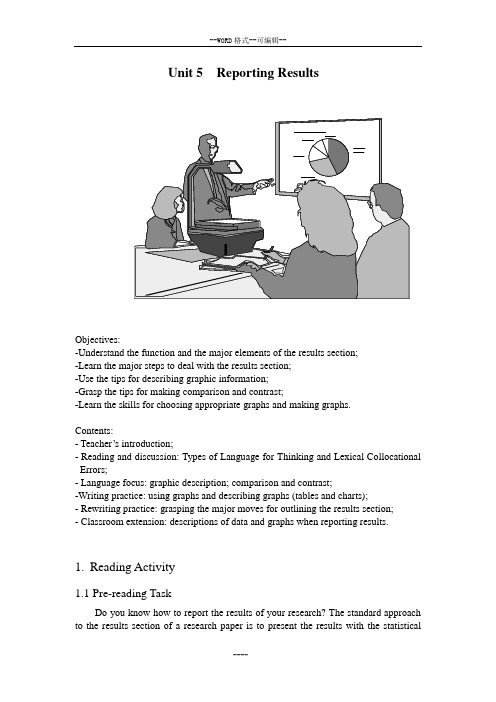
Unit 5 Reporting ResultsObjectives:-Understand the function and the major elements of the results section;-Learn the major steps to deal with the results section;-Use the tips for describing graphic information;-Grasp the tips for making comparison and contrast;-Learn the skills for choosing appropriate graphs and making graphs.Contents:- Teacher’s introduction;- Reading and discussion: Types of Language for Thinking and Lexical Collocational Errors;- Language focus: graphic description; comparison and contrast;-Writing practice: using graphs and describing graphs (tables and charts);- Rewriting practice: grasping the major moves for outlining the results section;- Classroom extension: descriptions of data and graphs when reporting results.1.Reading Activity1.1 Pre-reading TaskDo you know how to report the results of your research? The standard approach to the results section of a research paper is to present the results with the statisticaltechniques such as tables and charts. This does not mean that you do not need any text to describe data presented in graphs.Think about the following questions before reading the text and then have a discussion with your classmates.1. What is the function of the results section?2. What are the major elements included in the results section?3. What are the major steps for you to deal with the results section?4. How do you describe graphic information in the results section?5. How do you compare and contrast the data presented in graphs?The following is part of the results section of a research paper which investigated how EFL learners’ type s of language for thinking influence their lexical collocational errors in speech.1.2 Reading PassageResultsTypes of Language for Thinking and Lexical Collocational Errors1One key issue in this study was whether a learner’s type of language for thinking influences lexical collocational production. 2This issue was explored by examining one retrospective report on the qu estionnaire, ‘‘When tape recording, what language did you mainly use for inner speech?’’ 3Based on their responses, the 42 participants were classified into four language groups: Chinese, English, Chinese mingled with English, and other languages. 4The par ticipants’ inaccuracy rates were compared, which were obtained by dividing the number of errors by the overall number of lexical collocations they produced individually, among the language groups.The preliminary analysis discovered that the 42 participants produced a total of 2,491 lexical collocations, and each participant created approximately 29 lexical collocations per minute. Regarding learner errors, 263 incorrect collocations were found among the 2,491 lexical collocations, resulting in an inaccuracy rate of 10.56. To report the effect of language for thinking on the production of lexical collocations in speech, Table 1 records the fact that 5 students stated that their type of language for thinking was for the most part Chinese. As Table 1 shows, 17 mainly used English for thinking, 20 primarily thought in Chinese mingled with English, and none thought in other languages. The inaccuracy rate of oral lexical collocations in each language group was calculated by dividing the total number of lexical collocational errors by the total number of lexical collocations produced. Descriptive statistics demonstrated that those who mainly thought in their native language (Mandarin Chinese) produced the highest inaccuracy rate of lexical collocations (M=15.17), followed by those who primarily thought in English (M=12.40) and those using a combination (M=8.44).Results of a one-way analysis of variance (ANOVA) further displayed that the difference among these three groups reached a significant level, F(2,39)=4.07, p<.05. This result supports the notion that EFL learners’ type of language for thinking appreciably influences their oral production of lexical collocations.To probe intergroup differences, the Fisher Least Significant Difference (LSD) posthoc test was adopted, which aims at discerning whether the comparison between groups reaches the significance level. The LSD test showed that the Chinese-mingled-with- English group had a markedly lower inaccuracy rate than the Chinese or English groups, while the difference between the Chinese and English groups was not significant. Thinking in both Chinese and English was more beneficial and effective to the EFL learners’ oral production of lexical collocations.Table 1: Types of Language for Thinking and Inaccuracy Rates of Lexical CollocationsNote: Mean shows the average inaccuracy rate of collocations in each group.*P<.05(Hung-ChunWang & Su-Chin Shih, 2011) 1.3 Reading Comprehension1.3.1 Read the first paragraph and identify the information elements you find in each sentence of the text.1.3.2 Some verbs can be used to locate the results of the research, such as “show”and “indicate”. Read the second and third paragraphs carefully and think of the question: Which verbs did the authors use for locating the results?1.3.3 Read the second and third paragraphs carefully and think of the question: What is the function of the last sentence in the 2nd and 3rd paragraph s respectively?2Language Focus2.1 Graphic descriptionThe results section clearly presents the findings of your study. It is usually presented both in graph and text. First, prepare the graphs as soon as all the data are analyzed and arrange them in the sequence that best presents your results in a logical way. Then, as the results section is text-based section, the description of graphs is of great importance in paper writing. Good descriptions can help the readers understand your research better while using a single sentence pattern to describe the statistical and graphic information in a research paper will make your readers feel too bored and lose interest in reading on, so we need to pay more attention to the language use when describing the statistical and graphic information.Here we will introduce some useful words, phrases or sentence patterns which can be used in different situations of graphic description.If you need to highlight significant data in a table/chart, you may use some adjectives such as “apparent”, “clear”, “interesting”, “obvious”, “revealing”and “significant” to make your viewpoint known and meanwhile attract readers’ attention.The following sentence patterns are useful for you when you report significant results or findings.1. It is apparent from Table 2 that...2. Table 5 is quite revealing in several ways.3. From Chart 5 we can see that Experiment 2 resulted in the lowest value of ...4. What is interesting in this data is that ...5. In Figure 10, there is a clear trend of decreasing ...6. As Table 2.1 shows, there was a great deal of difference between theexperimental group and the control group.7. As shown in Table 6.3, chunk frequency also has significant correlation withthe indices of oral proficiency.8. There was no obvious difference between Method 1 and Method 2.2.1.1 The following table lists results of a questionnaire concerning students’ interestand performance in class.Question 1: You are very interested in the English writing course.□Strongly agree □agree □I don’t know □disagree □strongly disagr ee Question 2: You are active in group discussion in the classroom.□Strongly agree □agree □I don’t know □disagree □strongly disagr eeNote: N=number; P=percentageNow you are required to report results from the interview. The following sentence patterns may be used in your report.1. Of all the subjects, 70 completed and returned the questionnaire form.2. The majority of respondents felt that …3. Over a half of those surveyed indicated that …4. A small number of respondents …5. A minority of participants (%) indicated ...6. In response to Question 1, most of those surveyed indicated that ...7. The overall response to this question was very positive.8. It is apparent from the table above that...____________________________________________________________________ 2.1.2 The following line graph shows an upward trend in growth rate of Ford car production during the period from January to December 2011.Look at the line graph carefully first and then do the following exercises.A. Mark the following places in the graph.a) The bottom of the line;b) The peak of the line;c) The fluctuating part.B. Describe the growth rate of Ford car production in the following months respectively. Try to use the phrases or sentence patterns of graphic description you learned in this section.a) In January: _________________________________________________________.b) From March to April:_________________________________________________.c) From May to September:______________________________________________.d) From October to December:___________________________________________.C. What does the overall line graph reveal in the growth rate of Ford car production during the period from January to December 2011?__________________________.2.2 Comparison and contrastWhen you are writing the reports section, you need to do much more than just give data. What you should always try to do is to convey more information with the data. Comparing and contrasting is a common way to deal with the data. The purpose of comparison is to show similarities while contrast is used to show differences. Through comparison or contrast between two or more things, the reader can understand them better.Here are some key words commonly used to express comparison or contrast.Note: Comparison and contrast is often used in graph description. Here are some points for you to pay special attention to.1) Not all the information has to be compared or contrasted with each other. It is common to introduce the most significant or important information and compare or contrast it. If necessary, you must make some calculation before comparing or contrasting the data.2) When comparing or contrasting information in the graphs, it is not necessary to lay equal emphasis on every change. Just give stress to those dramatic changes or to those that are of special interest to you, or those that you want your readers to pay more attention to and ignore the less important parts.3) The comparison/contrast should be supported by concrete and relevant facts or data.2.2.1 The tables below are the results of a research which examines the average marks scored by boys and girls of different ages in several school subjects. Write a report for a university lecturer describing the information below.You should write a minimum of 150 words.Boys:Girls:3.Writing Practice3.1 Using graphsGraphs are commonly used in reporting the results of your research. A graph is a diagram, usually a line or a curve, which shows how two or more sets of numbers and measurements are related. Graphs usually include bar/column charts/graphs, pie charts, line graphs and tables.Generally speaking, bar charts are diagrams with rectangular bars with lengths proportional to the values that they represent. The bars can be plotted vertically or horizontally. However, they more clearly show the relationship of different parts of the sample to each other. They do not clearly show the parts in relation to the whole. The following bar chart shows the teachers with master’s degree or above in Northwestern College according to gender.A pie chart is a circle divided into segments. Pie charts can be used to show the sizes of various parts of the results in relation to each other and in relation to the whole sample. They are usually used to show percentages. The following pie chart shows the percentage of living costs per month in a family.A line graph is a type of graph displaying information as a series of data points connected by continuous lines. It can show a pattern or trend which usually takes place over a period of time. The following linegraph shows the change of annual income of an average family in a certain city in China. .A table is a set of facts and figures arranged in columns and rows. A table is a very useful way of organizing numerical information. Tables are efficient, enablingthe researcher to present a large amount of data in a small space. They can show exact numerical values and present quantitative data. They emphasize the discrete rather than the continuous. Here is a table which shows the percentage of the use of transportation vehicles in Northwestern College.Table Use of transportation vehicles in Northwestern CollegeTurn the table above into other graphs for your different research purposes.3.2 Describing a graphThe description of graphs is of great importance in paper writing because it can help the readers understand your research better. How do you describe a graph? Here are the major steps for you to follow:Step 1: Introduce the graphic information briefly and indicate the main trend.Normally it includes the place, time, content and purpose of the graph.Step 2: Describe the relevant and most important or significantdata and makesome comparison if necessary. Words and expressions for describing a curve or a trend are very useful in presenting graphic information.Step 3: Summarize the data/trends.3.2.1 The line graph below shows the sales amount of an online shop from Monday to Friday. Match the descriptive statements with the graph. Which are the correct statements describing the graph?A. The sales amount increased sharply from Monday to Tuesday.B. The sales amount reached a peak on Friday.C. There was a fluctuation in the sales amount.D. The sales amount dropped drastically from Wednesday to Thursday.3.2.2 Write a short passage describing the sales amount of an online shop from Monday to Friday with the information presented in the graph above.3.3 Describing a tableThe table below shows the results of the interviews on the teaching language(s) used by English teachers in class. Answer the following questions first and then according to the answers, describe the information in the table. Pay attention to the use of different sentence patterns when reporting the data.Table 1 Teaching l anguage(s) used by English teachers in classQuestions:1. What does the table show us?2. How many teaching languages are mentioned in the table?3. What language is used most frequently by English teachers in class?4. Do English teachers in class often use Chinese?5. In summary, what impression do you have on the teaching language(s) used by English teachers in class?3.4 Describing chartsThe following is a result from a market survey of personal computers. Report the result from a university student’s perspective. First, describe the student’s needs in personal computers. Then, compare and contrast the three types of personal computers in the items listed in the table below. Finally, conclude by stating which computer seems to be th e most suitable for the student’s needs you have described.Table 2 A market survey of personal computers4. Writing project4.1 Get prepared for writing the results sectionBefore you write the Results Section of your research paper, you need to make everything ready for your writing. The following steps may be helpful for your preparation.1. Read the literature review section and the method section carefully and rethink about the research questions;2. Review you results and check whether they have answered all the research questions;3. Organize your results in a logical manner (For example, according to priority of the appearance of research questions);4. Prepare tables and/or other diagrams;5. Select appropriate language style and pay attention to the use of grammar;Work in groups and discuss what other preparations you can make for writing the results section of your research paper.4.2 Outlining the results sectionWhen outlining a results section, there are usually four major moves to follow.Move 1: Preparing informationThis move functions as a reminder and connector between the method section and the results section, as it provides relevant information for the presentation of results. It provides a review of issues mentioned in the method section, the location of tables or graphs where results are displayed and a general preview of the section. However, it is not obligatory because there are also results sections that do not have this move.Move 2: Reporting resultsMove 2 is the core element. It is the move in which the results of a study are presented, normally with relevant evidence such as statistics and examples. In this move, the authors need to locate where the results are and clearly describe the findings of the study both in diagrams and text.Move 3: Commenting on resultsThis move serves the purpose of establishing the meaning and significance of the research results in relation to the relevant field. It includes information and interpret ations that go beyond the “objective” results. This can involve how the results can be interpreted in the context of the study, how the findings contribute to the field (often involving comparison with related literature), what underlying reasons may account for the results, or comments about the strength, limitations or generalizability of the results. As indicated by the frequency of moves and steps, this section is highly cyclical.Move 4: Summarizing resultsIn this move, the major results obtained are summarized in order to help readers understand the research better. This move is optional in a research paper due to the limited length while it is a must for a dissertation or thesis.Now, you are required to outline the results section of a research paper entitled Astudy of the effect of Chinese language on English writing with the moves given below.4.3 Drafting your results sectionBegin your writing now with the information you have just obtained from your survey.5. Final ChecklistHere are some useful questions to ask yourself about writing the results section of your paper:。
研究生学术英语读写教程unit5

Unit 5: Academic WritingAcademic writing is an essential skill for graduate students. Whether it's writing research papers, essays, or dissertations, the ability to conveyplex ideas in a clear and organized manner is crucial for success in academia. In this unit, we will delve into the keyponents of academic writing, including structure, language, and style, and offer practical tips for developing your skills in this area.1. Understanding the Structure of Academic WritingAcademic writing typically follows a specific structure that includes an introduction, body, and conclusion. The introduction should provide background information on the topic and clearly state the purpose of the paper. The body should present evidence, arguments, and analysis to support the m本人n thesis, while the conclusion should summarize the key points and reiterate the significance of the research. Understanding and following this structure is essential for producing coherent and persuasive academic writing.2. Developing an Academic Writing StyleAcademic writing requires a formal and objective tone. This means avoiding colloquial language, personal opinions, and emotional language. Instead, focus on using clear, precise, and formal language to convey your arguments and ideas. Additionally, pay attention to the use of citations and referencing to acknowledge the sources of your information and evidence. Developing a strong academic writing style takes practice, but it is a crucial skill for graduate students to master.3. Using Language Effectively in Academic WritingIn academic writing, it is important to use language that is precise and unambiguous. Avoid vague or ambiguous language, as this can weaken the clarity and effectiveness of your writing. Additionally, pay attention to the use of transitions and cohesive devices to ensure smooth and logical connections between ideas. By using language effectively, you can enhance the coherence and flow of your academic writing.4. Incorporating Research and EvidenceAcademic writing is heavily reliant on research and evidence tosupport arguments and cl本人ms. As a graduate student, it is important to develop strong research skills and the ability to critically evaluate sources. This includes identifying reliable and credible sources, synthesizing information from multiple sources, and effectively integrating evidence into your writing. By incorporating research and evidence, you can strengthen the validity and persuasiveness of your academic writing.5. Editing and Revising Academic WritingEffective academic writing is the result of careful editing and revision. After drafting your paper, take the time to review and revise it for clarity, coherence, and organization. Pay attention to the overall structure and flow of the paper, as well as the language, style, and tone. Additionally, proofread your work for grammar, punctuation, and spelling errors. By editing and revising your academic writing, you can ensure that it meets the highest standards of clarity and accuracy.ConclusionAcademic writing is a fundamental skill for graduate students, and mastering this skill is key to success in academia. Byunderstanding the structure of academic writing, developing a formal and objective writing style, using language effectively, incorporating research and evidence, and editing and revising your work, you can produce high-quality academic writing that is clear, coherent, and persuasive. With practice and dedication, you can continue to refine your skills in academic writing and excel in your academic pursuits.。
研究生学术英语写作教程Unit-5-Reporting-Results
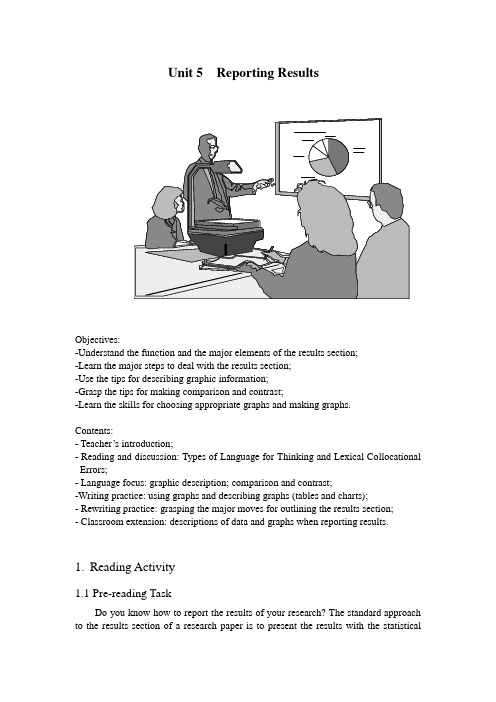
Unit 5 Reporting ResultsObjectives:-Understand the function and the major elements of the results section;-Learn the major steps to deal with the results section;-Use the tips for describing graphic information;-Grasp the tips for making comparison and contrast;-Learn the skills for choosing appropriate graphs and making graphs.Contents:- Teacher’s introduction;- Reading and discussion: Types of Language for Thinking and Lexical Collocational Errors;- Language focus: graphic description; comparison and contrast;-Writing practice: using graphs and describing graphs (tables and charts);- Rewriting practice: grasping the major moves for outlining the results section;- Classroom extension: descriptions of data and graphs when reporting results.1.Reading Activity1.1 Pre-reading TaskDo you know how to report the results of your research? The standard approach to the results section of a research paper is to present the results with the statisticaltechniques such as tables and charts. This does not mean that you do not need any text to describe data presented in graphs.Think about the following questions before reading the text and then have a discussion with your classmates.1. What is the function of the results section?2. What are the major elements included in the results section?3. What are the major steps for you to deal with the results section?4. How do you describe graphic information in the results section?5. How do you compare and contrast the data presented in graphs?The following is part of the results section of a research paper which investigated how EFL learners’ type s of language for thinking influence their lexical collocational errors in speech.1.2 Reading PassageResultsTypes of Language for Thinking and Lexical Collocational Errors1One key issue in this study was whether a learner’s type of language for thinking influences lexical collocational production. 2This issue was explored by examining one retrospective report on the qu estionnaire, ‘‘When tape recording, what language did you mainly use for inner speech?’’ 3Based on their responses, the 42 participants were classified into four language groups: Chinese, English, Chinese mingled with English, and other languages. 4The par ticipants’ inaccuracy rates were compared, which were obtained by dividing the number of errors by the overall number of lexical collocations they produced individually, among the language groups.The preliminary analysis discovered that the 42 participants produced a total of 2,491 lexical collocations, and each participant created approximately 29 lexical collocations per minute. Regarding learner errors, 263 incorrect collocations were found among the 2,491 lexical collocations, resulting in an inaccuracy rate of 10.56. To report the effect of language for thinking on the production of lexical collocations in speech, Table 1 records the fact that 5 students stated that their type of language for thinking was for the most part Chinese. As Table 1 shows, 17 mainly used English for thinking, 20 primarily thought in Chinese mingled with English, and none thought in other languages. The inaccuracy rate of oral lexical collocations in each language group was calculated by dividing the total number of lexical collocational errors by the total number of lexical collocations produced. Descriptive statistics demonstrated that those who mainly thought in their native language (Mandarin Chinese) produced the highest inaccuracy rate of lexical collocations (M=15.17), followed by those who primarily thought in English (M=12.40) and those using a combination (M=8.44).Results of a one-way analysis of variance (ANOVA) further displayed that the difference among these three groups reached a significant level, F(2,39)=4.07, p<.05. This result supports the notion that EFL learners’ type of language for thinking appreciably influences their oral production of lexical collocations.To probe intergroup differences, the Fisher Least Significant Difference (LSD) posthoc test was adopted, which aims at discerning whether the comparison between groups reaches the significance level. The LSD test showed that the Chinese-mingled-with- English group had a markedly lower inaccuracy rate than the Chinese or English groups, while the difference between the Chinese and English groups was not significant. Thinking in both Chinese and English was more beneficial and effective to the EFL learners’ oral production of lexical collocations.Table 1: Types of Language for Thinking and Inaccuracy Rates of Lexical CollocationsNote: Mean shows the average inaccuracy rate of collocations in each group.*P<.05(Hung-ChunWang & Su-Chin Shih, 2011) 1.3 Reading Comprehension1.3.1 Read the first paragraph and identify the information elements you find in each sentence of the text.1.3.2 Some verbs can be used to locate the results of the research, such as “show”and “indicate”. Read the second and third paragraphs carefully and think of the question: Which verbs did the authors use for locating the results?1.3.3 Read the second and third paragraphs carefully and think of the question: What is the function of the last sentence in the 2nd and 3rd paragraph s respectively?2Language Focus2.1 Graphic descriptionThe results section clearly presents the findings of your study. It is usually presented both in graph and text. First, prepare the graphs as soon as all the data are analyzed and arrange them in the sequence that best presents your results in a logical way. Then, as the results section is text-based section, the description of graphs is of great importance in paper writing. Good descriptions can help the readers understand your research better while using a single sentence pattern to describe the statistical and graphic information in a research paper will make your readers feel too bored and lose interest in reading on, so we need to pay more attention to the language use when describing the statistical and graphic information.Here we will introduce some useful words, phrases or sentence patterns which can be used in different situations of graphic description.If you need to highlight significant data in a table/chart, you may use some adjectives such as “apparent”, “clear”, “interesting”, “obvious”, “revealing”and “significant” to make your viewpoint known and meanwhile attract readers’ attention.The following sentence patterns are useful for you when you report significant results or findings.1. It is apparent from Table 2 that...2. Table 5 is quite revealing in several ways.3. From Chart 5 we can see that Experiment 2 resulted in the lowest value of ...4. What is interesting in this data is that ...5. In Figure 10, there is a clear trend of decreasing ...6. As Table 2.1 shows, there was a great deal of difference between theexperimental group and the control group.7. As shown in Table 6.3, chunk frequency also has significant correlation withthe indices of oral proficiency.8. There was no obvious difference between Method 1 and Method 2.2.1.1 The following table lists results of a questionnaire concerning students’ interestand performance in class.Question 1: You are very interested in the English writing course.□Strongly agree □agree □I don’t know □disagree □strongly disagr ee Question 2: You are active in group discussion in the classroom.□Strongly agree □agree □I don’t know □disagree □strongly disagr eeNote: N=number; P=percentageNow you are required to report results from the interview. The following sentence patterns may be used in your report.1. Of all the subjects, 70 completed and returned the questionnaire form.2. The majority of respondents felt that …3. Over a half of those surveyed indicated that …4. A small number of respondents …5. A minority of participants (%) indicated ...6. In response to Question 1, most of those surveyed indicated that ...7. The overall response to this question was very positive.8. It is apparent from the table above that...____________________________________________________________________ 2.1.2 The following line graph shows an upward trend in growth rate of Ford car production during the period from January to December 2011.Look at the line graph carefully first and then do the following exercises.A. Mark the following places in the graph.a) The bottom of the line;b) The peak of the line;c) The fluctuating part.B. Describe the growth rate of Ford car production in the following months respectively. Try to use the phrases or sentence patterns of graphic description you learned in this section.a) In January: _________________________________________________________.b) From March to April:_________________________________________________.c) From May to September:______________________________________________.d) From October to December:___________________________________________.C. What does the overall line graph reveal in the growth rate of Ford car production during the period from January to December 2011?__________________________.2.2 Comparison and contrastWhen you are writing the reports section, you need to do much more than just give data. What you should always try to do is to convey more information with the data. Comparing and contrasting is a common way to deal with the data. The purpose of comparison is to show similarities while contrast is used to show differences. Through comparison or contrast between two or more things, the reader can understand them better.Here are some key words commonly used to express comparison or contrast.Note: Comparison and contrast is often used in graph description. Here are some points for you to pay special attention to.1) Not all the information has to be compared or contrasted with each other. It is common to introduce the most significant or important information and compare or contrast it. If necessary, you must make some calculation before comparing or contrasting the data.2) When comparing or contrasting information in the graphs, it is not necessary to lay equal emphasis on every change. Just give stress to those dramatic changes or to those that are of special interest to you, or those that you want your readers to pay more attention to and ignore the less important parts.3) The comparison/contrast should be supported by concrete and relevant facts or data.2.2.1 The tables below are the results of a research which examines the average marks scored by boys and girls of different ages in several school subjects. Write a report for a university lecturer describing the information below.You should write a minimum of 150 words.Boys:Girls:3.Writing Practice3.1 Using graphsGraphs are commonly used in reporting the results of your research. A graph is a diagram, usually a line or a curve, which shows how two or more sets of numbers and measurements are related. Graphs usually include bar/column charts/graphs, pie charts, line graphs and tables.Generally speaking, bar charts are diagrams with rectangular bars with lengths proportional to the values that they represent. The bars can be plotted vertically or horizontally. However, they more clearly show the relationship of different parts of the sample to each other. They do not clearly show the parts in relation to the whole. The following bar chart shows the teachers with master’s degree or above in Northwestern College according to gender.A pie chart is a circle divided into segments. Pie charts can be used to show the sizes of various parts of the results in relation to each other and in relation to the whole sample. They are usually used to show percentages. The following pie chart shows the percentage of living costs per month in a family.A line graph is a type of graph displaying information as a series of data points connected by continuous lines. It can show a pattern or trend which usually takes place over a period of time. The following linegraph shows the change of annual income of an average family in a certain city in China. .A table is a set of facts and figures arranged in columns and rows. A table is a very useful way of organizing numerical information. Tables are efficient, enablingthe researcher to present a large amount of data in a small space. They can show exact numerical values and present quantitative data. They emphasize the discrete rather than the continuous. Here is a table which shows the percentage of the use of transportation vehicles in Northwestern College.Table Use of transportation vehicles in Northwestern CollegeTurn the table above into other graphs for your different research purposes.3.2 Describing a graphThe description of graphs is of great importance in paper writing because it can help the readers understand your research better. How do you describe a graph? Here are the major steps for you to follow:Step 1: Introduce the graphic information briefly and indicate the main trend.Normally it includes the place, time, content and purpose of the graph.Step 2: Describe the relevant and most important or significantdata and makesome comparison if necessary. Words and expressions for describing a curve or a trend are very useful in presenting graphic information.Step 3: Summarize the data/trends.3.2.1 The line graph below shows the sales amount of an online shop from Monday to Friday. Match the descriptive statements with the graph. Which are the correct statements describing the graph?A. The sales amount increased sharply from Monday to Tuesday.B. The sales amount reached a peak on Friday.C. There was a fluctuation in the sales amount.D. The sales amount dropped drastically from Wednesday to Thursday.3.2.2 Write a short passage describing the sales amount of an online shop from Monday to Friday with the information presented in the graph above.3.3 Describing a tableThe table below shows the results of the interviews on the teaching language(s) used by English teachers in class. Answer the following questions first and then according to the answers, describe the information in the table. Pay attention to the use of different sentence patterns when reporting the data.Table 1 Teaching l anguage(s) used by English teachers in classQuestions:1. What does the table show us?2. How many teaching languages are mentioned in the table?3. What language is used most frequently by English teachers in class?4. Do English teachers in class often use Chinese?5. In summary, what impression do you have on the teaching language(s) used by English teachers in class?3.4 Describing chartsThe following is a result from a market survey of personal computers. Report the result from a university student’s perspective. First, describe the student’s needs in personal computers. Then, compare and contrast the three types of personal computers in the items listed in the table below. Finally, conclude by stating which computer seems to be th e most suitable for the student’s needs you have described.Table 2 A market survey of personal computers4. Writing project4.1 Get prepared for writing the results sectionBefore you write the Results Section of your research paper, you need to make everything ready for your writing. The following steps may be helpful for your preparation.1. Read the literature review section and the method section carefully and rethink about the research questions;2. Review you results and check whether they have answered all the research questions;3. Organize your results in a logical manner (For example, according to priority of the appearance of research questions);4. Prepare tables and/or other diagrams;5. Select appropriate language style and pay attention to the use of grammar;Work in groups and discuss what other preparations you can make for writing the results section of your research paper.4.2 Outlining the results sectionWhen outlining a results section, there are usually four major moves to follow.Move 1: Preparing informationThis move functions as a reminder and connector between the method section and the results section, as it provides relevant information for the presentation of results. It provides a review of issues mentioned in the method section, the location of tables or graphs where results are displayed and a general preview of the section. However, it is not obligatory because there are also results sections that do not have this move.Move 2: Reporting resultsMove 2 is the core element. It is the move in which the results of a study are presented, normally with relevant evidence such as statistics and examples. In this move, the authors need to locate where the results are and clearly describe the findings of the study both in diagrams and text.Move 3: Commenting on resultsThis move serves the purpose of establishing the meaning and significance of the research results in relation to the relevant field. It includes information and interpretations that go beyond the “objective” results. This can involve how the results can be interpreted in the context of the study, how the findings contribute to the field (often involving comparison with related literature), what underlying reasons may account for the results, or comments about the strength, limitations or generalizability of the results. As indicated by the frequency of moves and steps, this section is highly cyclical.Move 4: Summarizing resultsIn this move, the major results obtained are summarized in order to help readers understand the research better. This move is optional in a research paper due to the limited length while it is a must for a dissertation or thesis.Now, you are required to outline the results section of a research paper entitled Astudy of the effect of Chinese language on English writing with the moves given below.4.3 Drafting your results sectionBegin your writing now with the information you have just obtained from your survey.5. Final ChecklistHere are some useful questions to ask yourself about writing the results section of your paper:。
五单元作文研究资料报告
五单元作文研究资料报告英文回答:Unit 5 Research Report.Introduction:In this research report, I will discuss the topic of Unit 5 and provide relevant information and analysis. Unit 5 is an important unit that focuses on various aspects such as language learning, cultural understanding, and communication skills. This report aims to provide a comprehensive understanding of the unit and its significance.Language Learning:Unit 5 emphasizes the importance of language learning. Learning a new language is not only beneficial for communication purposes but also for personal growth andcultural understanding. By acquiring new language skills, individuals can broaden their horizons and connect with people from different cultural backgrounds.Cultural Understanding:Cultural understanding is another crucial aspect of Unit 5. It encourages individuals to appreciate and respect diverse cultures. By understanding different cultural practices, traditions, and beliefs, individuals can develop empathy and become more tolerant. This unit provides opportunities for students to explore various cultures and learn from them.Communication Skills:Unit 5 also focuses on developing effective communication skills. Communication plays a vital role in our personal and professional lives. Through this unit, students learn how to express their thoughts and ideas clearly, listen actively, and engage in meaningful conversations. These skills are essential for buildingstrong relationships and succeeding in various social and professional settings.Importance of Unit 5:Unit 5 is significant as it provides a comprehensive learning experience. It combines language learning,cultural understanding, and communication skills development, which are essential for personal growth and success in today's globalized world. By studying this unit, students can enhance their language proficiency, broaden their cultural knowledge, and become effective communicators.Conclusion:In conclusion, Unit 5 is a crucial unit that focuses on language learning, cultural understanding, and communication skills development. It provides students with valuable knowledge and skills that are essential for personal growth and success. By studying this unit, individuals can become more proficient in language learning,develop empathy towards different cultures, and become effective communicators. Unit 5 plays a significant role in shaping well-rounded individuals who can thrive in a diverse and interconnected world.中文回答:第五单元研究资料报告。
学术英语(医学)_Unit 5

Unit 5 Healthy Living
Text A
• Critical reading and thinking – Topics for presentation – Useful expressions – Difficult sentences
•
Language building-up – Signpost language – Vocabulary test Suggested answers
• Our body intelligence suppressed and dormant • Tremendous amount of stress on a daily basis • Limiting, self-defeating, and even self-destructive behaviors that undermines our well-being and keeps them from achieving our full potential
Unit 5 Healthy Living
Text A
Critical reading and thinking
Topics for presentation
4 Describe the time of great confusion we live in. • People’s mind infected by spin
Unit 5 Healthy Living
Text A
Critical reading and thinking
Topics for presentation
3 Illustrate the relationship between life on automatic pilot and wellness. • Constant messages, positive and negative, sent to our mind about the health of our body • Physical symptoms suppressed • Being well equaled to being disease or illness free • Wellness confused with an absence of symptoms
学术英语综合 Unit 5

school of thought tends to emphasize the external
sources of behavior and dismiss the internal
sources (the mind). The mind hence has no
independent significance.
Compare the views in the text with your own answers.
h
15
Unit 5 Philosophy
Text B Text analysis
1. What is the writer’s focus?
Philosophy in
Leargnemnoerreaal booruatnAymberriacnanchphoilfosophy philosophy?
h
10
Unit 5 Philosophy
Text A Overview
2. Do Task 1 Critical Reading and Thinking to
have an overview of the text.
conscious minds
in every way as if it understands
h
7
Unit 5 Philosophy
Text A Overview
1. Learn more about the two philosophical terms:
• mentalism • behaviorism
h
8
Unit 5 Philosophy
Text A Supplementary information
学术英语综合 Unit 5

Unit 5
Philosophy
Text A Lead-in
The American science fiction movie Matrix (黑客帝国) describes a world dominated by robots who manipulated human beings. Do you think such a world would one day come to reality? Why or why not? Discuss these questions with each other. Then read Text A to see how the writer might answer these questions.
Unit 5
Philosophy
Text B Text analysis
1. What is the writer’s focus? Philosophy in general or any branch of philosophy?
Learn more about American philosophy
Unit 5
Philosophy
Text A Difficult sentences
• Not if I know that it’s got silicon chips in its head. (Para. 8) • If it’s the evidence of what your mother does that entitles you to believe she has a mind (and not, say, an innate prejudice), … (Para. 9) • It seems that our conviction that people have minds is no better based than the belief that there could be understanding computers. (Para. 12) • ... in the same boat. (Para. 12) • It is time now to find our way up that tower to have a look around. (Para.15)
学术英语(理工)Unit5

Learning Method
01
Inquiry-based learning
Students will engage in hands-on activities and experiments to
explore the topic and develop their understanding.
Grammar and Sentence Patterns
非谓语动词用法多
非谓语动词在本单元中频繁出现,包括不定式、现在分词 和过去分词等。学生需要了解这些非谓语动词的用法和区 别,以便在写作中更加灵活地运用。
Reading and Writing
阅读材料难度大 写作要求高
本单元的阅读材料涉及大量专业知识和理论,语 言难度较高。学生需要具备较好的阅读能力和技 巧,如快速阅读、归纳总结等,才能有效理解文 章内容。
Vocabulary and expression
抽象概念多
本单元涉及许多抽象的概念和理论,如量子力学、电路分析等。学生需要具备较好的逻辑思维和推理能力,才能理解这些概 念和理论的含义。
Vocabulary and expression
表达方式多样
为了更好地理解和应用科学和工程知识,学生需要掌握多种表达方式,如公式、图表、示意图等。此 外,学生还需要了解如何将这些表达方式与英语语言结合起来,以清晰地传达信息。
Students will work in groups to complete projects and tasks,
enhancing their teamwork and协作精神.
Learning Resources
01
Textbooks
The official textbook for this unit is "Science and Technology in Society: An Introduction to the Principles and Applications".
- 1、下载文档前请自行甄别文档内容的完整性,平台不提供额外的编辑、内容补充、找答案等附加服务。
- 2、"仅部分预览"的文档,不可在线预览部分如存在完整性等问题,可反馈申请退款(可完整预览的文档不适用该条件!)。
- 3、如文档侵犯您的权益,请联系客服反馈,我们会尽快为您处理(人工客服工作时间:9:00-18:30)。
Unit 5 Reporting ResultsObjectives:-Understand the function and the major elements of the results section;-Learn the major steps to deal with the results section;-Use the tips for describing graphic information;-Grasp the tips for making comparison and contrast;-Learn the skills for choosing appropriate graphs and making graphs.Contents:- Teacher’s introduction;- Reading and discussion: Types of Language for Thinking and Lexical Collocational Errors;- Language focus: graphic description; comparison and contrast;-Writing practice: using graphs and describing graphs (tables and charts);- Rewriting practice: grasping the major moves for outlining the results section;- Classroom extension: descriptions of data and graphs when reporting results.1.Reading Activity1.1 Pre-reading TaskDo you know how to report the results of your research? The standard approach to the results section of a research paper is to present the results with the statisticaltechniques such as tables and charts. This does not mean that you do not need any text to describe data presented in graphs.Think about the following questions before reading the text and then have a discussion with your classmates.1. What is the function of the results section?2. What are the major elements included in the results section?3. What are the major steps for you to deal with the results section?4. How do you describe graphic information in the results section?5. How do you compare and contrast the data presented in graphs?The following is part of the results section of a research paper which investigated how EFL learners’ type s of language for thinking influence their lexical collocational errors in speech.1.2 Reading PassageResultsTypes of Language for Thinking and Lexical Collocational Errors1One key issue in this study was whether a learner’s type of language for thinking influences lexical collocational production. 2This issue was explored by examining one retrospective report on the qu estionnaire, ‘‘When tape recording, what language did you mainly use for inner speech?’’ 3Based on their responses, the 42 participants were classified into four language groups: Chinese, English, Chinese mingled with English, and other languages. 4The par ticipants’ inaccuracy rates were compared, which were obtained by dividing the number of errors by the overall number of lexical collocations they produced individually, among the language groups.The preliminary analysis discovered that the 42 participants produced a total of 2,491 lexical collocations, and each participant created approximately 29 lexical collocations per minute. Regarding learner errors, 263 incorrect collocations were found among the 2,491 lexical collocations, resulting in an inaccuracy rate of 10.56. To report the effect of language for thinking on the production of lexical collocations in speech, Table 1 records the fact that 5 students stated that their type of language for thinking was for the most part Chinese. As Table 1 shows, 17 mainly used English for thinking, 20 primarily thought in Chinese mingled with English, and none thought in other languages. The inaccuracy rate of oral lexical collocations in each language group was calculated by dividing the total number of lexical collocational errors by the total number of lexical collocations produced. Descriptive statistics demonstrated that those who mainly thought in their native language (Mandarin Chinese) produced the highest inaccuracy rate of lexical collocations (M=15.17), followed by those who primarily thought in English (M=12.40) and those using a combination (M=8.44).Results of a one-way analysis of variance (ANOVA) further displayed that the difference among these three groups reached a significant level, F(2,39)=4.07, p<.05. This result supports the notion that EFL learners’ type of language for thinking appreciably influences their oral production of lexical collocations.To probe intergroup differences, the Fisher Least Significant Difference (LSD) posthoc test was adopted, which aims at discerning whether the comparison between groups reaches the significance level. The LSD test showed that the Chinese-mingled-with- English group had a markedly lower inaccuracy rate than the Chinese or English groups, while the difference between the Chinese and English groups was not significant. Thinking in both Chinese and English was more beneficial and effective to the EFL learners’ oral production of lexical collocations.Table 1: Types of Language for Thinking and Inaccuracy Rates of Lexical CollocationsNote: Mean shows the average inaccuracy rate of collocations in each group.*P<.05(Hung-ChunWang & Su-Chin Shih, 2011) 1.3 Reading Comprehension1.3.1 Read the first paragraph and identify the information elements you find in each sentence of the text.1.3.2 Some verbs can be used to locate the results of the research, such as “show”and “indicate”. Read the second and third paragraphs carefully and think of the question: Which verbs did the authors use for locating the results?1.3.3 Read the second and third paragraphs carefully and think of the question: What is the function of the last sentence in the 2nd and 3rd paragraph s respectively?2Language Focus2.1 Graphic descriptionThe results section clearly presents the findings of your study. It is usually presented both in graph and text. First, prepare the graphs as soon as all the data are analyzed and arrange them in the sequence that best presents your results in a logical way. Then, as the results section is text-based section, the description of graphs is of great importance in paper writing. Good descriptions can help the readers understand your research better while using a single sentence pattern to describe the statistical and graphic information in a research paper will make your readers feel too bored and lose interest in reading on, so we need to pay more attention to the language use when describing the statistical and graphic information.Here we will introduce some useful words, phrases or sentence patterns which can be used in different situations of graphic description.If you need to highlight significant data in a table/chart, you may use some adjectives such as “apparent”, “clear”, “interesting”, “obvious”, “revealing”and “significant” to make your viewpoint known and meanwhile attract readers’ attention.The following sentence patterns are useful for you when you report significant results or findings.1. It is apparent from Table 2 that...2. Table 5 is quite revealing in several ways.3. From Chart 5 we can see that Experiment 2 resulted in the lowest value of ...4. What is interesting in this data is that ...5. In Figure 10, there is a clear trend of decreasing ...6. As Table 2.1 shows, there was a great deal of difference between theexperimental group and the control group.7. As shown in Table 6.3, chunk frequency also has significant correlation withthe indices of oral proficiency.8. There was no obvious difference between Method 1 and Method 2.2.1.1 The following table lists results of a questionnaire concerning students’ interestand performance in class.Question 1: You are very interested in the English writing course.□Strongly agree □agree □I don’t know □disagree □strongly disagr ee Question 2: You are active in group discussion in the classroom.□Strongly agree □agree □I don’t know □disagree □strongly disagr eeNote: N=number; P=percentageNow you are required to report results from the interview. The following sentence patterns may be used in your report.1. Of all the subjects, 70 completed and returned the questionnaire form.2. The majority of respondents felt that …3. Over a half of those surveyed indicated that …4. A small number of respondents …5. A minority of participants (%) indicated ...6. In response to Question 1, most of those surveyed indicated that ...7. The overall response to this question was very positive.8. It is apparent from the table above that...____________________________________________________________________ 2.1.2 The following line graph shows an upward trend in growth rate of Ford car production during the period from January to December 2011.Look at the line graph carefully first and then do the following exercises.A. Mark the following places in the graph.a) The bottom of the line;b) The peak of the line;c) The fluctuating part.B. Describe the growth rate of Ford car production in the following months respectively. Try to use the phrases or sentence patterns of graphic description you learned in this section.a) In January: _________________________________________________________.b) From March to April:_________________________________________________.c) From May to September:______________________________________________.d) From October to December:___________________________________________.C. What does the overall line graph reveal in the growth rate of Ford car production during the period from January to December 2011?__________________________.2.2 Comparison and contrastWhen you are writing the reports section, you need to do much more than just give data. What you should always try to do is to convey more information with the data. Comparing and contrasting is a common way to deal with the data. The purpose of comparison is to show similarities while contrast is used to show differences. Through comparison or contrast between two or more things, the reader can understand them better.Here are some key words commonly used to express comparison or contrast.Note: Comparison and contrast is often used in graph description. Here are some points for you to pay special attention to.1) Not all the information has to be compared or contrasted with each other. It is common to introduce the most significant or important information and compare or contrast it. If necessary, you must make some calculation before comparing or contrasting the data.2) When comparing or contrasting information in the graphs, it is not necessary to lay equal emphasis on every change. Just give stress to those dramatic changes or to those that are of special interest to you, or those that you want your readers to pay more attention to and ignore the less important parts.3) The comparison/contrast should be supported by concrete and relevant facts or data.2.2.1 The tables below are the results of a research which examines the average marks scored by boys and girls of different ages in several school subjects. Write a report for a university lecturer describing the information below.You should write a minimum of 150 words.Boys:Girls:3.Writing Practice3.1 Using graphsGraphs are commonly used in reporting the results of your research. A graph is a diagram, usually a line or a curve, which shows how two or more sets of numbers and measurements are related. Graphs usually include bar/column charts/graphs, pie charts, line graphs and tables.Generally speaking, bar charts are diagrams with rectangular bars with lengths proportional to the values that they represent. The bars can be plotted vertically or horizontally. However, they more clearly show the relationship of different parts of the sample to each other. They do not clearly show the parts in relation to the whole. The following bar chart shows the teachers with master’s degree or above in Northwestern College according to gender.A pie chart is a circle divided into segments. Pie charts can be used to show the sizes of various parts of the results in relation to each other and in relation to the whole sample. They are usually used to show percentages. The following pie chart shows the percentage of living costs per month in a family.A line graph is a type of graph displaying information as a series of data points connected by continuous lines. It can show a pattern or trend which usually takes place over a period of time. The following linegraph shows the change of annual income of an average family in a certain city in China. .A table is a set of facts and figures arranged in columns and rows. A table is a very useful way of organizing numerical information. Tables are efficient, enablingthe researcher to present a large amount of data in a small space. They can show exact numerical values and present quantitative data. They emphasize the discrete rather than the continuous. Here is a table which shows the percentage of the use of transportation vehicles in Northwestern College.Table Use of transportation vehicles in Northwestern CollegeTurn the table above into other graphs for your different research purposes.3.2 Describing a graphThe description of graphs is of great importance in paper writing because it can help the readers understand your research better. How do you describe a graph? Here are the major steps for you to follow:Step 1: Introduce the graphic information briefly and indicate the main trend.Normally it includes the place, time, content and purpose of the graph.Step 2: Describe the relevant and most important or significantdata and makesome comparison if necessary. Words and expressions for describing a curve or a trend are very useful in presenting graphic information.Step 3: Summarize the data/trends.3.2.1 The line graph below shows the sales amount of an online shop from Monday to Friday. Match the descriptive statements with the graph. Which are the correct statements describing the graph?A. The sales amount increased sharply from Monday to Tuesday.B. The sales amount reached a peak on Friday.C. There was a fluctuation in the sales amount.D. The sales amount dropped drastically from Wednesday to Thursday.3.2.2 Write a short passage describing the sales amount of an online shop from Monday to Friday with the information presented in the graph above.3.3 Describing a tableThe table below shows the results of the interviews on the teaching language(s) used by English teachers in class. Answer the following questions first and then according to the answers, describe the information in the table. Pay attention to the use of different sentence patterns when reporting the data.Table 1 Teaching l anguage(s) used by English teachers in classQuestions:1. What does the table show us?2. How many teaching languages are mentioned in the table?3. What language is used most frequently by English teachers in class?4. Do English teachers in class often use Chinese?5. In summary, what impression do you have on the teaching language(s) used by English teachers in class?3.4 Describing chartsThe following is a result from a market survey of personal computers. Report the result from a university student’s perspective. First, describe the student’s needs in personal computers. Then, compare and contrast the three types of personal computers in the items listed in the table below. Finally, conclude by stating which computer seems to be th e most suitable for the student’s needs you have described.Table 2 A market survey of personal computers4. Writing project4.1 Get prepared for writing the results sectionBefore you write the Results Section of your research paper, you need to make everything ready for your writing. The following steps may be helpful for your preparation.1. Read the literature review section and the method section carefully and rethink about the research questions;2. Review you results and check whether they have answered all the research questions;3. Organize your results in a logical manner (For example, according to priority of the appearance of research questions);4. Prepare tables and/or other diagrams;5. Select appropriate language style and pay attention to the use of grammar;Work in groups and discuss what other preparations you can make for writing the results section of your research paper.4.2 Outlining the results sectionWhen outlining a results section, there are usually four major moves to follow.Move 1: Preparing informationThis move functions as a reminder and connector between the method section and the results section, as it provides relevant information for the presentation of results. It provides a review of issues mentioned in the method section, the location of tables or graphs where results are displayed and a general preview of the section. However, it is not obligatory because there are also results sections that do not have this move.Move 2: Reporting resultsMove 2 is the core element. It is the move in which the results of a study are presented, normally with relevant evidence such as statistics and examples. In this move, the authors need to locate where the results are and clearly describe the findings of the study both in diagrams and text.Move 3: Commenting on resultsThis move serves the purpose of establishing the meaning and significance of the research results in relation to the relevant field. It includes information and interpret ations that go beyond the “objective” results. This can involve how the results can be interpreted in the context of the study, how the findings contribute to the field (often involving comparison with related literature), what underlying reasons may account for the results, or comments about the strength, limitations or generalizability of the results. As indicated by the frequency of moves and steps, this section is highly cyclical.Move 4: Summarizing resultsIn this move, the major results obtained are summarized in order to help readers understand the research better. This move is optional in a research paper due to the limited length while it is a must for a dissertation or thesis.Now, you are required to outline the results section of a research paper entitled Astudy of the effect of Chinese language on English writing with the moves given below.4.3 Drafting your results sectionBegin your writing now with the information you have just obtained from your survey.5. Final ChecklistHere are some useful questions to ask yourself about writing the results section of your paper:。