2014年12月大学英语四级作文范文:图表图画型
英语四级图表+图画作文讲解及参考范文

英语四级图表和图画作文讲解及参考范文一、图表作文图表作文也是四(六)级考试中常见,而且被认为是一种较难的作文形式。
图表作文就是把非文字信息(通常为各种图表表示的数字信息等)转换成文字信息的一种作文。
它要求我们用文字来描述非文字性的图表或对图表显示的关系作解释说明。
第一节图表作文的出题形式和写作要领一、图表作文常见出题形式图表作文一般在题目中给出作文的标题和一个或几个统计表格、圆形图、曲线图或条形图,有时还用英文或中文提纲的形式给出提示,要求我们:1)用文字描述图表,客观解释图表中所传递的信息,并找出某种规律或趋势;2)就图表中所反映的某种趋势或问题分析其原因或后果。
图表作文着重说明事实,常常是通过对图表中所反映的具体数据的说明、分析、比拟,对某种事物或现象的事实或变化情况等加以说明,并提出结论或看法。
因此,图表作文常常采用议论文体的写作方法。
写好图表作文,关键在于能否读懂图表中所提供的信息,把握各信息间的联系,用准确流畅的语言把这一信息表达出来,并就这一信息发表自己的看法。
二、图表作文的写作步骤写图表作文时,要注意遵循以下步骤:1)认真分析图表的含义,弄清图表中所含的信息及不同信息间的关系;2)确定文章的主题思想,构思出文章的根本框架,筛选出能说明图表主题思想的典型数据;3)编列文章的提纲;4)根据文章的提纲,将各段的提纲内容扩展成段落,然后将各个段落组成文章,注意段与段之间的衔接与过渡;5)检查与修改。
三、图表作文的篇章结构写图表作文时,常采用三段式的陈述方式。
文章的第一段往往分析图表中的数据变化反映什么问题或趋势,概述图表所揭示的信息。
第二段分析造成这一问题或趋势的原因。
第三段那么展望未来的情况或提出解决问题的方法或建议。
这一结构可以简单地表述为:第一段:概述图表反映的主题思想〔总趋势+极端值+特点,时态〕第二段:分析产生的原因第三段:展望未来或提出方法或建议模板一①总的趋势②图表具体描述③剖析图表所揭示的含义④理由一⑤理由二⑥理由三⑦理由四⑧总结⑨前景预测As can be seen from the table, the past decade has witnessed dramatic changes in①______. While ②_______. It is obvious from the table that③_________.What contributed to these changes? I think the reasons are as follows. To start with,④______. Secondly, ⑤______ . What’s more, ⑥ _______. Last but not lease, ⑦________. In conclusion, ⑧_________. Moreover, ⑨ ________.模板二①描述图表②分三方面解释原因③下结论1) During the period from _______to _______, ________rose from ________to _______, while _______ decreased from _______ to _______.2) We believe that three reasons can account for this phenomenon. First,____. Second, ____. Third, _____.3) ___.We are happy to see that things are becoming better and better nowadays. We can imagine that ___.模板三①描述图表②解释图表③补充解释1) During the period between _______ and ________, ________ declined abruptly from_______ to ________, while ________ increased sharply from ________ to _______.2) Several reasons can account for this phenomenon. Compared with _________ is much cheaper and more convenient__________ . Apart from that, _________.3) However, there are still a number of people who _________, generally for two reasons. On the one hand,________. On the other hand, ________.1.图表类型:table 表格; chart 图表; diagram图表或图解,示意图; graph图表, 曲线图; column/ bar chart柱状图; pie graph饼图2. 描述:show; describe; illustrate; can be seen from; clear; apparent; reveal 显示; represent表现,描绘3.内容:figure数字; statistic统计值; statistics [用作复]统计, 统计数字[资料], 统计表number; percentage; proportion● 表示数据上升:increase, rise, ascend, core, surge, go up, climb, mount, level up下降: decrease, fall, drop, descend, decline, reduce ,lessen, level, down平稳: stable, steady, remain steady/stable; /maintain/keep/be the same as/similarto ; little/hardly any /no change波动: fluctuate, fluctuation, rise and falls, up and down占: occupy,take up,account for, gain而: while, however, whereas , on the other hand, actually/in fact相比: by contract, on the contrary, likewise, compared with最高点: the highest, the top, the summit, the peak, the most最低点: bottom, less, least, rock bottom最低点例句Prices have hit rock bottom. 价格已达最低水平平均: mean平均值, average趋势: tendency, trend, inclination预见: prediction到达顶峰: mount to比例:20 per cent , 20%one in three, 1/3one out of every four,1/4有一个稳定的过程: a stable period can be seen表示变化程度的词:sudden/suddenly 突然的,意外的rapid/rapidly 迅速的,飞快的,险峻的dramatic/dramatically 戏剧性的,生动的significant/significantly 有意义的,重大的,重要的sharp/sharply 明显的,急剧的steep/steeply 急剧升降的steady/steadily 稳固的,坚决不移的gradual/gradually 渐进的,逐渐的slow/slowly 缓慢的,不活泼的slight/slightly 轻微的、略微地stable/stably 稳定的表示范围:from…to… between…and… for …to …多长时间直到表示程度:almost adv. 几乎,差不多nearly adv. 几乎,密切地approximately adv. 近似的,大约just over 刚超过exactly adv. 正确地,严密地precisely adv. 正好精确地;清晰地●常用词和短语significant changes 图中一些较大变化noticeable trend 明显趋势during the same period 在同一时期grow/grew 增长distribute 分布,区别unequally 不相等地pronounced 明显的average 平均no doubt 无疑地corresponding adj. 相应的,通讯的represent vt. 阐述,表现overall 体上讲except 除外in the case of adv. 在…的情况下in contrast 相反,大不相同in conclusion adv. 最后,总之in comparison 相比之下inversely adv. 相反地,倒转地in general 通常,大体上,一般而言rang from…to 从…到…不等excessive adj. 过多的,过分的,额外lower v. 降低,跌落elapse vi. 〔时间〕过去,消逝category n. 种类government policy 政府政策market forces 市场规律measure n. 尺寸,方法,措施v.估量,调节forecast n. 先见,预见四、图表作文常用的句型(1)常用的开篇句型(即概述图表内容时常用的表达法)①According to the table/pie chart/line graph/bar graph, we can see/conclude that … 根据该表/图,我们可知……②The table/graph reveals (shows/indicates/illustrates/ represents/points out) that … 该表/图说明……③As we can see from the table …As can be seen from the line/bar graph …As is shown (illustrated/indicated) in the pie chart …如表/图所示,……(2) 描述增减变化常用的句型①Compared with … is still increased by …②The number of … grew/rose from … to …③An increase is shown in …; then came a sharp increase of …④In … the number remains the same/drops to …⑤ There was a very slight (small/slow/gradual) rise/increase in 1990.⑥ There was a very steady (marked/sharp/rapid/sudden/ dramatic) drop(decrease/decline/fall/reduction) in 1998/ compared with that of last year).来看一篇范文:⑴ From the graph, we can see that the number of car accidents in Walton city fluctuated during the year of 1990. ⑵ The first two months of 1990 showed an increasing trend. ⑶ The rate rose to 32 in March but fell to 26 in June. ⑷ From June on, the rate was rising again and reached the peak point 39 in August. ⑸ After August the rate began to decline remarkably, and eventually dropped to the lowest point 16 at the end of the year. ⑹Therefore, it’s obvious that car a ccident in Walton city declined in 1990.⑴主题句/概述表格反映的内容⑵—(5)反映交通事故的变化情况(6)小结:总结表格数据反映的总趋势⑺There are several reasons for the decline. ⑻ First, a new traffic law was made and came into force. ⑼ It provided that in summer every car must be air-conditioned. ⑽ As a result, the highest rate in August, when humidity and high temperature make drivers impatient and easily lead to car accidents, dropped steadily. ⑾ Second, new roads were built and some narrow streets were widened, which quickened the flow of traffic. ⑿ Finally, the city administration made great efforts to heighten people’s awareness of observing traffic rules.⑺主题句⑻原因/措施一⑼解释措施一/次要辅助⑽采取措施一后的结果⑾原因/措施二⑿原因/措施三⒀With all these new measures, I’m sure the rate of car accidents in Walton city will go on falling this year.⒀总结:展望未来的情况第二节图表作文样题与样文举例样题一:Directions: For this part, you are allowed 30 minutes to write a composition on the topic How People Spend Their Holidays. You should write at least 120 words, and base your composition on the table and the outline given below:1、根据上表,简要描述1990年、1995年、2000年某城市人们度假方式的情况及其变化;2、请说明发生这些变化的原因;3、得出结论。
最新 2014年12月大学英语四级作文范文模板(图画型)-精品
2014年12月大学英语四级作文范文模板(图画型)(二) 图画型This is a satiric but true-to-life drawing. As we can see in it, a man is drowning, with only one arm above water gesturing for help. Those standing on the bank, however, instead of lending a helping hand, are busy photographing with their mobile phones, most possibly taking the scene as another eyeball-attractor on the Internet.Exaggerating as it might be, the phenomenon mirrored by the cartoon is not uncommon in modern society. Actually, both the picture and instances in real life point to the fact that many people nowadays ignore what they should do due to the use of mobile phones and the Internet. It never too rare to see some people takingpictures of newly served dishes in a restaurant and upload them to their friend circle in We Chat. Nor is it to find people busy taking photos and update their micro blogs when touring. Some even fail to take proper actions in case of emergency, just as the crowd in the picture do. Their only goal seems to be attracting as much attention online as possible.Such being the case, it is high time that we pondered over the problem and figured out a solution. Among all measures, I believe, the central one should be resisting the temptation of vanity brought along by such modern self-media as micro blog, and coming more back to life itself.【】 | 搜索公众号""相关推荐:。
2014年12月大学英语四级写作看图作文高分模板
下面是英语四级写作看图作文高分模板,供考生参考。
一、对比观点题型(1) 要求论述两个对立的观点并给出自己的看法。
1.有一些人认为……累了,休息下,去考试大在线网上辅导逛逛2.另一些人认为……3.我的看法……The topic of ①________(主题)is becoming more and more popular recently. There are two sides of opinions of it. Some people say A is their favorite. They hold their view for the reason of ②________(支持A的理由一)What is more,③________(理由二). Moreover, ④________(理由三).While others think that B is a better choice in the following three reasons. Firstly,________(支持B的理由一). Secondly (besides),⑥____________(理由二). Thirdly (finally),⑦____________(理由三).From my point of view, I think ⑧________(我的观点). The reason is that⑨____________(原因). As a matter of fact, there are some other reasons to explain my choice. For me, the former is surely a wise choice .(2) 给出一个观点,要求考生反对这一观点Some people believe that①________(观点一). For example, they think ②________(举例说明).And it will bring them ③________(为他们带来的好处).In my opinion, I never think this reason can be the point. For onething,④____(我不同意该看法的理由一). For another thing, ⑤____(反对的理由之二). Form all what I have said,I agree to the thought that ⑥____(我对文章所讨论主题的看法).英语六级考试写作技巧二、阐述主题题型要求从一句话或一个主题出发,按照提纲的要求进行论述。
四级作文之图表图画作文篇(整理)
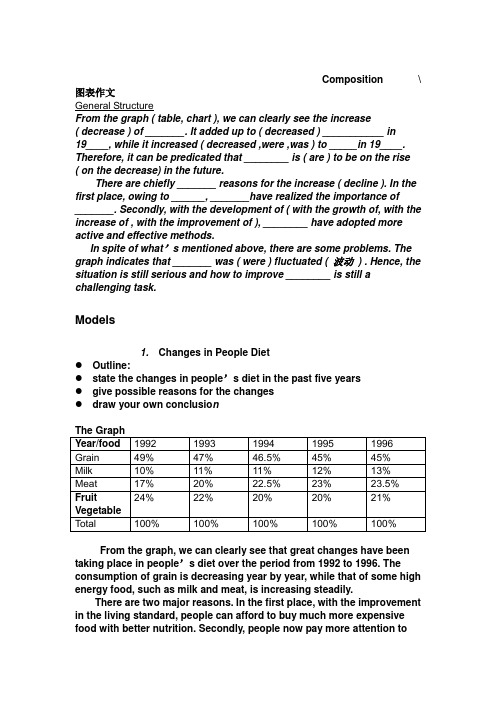
Composition \ 图表作文General StructureFrom the graph ( table, chart ), we can clearly see the increase( decrease ) of _______. It added up to ( decreased ) ___________ in19____, while it increased ( decreased ,were ,was ) to _____in 19____. Therefore, it can be predicated that ________ is ( are ) to be on the rise ( on the decrease) in the future.There are chiefly _______ reasons for the increase ( decline ). In the first place, owing to ______, _______have realized the importance of_______. Secondly, with the development of ( with the growth of, with the increase of , with the improvement of ), ________ have adopted more active and effective methods.In spite of what’s mentioned above, there are some problems. The graph indicates that _______ was ( were ) fluctuated ( 波动) . Hence, the situation is still serious and how to improve ________ is still a challenging task.Models1. Changes in People Diet●Outline:●state the changes in people’s diet in the past five years●give possible reasons for the changes●draw your own conclusio nThe GraphYear/food 1992 1993 1994 1995 1996 Grain 49% 47% 46.5% 45% 45%Milk 10% 11% 11% 12% 13%Meat 17% 20% 22.5% 23% 23.5% 24% 22% 20% 20% 21%FruitVegetableTotal 100% 100% 100% 100% 100%From the graph, we can clearly see that great changes have been taking place in people’s diet over the period from 1992 to 1996. The consumption of grain is decreasing year by year, while that of some high energy food, such as milk and meat, is increasing steadily.There are two major reasons. In the first place, with the improvement in the living standard, people can afford to buy much more expensive food with better nutrition. Secondly, people now pay more attention tothe quality of it, because they know it is of great benefit to their health to diet in a scientific way. Therefore, they try their best to improve the structure of their food.From the above, we can see that people’s living level has been rising markedly in the past five years. And it can be concluded that there will be a more prosperous future waiting for us.2. Production of Radios and TV Sets in Factory A根据左图,写一篇120字的短文。
大学英语四级考试图表作文
大学英语四级考试图表作文1、图形种类及概述法:饼图:pie chart 直方图或柱形图:bar chart / histogram表格图:table 趋势曲线图:line chart / curve diagram泛指一份数据图表:a data graph/chart/diagram/illustration/table2、图表中的数据(Data )具体表达法数据(Data )在某一个时间段固定不变:fixed in time在一系列的时间段中转变:changes over time3. 持续变化的data 在不同情况下:增加:increase / raise / rise / go up 减少:shrink/decrease / drop / fall …波动:fluctuate / undulate / wave 稳定:remain stable / stabilize / level off 4. 最常用的两种表达法:动词+副词形式(Verb+Adverb form)形容词+名词形式(Adjective+Noun form )5. 图表常用动词:show 、describe 、illustrate 、can be seen from、clear 、apparent 、reveal 、represent 、demonstrate6. 图表常用名词:figure 、statistic 、number 、percentage 、proportion7、表示数据变化的单词或者词组rapid/rapidly 迅速的,飞快的, dramatic/dramatically 戏剧性的,significant/significantly 有意义的,重大的,stable/stably 稳定的sharp/sharply 锐利的,明显的,急剧的 steep/steeply 急剧升降的steady/steadily 稳固的,坚定不移的 slight/slightly 轻微的、略微地gradual/gradually 渐进的,逐渐的 slow/slowly 缓慢的,不活跃的8、其它在描述中的常用到的词significant changes 图中一些较大变化, noticeable trend 明显趋势during the same period 在同一时期, distribute 分布,区别 in contrast 相反,大不相同, market forces 市场规率forecast n. 先见,预见v. 预测 measure n.方法,措施 v. 估量,调节9. 图表写作套句精选1 the table shows the changes in the number of……over the periodfrom……to…… 该表格描述了在……年之……年间……数量的变化。
英语四级图表作文讲解及参考范文
英语四级图表作文讲解及参考范文图表作文也是四(六)级考试中常见,而且被认为是一种较难的作文形式。
图表作文就是把非文字信息(通常为各种图表表示的数字信息等)转换成文字信息的一种作文。
它要求我们用文字来描述非文字性的图表或对图表显示的关系作解释说明。
图表作文图表作文一般要求:1)用文字描述图表,客观解释图表中所传递的信息,并找出某种规律或趋势;2)就图表中所反映的某种趋势或问题分析其原因或后果。
图表作文着重说明事实,常常是通过对图表中所反映的具体数据的说明、分析、比较,对某种事物或现象的事实或变化情况等加以说明,并提出结论或看法。
因此,图表作文常常采用议论文体的写作方法。
写好图表作文,关键在于能否读懂图表中所提供的信息,把握各信息间的联系,用准确流畅的语言把这一信息表达出来,并就这一信息发表自己的看法。
二、图表作文的写作步骤写图表作文时,要注意遵循以下步骤:1)认真分析图表的含义,弄清图表中所含的信息及不同信息间的关系;2)确定文章的主题思想,构思出文章的基本框架,筛选出能说明图表主题思想的典型数据;3)编列文章的提纲;4)根据文章的提纲,将各段的提纲内容扩展成段落,然后将各个段落组成文章,注意段与段之间的衔接与过渡;5)检查与修改。
三、图表作文的篇章结构写图表作文时,常采用三段式的陈述方式。
第一段:概述图表反映的主题思想(总趋势+极端值+特点,时态)第二段:分析产生的原因第三段:展望未来或提出方法或建议1.图表类型:table 表格:chart 图表(有标尺的); 如bar chart柱状图:pie chart 饼图:diagram图表或图解,示意图:graph图表, 曲线图;2. 描述:show; describe; illustrate; can be seen from; clear; apparent; reveal 显示; represent表现, 描绘3.内容:number/ figure数字; statistic统计值; statistics [用作复]统计, 统计数字[资料], 统计表percentage 百分比; proportion 比例● 表示数据上升:increase, rise, grow, ascend, surge, go up, climb, mount, soar(猛增)下降: decrease, fall, drop, descend, decline, reduce ,lessen, go down平稳的: stable, steady, remain steady/stable; /maintain/keep/be the same as/similar to; little/hardly any /no change波动: fluctuate, fluctuation, rise and falls, up and down占: occupy,take up,account for而: while, however, whereas , on the other hand, actually/in fact相比: by contract, on the contrary, likewise, compared with最高点: the highest, the top, the summit, the peak (价格达到顶峰: the price mounts to the peak.)最低点: bottom, less, least, rock bottom最低点(Prices have hit rock bottom. 价格已达最低水平)趋势: tendency, trend, inclination翻番:double (The price was doubled in 2010.)比例:20 percent , 20% ;one in three, 1/3 ;one out of four,1/4 表示程度的副词:1.)上升或下降程度较大:considerably dramatically greatly markedly obviously quickly rapidly sharply significantly steeply2)程度较小:slightly gradually slowly steadily(remain stable)四、图表作文常用的句型(1)常用的开篇句型(即概述图表内容时常用的表达法)① According to the table/pie chart/ graph, we can see/conclude that … 根据该表/图,我们可知……② The table/graph reveals (shows/indicates/illustrates/ represents/points out) that … 该表/图表明……③ As we can see from the table …As can be seen from the line/bar gra ph …As is shown (illustrated/indicated) in the pie chart …如表/图所示,……(2) 描述增减变化常用的句型① Compared with … is still increased by …② The number of … grew/rose from … to …③ An increase is shown in …; then there came a sharp increase of …④ The number remains the same during… / the number drops to … in …⑤ There was a very slight (small/slow/gradual) rise/increase in 1990.⑥ There was a very steady (marked/sharp/rapid/sudden/ dramatic) drop(decrease/decline/fall/reduction) in 1998/ compared with that of last year).As illustrated in the pie charts, graduates’ choices after graduation have experienced much change. Though shrunk by 20%, for the majority of students, hunting for a job is still the first choice. One noticeable trend is that compared with the statistics in 1994, increasing number of graduates choose to study abroad or pursue master’s degree over the decade. In 1994, mere 3% students prefer further study, while in 2004 the percentage has boosted to 15%.The reasons of this obvious change are as follows. First, with the number of college graduates growing each year, more people join the workforce, which makes the already fierce competition even more brutal in the job market. The public awareness of this situation has created a surge of interest in seeking a master’s degree. Secondly, many joint-ventures or big companies set a much higher standard for new recruits than ever. It seems that the higher education you have, the better chance you may have at landing a job with handsome salary.Choosing further study may be one temporary solution to the dilemma of growing number of graduates and declining job vacancies. No matter what your choice may be, mastering useful skills is actually the key.。
2014年12月大学英语四级真题作文及范文(全)

作文1、A course that has impressed you most in college. (大学中给你印象最深的一门课)2、A classmate of yours who has influenced you most in college.(大学中对你影响最深的一位同学)3、A campus activity that has benefited most.(使你受益最深的一项校园活动)作文一:校园活动Directions: From this part, you are allowed 30 minutes to write a short essay about a camp a ctivity that has benefited you most. You should state the reasons and write at least 120 words but more than 180 words。
As a college student, it is full of meaning to participate in various campswhich are beneficial for us. Among the camps I involved before, the English Summer camp held by our university with a small group of Chinese college students as well as some friends from English Spoken countries made me the most impressive。
There are two factors for my belief. For one thing, I expanded my scope of knowledge for the lecture made by a professor of the Harvard University. Though I have been learning English for almost ten years, getting knowledgefrom foreign teachers can still be something inspiring. I really want to know about current English countries’culture, such as education, economy, politics and so on. In this way I could know more about the world and it would help me make right decisions when I graduate from university whether going abroadfor further study or not. And it would also help me understand more about ourown country. The second reason for me is that the activities also changed me a lot, including English corner, English drama play, interesting knowledge competition and the like. Undisputedly, all these activities can not only help us learn more skills but improve our English。
2014年12月英语四级真题作文范文
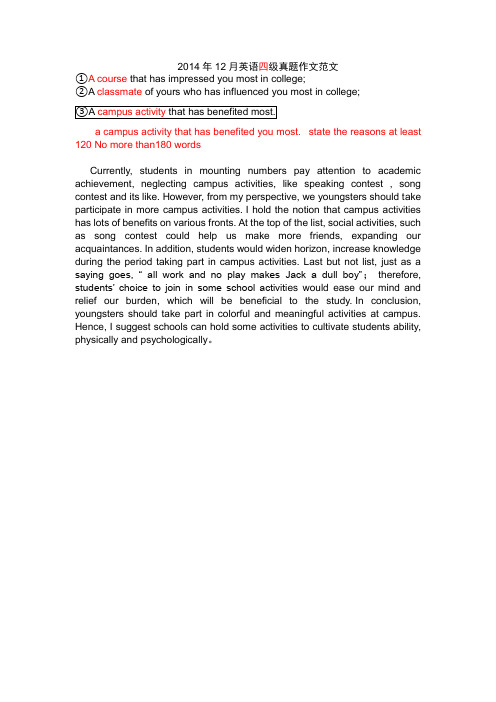
2014年12月英语四级真题作文范文①A course that has impressed you most in college;②A classmate of yours who has influenced you most in college;a campus activity that has benefited you most. state the reasons at least 120 No more than180 wordsCurrently, students in mounting numbers pay attention to academic achievement, neglecting campus activities, like speaking contest , song contest and its like. However, from my perspective, we youngsters should take participate in more campus activities. I hold the notion that campus activities has lots of benefits on various fronts. At the top of the list, social activities, such as song contest could help us make more friends, expanding our acquaintances. In addition, students would widen horizon, increase knowledge during the period taking part in campus activities. Last but not list, just as a saying goes, “ all work and no play makes Jack a dull boy”;therefore, students’ choice to join in some school activiti es would ease our mind and relief our burden, which will be beneficial to the study. In conclusion, youngsters should take part in colorful and meaningful activities at campus. Hence, I suggest schools can hold some activities to cultivate students ability, physically and psychologically。
- 1、下载文档前请自行甄别文档内容的完整性,平台不提供额外的编辑、内容补充、找答案等附加服务。
- 2、"仅部分预览"的文档,不可在线预览部分如存在完整性等问题,可反馈申请退款(可完整预览的文档不适用该条件!)。
- 3、如文档侵犯您的权益,请联系客服反馈,我们会尽快为您处理(人工客服工作时间:9:00-18:30)。
2014年12月四级作文范文:图表图画型(共四篇)一2014年12月英语四六级作文图表图画型范文(一):Traveling Abroad四级作文题目:Traveling AbroadIt can be seen from the chart that there have been sharp increases in the number of people traveling abroad in City X in the past decade. As the chart shows, the year 1995 witnessed only about 10,000 people from this city touring abroad. In 2000, the number soared to nearly 40,000. Last year, more than 120,000 people in the city chose to spend their vacations outside China.A number of factors account for the change in the chart, but the following are the most critical ones. First, thanks to the policy of reform and opening-up, the nation's economy has been developing at a considerably high speed in the past decades. Therefore, the people have more extra money for traveling. Secondly, other relevant state policies and the boom of touring industry provide citizens with more opportunities to go out and see the world. Last but not least, people have attached greater importance to the quality of life, thus they spend more money and time traveling and sight-seeing.In a word, this chart is a perfect indicator of China's fast expanding economy and people's rising standard of life. The trend of traveling abroad will further stimulate the development of our economy and broaden people's horizons.2014年12月英语四六级作文图表图画型范文(二):Reading Preferences四级作文题目:Reading PreferencesIt can be seen from the table that popular fiction is most popular with American students, accounting for 65.9% of book circulation in the library. General nonfiction comes next, taking up 18.2%, while books concerning science, technology and education take up only 10.8%. The least preferred category is that of art, literature and poetry, with a circulation rate of merely 5.1%.A number of factors could account for the reading preferences, but the following are the most critical ones. Firstly, popular fiction is fascinating to the young students. Secondly, books about science and technology are usually too complex and difficult to read. They often contain many special terms which most students can't understand. Finally, in today's market economy, much more emphasis is laid on practical and vocational books rather than arts or poetry.When it comes to me, poetry and art are my favorites. Such kind of books can nourish my mind, broaden my horizons and render me a fresh feeling. Reading a piece of good poetry tends to relieve my burden and lessen my tension, making me more creative and dynamic. It gets me into an imaginary world, fresh and beautiful. I just love it!2014年12月英语四六级作文图表图画型范文(三):Changes in the Ownership of Houses in China四级作文题目:Changes in the Ownership of Houses in ChinaIt can be seen from the chart that there have been dramatic changesin the ownership of houses in China in the past 50 years. While the percentage of state-owned houses has dropped from 70% in 1950's to 20% in 1990's, that of private houses has soared from 30% to 80% during the same period of time.A number of factors could account for the change in the chart, butthe following are the most critical ones. First, thanks to the policy of reform and opening-up, the nation's economy has been developing at a considerably high speed in the past decades. Therefore, people have more extra money to improve their housing. Secondly, other relevant state policies and the boom of real estate industry provide citizens with more opportunities to choose their own dwelling places. Last but not least, people have attached greater importance to their quality of life. Thusmore of them have purchased houses in their own favor.In a word, this chart is a perfect index of China's fast expanding economy and people's rising standard of living. Although a series of problems have arisen in the process, it is reasonable for us to believe that they can be solved in the near future with effective measures taken byboth the government and the public.2014年12月英语四六级作文图表图画型范文(四):Student Use of Computer四级作文题目:Student Use of ComputerStudents tend to use computers more and more frequently nowadays. Reading this chart, we can find that the average number of hours a student spends on the computer per week has increased sharply. In 1990, it was less than 2 hours; and in 1995, it increased to almost 4 hours, and in 2000, the number soared to 20 hours.Obviously computers are becoming increasingly popular. There are several reasons for this change. First, computers facilitate us in more aspects of life. Also, the fast development of the Internet enlarges our demands for using computers. We can easily contact with friends in remote places through the Internet. Besides, the prices of computers are getting lower and lower, which enables more students to purchase them.However, there still exist some problems, such as poor quality,out-of-date designs and so on. And how to balance the time between using computers and studying is also a serious problem. Anyhow, we will benefit a lot from computers as long as we use them properly.。