图表图画类作文.共43页
作文万能模板--图表作文
高考英语作文高三英语复习时要覆盖各类作文题材,以便在考场上看到任何类型的题目都能轻松搞定。
以下为大家整理了图表分析类作文题目及范文,供同学们参阅。
图表作文是高中英语作文中较常见的类型,要求学生通过图中数据和提示内容写一短文,属于比较、对照类。
也可根据提示写为议论文。
通常我们采取三段式写法:第一段:描述图表,得出结论。
第二段:紧扣主题,根据图表比较分析原因,论证结论。
第三段:发表议论,提出自己的看法。
常用句式:1. As can be seen from the chart,...As is shown in the chart,...2. The chart shows that about 60 percent of students want to go to college...3. From the graph/data/results/information above,it can be seen/concluded/show/estimated...4.The graph shows the changes in the number of...over the period from...to...pared with...,the number of the students of...高中英语作文图表作文万能模板:As is shown by the figure/percentage in the table /picture,____ has been on rise/ decrease,significantly/dramatically rising/decreasing from ____ in _____ to _____ in _____. From the sharp rise/decline in the chart,it goes without saying that _____.There are at least two good reasons accounting for _____. In one hand,____.In the other hand,_____ is due to the fact that ______.In addition,______ is responsible for _____. Maybe there are some other reasons to show ______.But it is generally believed that the above mentioned reasons are commonly convincing.As far as I am concerned,I hold the point of view that _______. I am sure my opinion is both sound and well-grounded.DIY:高考英语图表分析类作文题目1最近,你参加了高三年级组织的“你最重视哪科作业”的调查,结果见下面的饼状图。
四级作文之图表图画作文篇(整理)
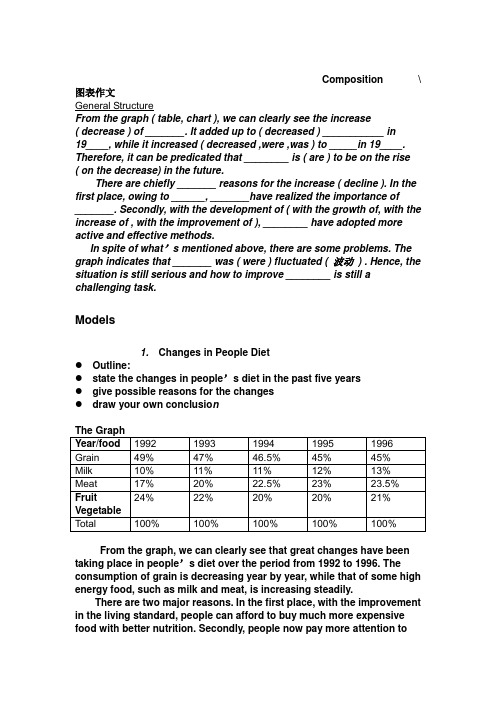
Composition \ 图表作文General StructureFrom the graph ( table, chart ), we can clearly see the increase( decrease ) of _______. It added up to ( decreased ) ___________ in19____, while it increased ( decreased ,were ,was ) to _____in 19____. Therefore, it can be predicated that ________ is ( are ) to be on the rise ( on the decrease) in the future.There are chiefly _______ reasons for the increase ( decline ). In the first place, owing to ______, _______have realized the importance of_______. Secondly, with the development of ( with the growth of, with the increase of , with the improvement of ), ________ have adopted more active and effective methods.In spite of what’s mentioned above, there are some problems. The graph indicates that _______ was ( were ) fluctuated ( 波动) . Hence, the situation is still serious and how to improve ________ is still a challenging task.Models1. Changes in People Diet●Outline:●state the changes in people’s diet in the past five years●give possible reasons for the changes●draw your own conclusio nThe GraphYear/food 1992 1993 1994 1995 1996 Grain 49% 47% 46.5% 45% 45%Milk 10% 11% 11% 12% 13%Meat 17% 20% 22.5% 23% 23.5% 24% 22% 20% 20% 21%FruitVegetableTotal 100% 100% 100% 100% 100%From the graph, we can clearly see that great changes have been taking place in people’s diet over the period from 1992 to 1996. The consumption of grain is decreasing year by year, while that of some high energy food, such as milk and meat, is increasing steadily.There are two major reasons. In the first place, with the improvement in the living standard, people can afford to buy much more expensive food with better nutrition. Secondly, people now pay more attention tothe quality of it, because they know it is of great benefit to their health to diet in a scientific way. Therefore, they try their best to improve the structure of their food.From the above, we can see that people’s living level has been rising markedly in the past five years. And it can be concluded that there will be a more prosperous future waiting for us.2. Production of Radios and TV Sets in Factory A根据左图,写一篇120字的短文。
图文图表英文作文
图文图表英文作文1. The first image shows a group of people enjoying a picnic in the park. They are sitting on a checkered blanket, eating sandwiches and laughing together. The sun is shining, and everyone looks relaxed and happy.2. In the second image, we see a line graph depicting the rise in global temperatures over the past century. The line steadily climbs upward, indicating a clear trendtoward warmer average temperatures worldwide.3. Moving on to the third image, it is a stunningaerial view of a bustling city at night. The skyscrapersare illuminated with colorful lights, and the streets below are filled with cars and people. It's a vibrant and dynamic scene.4. The fourth image is a simple bar chart showing the distribution of wealth in different regions of the world. The wealthiest region has the tallest bar, while thepoorest region's bar is barely visible in comparison.5. Finally, the last image is a beautiful painting of a serene countryside landscape. Rolling hills, a winding river, and a quaint farmhouse all come together to create a peaceful and idyllic setting.In conclusion, these diverse images offer a glimpseinto various aspects of life, from leisure and enjoyment to pressing global issues and the beauty of nature. Each one tells its own unique story and evokes different emotions.。
2020年四级作文万能模板:图表图画型范文(五)

2020年四级作文万能模板:图表图画型范文(五)四级作文题目: Health Gains in Developing CountriesIt can be seen from the charts that there have been dramatic changes in life expectancy and infant mortality in developing countries in the past decades. As the chart shows, people's life expectancy soared from 40 years old to 60 years old from 1960 to 1990. Meanwhile, infant mortality declined from 200 to 150 deaths per thousand births.The changes in the charts may be attributed to a numberof factors, but the following are the most critical ones. First, developing countries' economy has been developing at a considerably high speed in the past decades. Therefore,people have more extra money to improve their health. Secondly, the advances in medical sciences and boom ofmedical industry provide citizens with more opportunities to cure their diseases. Last but not least, people have attached greater importance to their quality of life, thus they have spent more money and time to build up their bodies.In a word, these charts are perfect indexes of developing nations' fast expanding economy and people's rising standardof life. Although a series of problems have arisen in the process, it is reasonable for us to believe that they can be solved in the near future with effective measures taken byboth the government and the public.(或If this trend continues, developing countries willsoon approach the developed countries in terms of health care. People will live longer and healthier lives. The result ofthis will be happier and more productive populations.)。
图表图画型作文
• From January to March last year it increased by (增长了) 45%.(如果你数学很烂,你不会算或没 时间算,那你就写成increase from 22% to 32%或者 随便编个数据,你说改卷的人会不会去算?他没病!) From March to June it dropped by about half the previous rate. From January to March last year it increased by 45%. From March to June it dropped by about half the previous rate. From June to August there was a steep rise of 50%. After that, however, there was a steady decrease.
• 如曲线图所示,从1980年到1982年,拥 有个人电脑的美国家庭的百分比,从大 约0.2%缓慢上升到正好5%。然后这一 百分比又急剧上升,达到1983年的大约 10%。此后,该百分比持续上升,直到 达到了1988年的最高值21.0%。
• As the curve indicates, the percentage of American families who owned personal computers increased gradually from approximately 0.2% in 1980 to exactly 5% in 1982. Then, there was a substantial increase in this proportion, reaching some 10% in 1983. Finally, the period between 1983 to 1988 witnessed a steady growth, to the peak of 21.0% in the latter year. It can be observed easily that computer has become an indispensable part for American society.
2020年大学英语四级作文万能模板:图表图画型范文(四)
2020年大学英语四级作文万能模板:图表图画型范文(四)四级作文题目:Student Use of ComputerStudents tend to use computers more and more frequently nowadays. Reading this chart, we can find that the average number of hours a student spends on the computer per week has increased sharply. In 1990, it was less than 2 hours; and in 1995, it increased to almost 4 hours, and in 2000, the number soared to 20 hours.Obviously computers are becoming increasingly popular. There are several reasons for this change. First, computers facilitate us in more aspects of life. Also, the fast development of the Internet enlarges our demands for using computers. We can easily contact with friends in remote places through the Internet. Besides, the prices of computers are getting lower and lower, which enables more students to purchase them.However, there still exist some problems, such as poor quality, out-of-date designs and so on. And how to balance the time between using computers and studying is also a serious problem. Anyhow, we will benefit a lot from computers as long as we use them properly.。
图表图画类作文
描述增减变化
5. No increase is shown in 1965; then came a sharp increase of eight million. 6. A is more/less expensive than B. 7. A’s production was more/less than that of B. 8. In 1990 the number remained the same/ dropped to
图表作文的常用词
上升:increaseup climb mount level up 下降: decrease fall drop descend decline reduce lessen level down 平稳:stable steady remain/maintain/keep/be the same as/similar to
图表作文的写作要看清数据的变化, 通过坐标和图表纵横比较说明事实,并且 从表面看到实质,了解变化反映的深层意 义。 图画作文的难点在于对图画信息的描 述是否准确。然后要点破图画的寓意,分 析背后的原因,这是文章的重头戏,所以 在复习中就要多看些报刊文摘的图片,多 关注社会热点也是很好的锻炼方式。
写作模板——图表式作文
It is obvious in the graphic/table that the rate/number/amount of Y has undergone dramatic changes. It has gone up/grown/fallen/dropped considerably in recent years (as X varies). At the point of X1, Y reaches its peak value of …(多少).
四级作文之图表图画作文篇(整理)

四级作文之图表图画作文篇(整理)Composition \ 图表作文General StructureFrom the graph ( table, chart ), we can clearly see the increase ( decrease ) of _______. It added up to ( decreased ) ___________ in19____, while it increased ( decreased ,were ,was ) to _____in 19____. Therefore, it can be predicated that ________ is ( are ) to be on the rise ( on the decrease) in the future.There are chiefly _______ reasons for the increase ( decline ). In the first place, owing to ______, _______have realized the importance of_______. Secondly, with the development of ( with the growth of, with the increase of , with the improvement of ), ________ have adopted more active and effective methods.In spite of what’s mentioned above, there are some problems. The graph indicates that _______ was ( were ) fluctuated ( 波动) . Hence, the situation is still serious and how to improve ________ is still a challenging task.Models1. Changes in People Diet●Outline:●state the changes in people’s diet in the past five years●give possible reasons for the changes●draw your own conclusio nThe GraphYear/food 1992 1993 1994 1995 1996 Grain 49% 47% 46.5% 45% 45%Milk 10% 11% 11% 12% 13%Meat 17% 20% 22.5% 23% 23.5% 24% 22% 20% 20% 21%FruitVegetableTotal 100% 100% 100% 100% 100%From the graph, we can clearly see that great changes have been taking place in people’s diet over the period from 1992 to 1996. The consumption of grain is decreasing year by year, while that of some high energy food, such as milk and meat, is increasing steadily.There are two major reasons. In the first place, with the improvement in the living standard, people can afford to buy much more expensive food with better nutrition. Secondly, people now pay more attention tothe quality of it, because they know it is of great benefit to their health to diet in a scientific way. Therefore, they try their best to improve the structure of their food.From the above, we c an see that people’s living level has been rising markedly in the past five years. And it can be concluded that there will be a more prosperous future waiting for us.2. Production of Radios and TV Sets in Factory A根据左图,写一篇120字的短文。