四级作文之图表图画作文篇(整理)
英语四级图表类作文
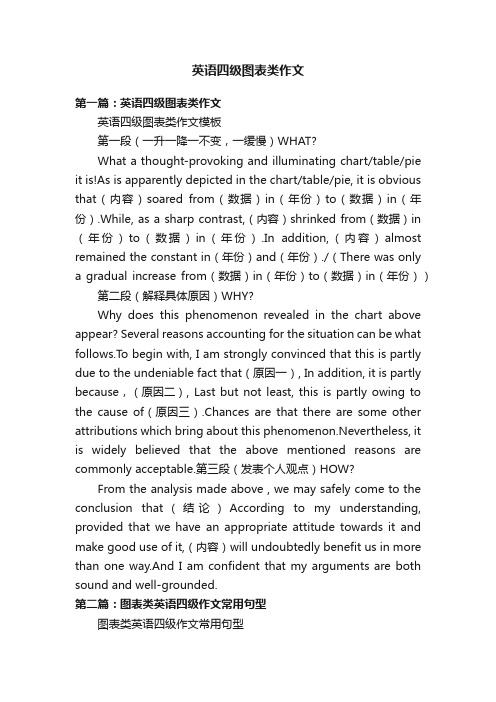
英语四级图表类作文第一篇:英语四级图表类作文英语四级图表类作文模板第一段(一升一降一不变,一缓慢)WHAT?What a thought-provoking and illuminating chart/table/pie it is!As is apparently depicted in the chart/table/pie, it is obvious that(内容)soared from(数据)in(年份)to(数据)in(年份).While, as a sharp contrast,(内容)shrinked from(数据)in (年份)to(数据)in(年份).In addition,(内容)almost remained the constant in(年份)and(年份)./(There was only a gradual increase from(数据)in(年份)to(数据)in(年份))第二段(解释具体原因)WHY?Why does this phenomenon revealed in the chart above appear? Several reasons accounting for the situation can be what follows.T o begin with, I am strongly convinced that this is partly due to the undeniable fact that(原因一), In addition, it is partly because,(原因二), Last but not least, this is partly owing to the cause of(原因三).Chances are that there are some other attributions which bring about this phenomenon.Nevertheless, it is widely believed that the above mentioned reasons are commonly acceptable.第三段(发表个人观点)HOW?From the analysis made above , we may safely come to the conclusion that(结论)According to my understanding, provided that we have an appropriate attitude towards it and make good use of it,(内容)will undoubtedly benefit us in more than one way.And I am confident that my arguments are both sound and well-grounded.第二篇:图表类英语四级作文常用句型图表类英语四级作文常用句型开篇句式1)According to the figures given in the table,+ 主题句(the world population is increasing rapidly.2)The table(pie chart, line graph, bar graph)shows(indicates, illustrates, makes it clear)that +主题句(One’s income is closely linked to one’s age and education)3)It can be seen from(It is clear from, It is evident from, It is illustrated from the table that + 主题句(the better one is educated , the higher his income is)4)As the bar chart shows, the number of people below poverty line decreased dramatically during the years of 1978 to 1998.图表式作文模板写作模板——图表式作文It is obvious in the graphic/table that the rate/number/amount of Y has undergone dramatic changes.It has gone up/grown/fallen/dropped considerably in recent years(as X varies).At the point of X1, Y reaches its peak value of …(多少).What is the reason for this change? Mainly there are …(多少)reasons behind the situation reflected in the graphic/table.First of all, …(第一个原因).Mor e importantly, …(第二个原因).Most important of all, …(第三个原因).From the above discussions, we have enough reason to predict what will happen in the near future.The trend described in the graphic/table will continue for quite a long time(if necessary measures are not taken括号里的使用于那些不太好的变化趋势).1.the table shows the changes in the number of……over the period from……to…… 该表格描述了在……年之……年间……数量的变化。
英语四级图表+图画作文讲解及参考范文

英语四级图表和图画作文讲解及参考范文一、图表作文图表作文也是四(六)级考试中常见,而且被认为是一种较难的作文形式。
图表作文就是把非文字信息(通常为各种图表表示的数字信息等)转换成文字信息的一种作文。
它要求我们用文字来描述非文字性的图表或对图表显示的关系作解释说明。
第一节图表作文的出题形式和写作要领一、图表作文常见出题形式图表作文一般在题目中给出作文的标题和一个或几个统计表格、圆形图、曲线图或条形图,有时还用英文或中文提纲的形式给出提示,要求我们:1)用文字描述图表,客观解释图表中所传递的信息,并找出某种规律或趋势;2)就图表中所反映的某种趋势或问题分析其原因或后果。
图表作文着重说明事实,常常是通过对图表中所反映的具体数据的说明、分析、比拟,对某种事物或现象的事实或变化情况等加以说明,并提出结论或看法。
因此,图表作文常常采用议论文体的写作方法。
写好图表作文,关键在于能否读懂图表中所提供的信息,把握各信息间的联系,用准确流畅的语言把这一信息表达出来,并就这一信息发表自己的看法。
二、图表作文的写作步骤写图表作文时,要注意遵循以下步骤:1)认真分析图表的含义,弄清图表中所含的信息及不同信息间的关系;2)确定文章的主题思想,构思出文章的根本框架,筛选出能说明图表主题思想的典型数据;3)编列文章的提纲;4)根据文章的提纲,将各段的提纲内容扩展成段落,然后将各个段落组成文章,注意段与段之间的衔接与过渡;5)检查与修改。
三、图表作文的篇章结构写图表作文时,常采用三段式的陈述方式。
文章的第一段往往分析图表中的数据变化反映什么问题或趋势,概述图表所揭示的信息。
第二段分析造成这一问题或趋势的原因。
第三段那么展望未来的情况或提出解决问题的方法或建议。
这一结构可以简单地表述为:第一段:概述图表反映的主题思想〔总趋势+极端值+特点,时态〕第二段:分析产生的原因第三段:展望未来或提出方法或建议模板一①总的趋势②图表具体描述③剖析图表所揭示的含义④理由一⑤理由二⑥理由三⑦理由四⑧总结⑨前景预测As can be seen from the table, the past decade has witnessed dramatic changes in①______. While ②_______. It is obvious from the table that③_________.What contributed to these changes? I think the reasons are as follows. To start with,④______. Secondly, ⑤______ . What’s more, ⑥ _______. Last but not lease, ⑦________. In conclusion, ⑧_________. Moreover, ⑨ ________.模板二①描述图表②分三方面解释原因③下结论1) During the period from _______to _______, ________rose from ________to _______, while _______ decreased from _______ to _______.2) We believe that three reasons can account for this phenomenon. First,____. Second, ____. Third, _____.3) ___.We are happy to see that things are becoming better and better nowadays. We can imagine that ___.模板三①描述图表②解释图表③补充解释1) During the period between _______ and ________, ________ declined abruptly from_______ to ________, while ________ increased sharply from ________ to _______.2) Several reasons can account for this phenomenon. Compared with _________ is much cheaper and more convenient__________ . Apart from that, _________.3) However, there are still a number of people who _________, generally for two reasons. On the one hand,________. On the other hand, ________.1.图表类型:table 表格; chart 图表; diagram图表或图解,示意图; graph图表, 曲线图; column/ bar chart柱状图; pie graph饼图2. 描述:show; describe; illustrate; can be seen from; clear; apparent; reveal 显示; represent表现,描绘3.内容:figure数字; statistic统计值; statistics [用作复]统计, 统计数字[资料], 统计表number; percentage; proportion● 表示数据上升:increase, rise, ascend, core, surge, go up, climb, mount, level up下降: decrease, fall, drop, descend, decline, reduce ,lessen, level, down平稳: stable, steady, remain steady/stable; /maintain/keep/be the same as/similarto ; little/hardly any /no change波动: fluctuate, fluctuation, rise and falls, up and down占: occupy,take up,account for, gain而: while, however, whereas , on the other hand, actually/in fact相比: by contract, on the contrary, likewise, compared with最高点: the highest, the top, the summit, the peak, the most最低点: bottom, less, least, rock bottom最低点例句Prices have hit rock bottom. 价格已达最低水平平均: mean平均值, average趋势: tendency, trend, inclination预见: prediction到达顶峰: mount to比例:20 per cent , 20%one in three, 1/3one out of every four,1/4有一个稳定的过程: a stable period can be seen表示变化程度的词:sudden/suddenly 突然的,意外的rapid/rapidly 迅速的,飞快的,险峻的dramatic/dramatically 戏剧性的,生动的significant/significantly 有意义的,重大的,重要的sharp/sharply 明显的,急剧的steep/steeply 急剧升降的steady/steadily 稳固的,坚决不移的gradual/gradually 渐进的,逐渐的slow/slowly 缓慢的,不活泼的slight/slightly 轻微的、略微地stable/stably 稳定的表示范围:from…to… between…and… for …to …多长时间直到表示程度:almost adv. 几乎,差不多nearly adv. 几乎,密切地approximately adv. 近似的,大约just over 刚超过exactly adv. 正确地,严密地precisely adv. 正好精确地;清晰地●常用词和短语significant changes 图中一些较大变化noticeable trend 明显趋势during the same period 在同一时期grow/grew 增长distribute 分布,区别unequally 不相等地pronounced 明显的average 平均no doubt 无疑地corresponding adj. 相应的,通讯的represent vt. 阐述,表现overall 体上讲except 除外in the case of adv. 在…的情况下in contrast 相反,大不相同in conclusion adv. 最后,总之in comparison 相比之下inversely adv. 相反地,倒转地in general 通常,大体上,一般而言rang from…to 从…到…不等excessive adj. 过多的,过分的,额外lower v. 降低,跌落elapse vi. 〔时间〕过去,消逝category n. 种类government policy 政府政策market forces 市场规律measure n. 尺寸,方法,措施v.估量,调节forecast n. 先见,预见四、图表作文常用的句型(1)常用的开篇句型(即概述图表内容时常用的表达法)①According to the table/pie chart/line graph/bar graph, we can see/conclude that … 根据该表/图,我们可知……②The table/graph reveals (shows/indicates/illustrates/ represents/points out) that … 该表/图说明……③As we can see from the table …As can be seen from the line/bar graph …As is shown (illustrated/indicated) in the pie chart …如表/图所示,……(2) 描述增减变化常用的句型①Compared with … is still increased by …②The number of … grew/rose from … to …③An increase is shown in …; then came a sharp increase of …④In … the number remains the same/drops to …⑤ There was a very slight (small/slow/gradual) rise/increase in 1990.⑥ There was a very steady (marked/sharp/rapid/sudden/ dramatic) drop(decrease/decline/fall/reduction) in 1998/ compared with that of last year).来看一篇范文:⑴ From the graph, we can see that the number of car accidents in Walton city fluctuated during the year of 1990. ⑵ The first two months of 1990 showed an increasing trend. ⑶ The rate rose to 32 in March but fell to 26 in June. ⑷ From June on, the rate was rising again and reached the peak point 39 in August. ⑸ After August the rate began to decline remarkably, and eventually dropped to the lowest point 16 at the end of the year. ⑹Therefore, it’s obvious that car a ccident in Walton city declined in 1990.⑴主题句/概述表格反映的内容⑵—(5)反映交通事故的变化情况(6)小结:总结表格数据反映的总趋势⑺There are several reasons for the decline. ⑻ First, a new traffic law was made and came into force. ⑼ It provided that in summer every car must be air-conditioned. ⑽ As a result, the highest rate in August, when humidity and high temperature make drivers impatient and easily lead to car accidents, dropped steadily. ⑾ Second, new roads were built and some narrow streets were widened, which quickened the flow of traffic. ⑿ Finally, the city administration made great efforts to heighten people’s awareness of observing traffic rules.⑺主题句⑻原因/措施一⑼解释措施一/次要辅助⑽采取措施一后的结果⑾原因/措施二⑿原因/措施三⒀With all these new measures, I’m sure the rate of car accidents in Walton city will go on falling this year.⒀总结:展望未来的情况第二节图表作文样题与样文举例样题一:Directions: For this part, you are allowed 30 minutes to write a composition on the topic How People Spend Their Holidays. You should write at least 120 words, and base your composition on the table and the outline given below:1、根据上表,简要描述1990年、1995年、2000年某城市人们度假方式的情况及其变化;2、请说明发生这些变化的原因;3、得出结论。
四级作文考题形式

四级作文考题形式篇一《论四级作文中的图画作文》四级作文有一种考题形式是图画作文,这可有点像小时候看的那种“看图说话”,不过难度系数明显上升。
就拿我上次考四级遇到的图画作文来说吧。
那幅图上画的是一个人站在好几个岔路口面前,满脸的迷茫,旁边还有不同的指示牌指向不同的方向,每个方向上还有一些模糊的场景图,像是代表着不同的职业或者生活选择。
我当时看到这图啊,心里就“咯噔”一下,这到底想表达啥呢?是讲人生道路的选择呢,还是说现代社会的多元化让人无所适从呢?我就这么盯着那图开始胡思乱想起来。
我本来以为看着图瞎编几句就能把字数凑够,可没那么简单。
我得描述这图,还得分析背后的意义,最后得出个结论。
我努力地在自己头脑里搜刮那些关于选择的词汇,什么“alternative”“option”之类的。
描述图的时候更是绞尽脑汁,得说出这个人的表情、周围的环境、指示牌的样子。
我写这个人“眼睛睁得大大的,眉毛紧紧地皱在一起,嘴巴微微张开,就像个被困住的小兽”,指示牌的话就说“那些指示牌五颜六色的,有的上面画着高楼大厦,可能代表着去城市打拼的路;有的画着田野和农舍,也许是代表归园田居的惬意选择”。
分析的时候我就想到自己的经历了,我当初选专业的时候不也是在好几个选择那儿晃悠吗?只不过那时候没有这么生动形象地画出来给我看。
费了好大的劲儿才把这个图画作文写完,还不知道写得咋样。
图画作文就是这样,看似简单瞥一眼图就行,实际上里面暗藏玄机,必须把图看透彻,还得把自己的想法有条理地和图联系起来,真是四级作文里一个不小的挑战。
篇二《四级的议论文题目真要命》四级作文还有议论文的题目,这对我这种一辩论就脑子乱的人来说就像是噩梦。
记得有一次练习四级作文的议论文,题目是关于环境保护的,就是“论环境保护的重要性及我们的责任”。
我当时就在想啊,环境保护谁不知道重要啊,可真要我写起来就觉得千头万绪不知道从哪儿下嘴。
我先是按照常规,在开头来个很直白的引入,“Nowadays, the environment is getting worse and worse.”这一句虽然挺普通但是很符合我当时看到题目那一瞬间的想法。
2020年英语四级作文题目模板:图表图画型范文(一)
2020年英语四级作文题目模板:图表图画型范文(一)四级作文题目:Traveling AbroadIt can be seen from the chart that there have been sharp increases in the number of people traveling abroad in City Xin the past decade. As the chart shows, the year 1995witnessed only about 10,000 people from this city touring abroad. In 2000, the number soared to nearly 40,000. Last year, more than 120,000 people in the city chose to spendtheir vacations outside China.A number of factors account for the change in the chart, but the following are the most critical ones. First, thanksto the policy of reform and opening-up, the nation's economy has been developing at a considerably high speed in the past decades. Therefore, the people have more extra money for traveling. Secondly, other relevant state policies and the boom of touring industry provide citizens with more opportunities to go out and see the world. Last but not least, people have attached greater importance to the quality oflife, thus they spend more money and time traveling andsight-seeing.In a word, this chart is a perfect indicator of China'sfast expanding economy and people's rising standard of life. The trend of traveling abroad will further stimulate the development of our economy and broaden people's horizons.。
英语图表作文精选10篇

英语图表作文精选10篇四级英语作文图表类篇一图片模板:It seems to me that the cartoon / drawing issending a message about ____________(图画内容),which reveals ____________(稍作评价).In myperspective of view, ____________ (表明个人观点)。
Apparently, ____________(将个人观点和图片内容相结合,得出观点。
)For one thing, ____________(从社会角度论证).For another thing, ____________(从个人角度说明).For example, ____________(自己、朋友或他人,只要自己知道或听过的例子).Last but not least, ____________(从反面角度谈论).Asa result, the drawer of the illustration is urging us to _____________(建议或措施).Only inthis way can we ____________(展望结果).In conclusion / To my understanding, ____________(再次表明观点或态度).We should____________(进一步说明个人的观点).图表模板:According to the bar chart / pie chart / line graph displays the changes in the numberof____________(图表整体趋势).There was an increase in ____________(图表细节).At the point of ____________, ____________reaches its peak value of ____________(数据或变化).What has caused these changes? There are mainly three reasons.Firstly, ____________ (原因一).Secondly, ____________(原因二).The number of ____________ increased overthe period.____________ rose by _________ from ________ to ________________.Andthere were____________.Finally, ____________(最后一个原因).In conclusion / We can safely draw the conclusion that ____________(结论).Therefore, ____________(进一步谈论更多个人想法).英语四级图表类作文篇二In the morning, the clear sky, father-in-law of the sun was inlaid with a golden halo. A group of happy little magpies chirped in the branches, as if holding a singing contest, very lively!Noon is the hottest time of the day. The sun gave out a blazing light, as if to roast the earth. There was no one in the street. Everyone hid in the house to blow the air conditioner, for fear that they would be cooked outside. At this time, the little magpie on the tree also became quiet, they all hide in the deep leaves of the nap. Only the indefatigable cicada was still shouting “hot, hot.。
2020年四级作文万能模板:图表图画型范文(五)

2020年四级作文万能模板:图表图画型范文(五)四级作文题目: Health Gains in Developing CountriesIt can be seen from the charts that there have been dramatic changes in life expectancy and infant mortality in developing countries in the past decades. As the chart shows, people's life expectancy soared from 40 years old to 60 years old from 1960 to 1990. Meanwhile, infant mortality declined from 200 to 150 deaths per thousand births.The changes in the charts may be attributed to a numberof factors, but the following are the most critical ones. First, developing countries' economy has been developing at a considerably high speed in the past decades. Therefore,people have more extra money to improve their health. Secondly, the advances in medical sciences and boom ofmedical industry provide citizens with more opportunities to cure their diseases. Last but not least, people have attached greater importance to their quality of life, thus they have spent more money and time to build up their bodies.In a word, these charts are perfect indexes of developing nations' fast expanding economy and people's rising standardof life. Although a series of problems have arisen in the process, it is reasonable for us to believe that they can be solved in the near future with effective measures taken byboth the government and the public.(或If this trend continues, developing countries willsoon approach the developed countries in terms of health care. People will live longer and healthier lives. The result ofthis will be happier and more productive populations.)。
专业四级看图作文-(精选5篇)

专业四级看图作文-(精选5篇)第一篇:专业四级看图作文-模板一① 总的趋势② 图表具体描述③剖析图表所揭示的含义④理由一⑤ 理由二⑥理由三⑦ 理由四⑧总结⑨ 前景预测As can be seen from the table, the past decade has witnessed dramatic changes in①______.While ②_______.It is obvious from the table that③_________.What contributed to these changes? I think the reasons are as follows.To start with, ④______.Secondly, ⑤______.What’s more, ⑥ _______.Last but not lease, ⑦________.In conclusion, ⑧_________.Moreover, ⑨ ________.模板二①描述图表②分三方面解释原因③下结论1)During the period from _______to _______, ________rose from ________to _______, while _______ decreased from _______ to _______.2)We believe that three reasons can account for this phenomenon.First,____.Second, ____.Third, _____.3)___.We are happy to see that things are becoming better and better nowadays.We can imagine that ___.模板三①描述图表②解释图表③补充解释1)During the period between _______ and ________, ________ declined abruptly from _______ to ________, while ________ increased sharply from ________ to _______.2)Several reasons can account for this pared with _________ is much cheaper and more convenient__________.Apart from that, _________.3)However, there are still a number of people who _________, generally for two reasons.On the one hand,________.On the other hand, ________. 第二篇:四级看图作文英语四级图表作文讲解及参考范文图表作文也是四(六)级考试中常见,而且被认为是一种较难的作文形式。
大学英语四级图表类写作
So from the analysis, we can draw a conclusion that our society is progressing and people are living a bettler life than ever before. We are now able to purchase more delicious and nutritious food, resulting in an improvement in our health.
3. 上图所示为某校大学生平均每周使用计算机的时间:1990年(2hours),1995 年(4hours), 2000(20hours), 请描述变化:
4. 请说明发生这些变化的原因(可从计算机的用途、价格或社会发展等方面加以 说明)
5. 你认为目前大学生在计算机使用中有什么困难和问题。
第一章节
0 第一季度 第二季度 第三季度 第四季度
东部 西部 北部
Bar graph
Pie chart
Line graph
Line graph
谋篇方法
一.先描写数据变化 二.再分析变化背后的原因 三.最后是笔者的个人看法,预测未来的发展趋势或提
出解决问题的方法。
如何写好图表作文
• 对比分析,寻找数据的变化规律 • 举例(1991.6)Changes in People’s Diet • Directions: • For this part, you are allowed 30 minutes to write a composition
table
一.State the changes in people’s diet(饮食)in the past five years;
- 1、下载文档前请自行甄别文档内容的完整性,平台不提供额外的编辑、内容补充、找答案等附加服务。
- 2、"仅部分预览"的文档,不可在线预览部分如存在完整性等问题,可反馈申请退款(可完整预览的文档不适用该条件!)。
- 3、如文档侵犯您的权益,请联系客服反馈,我们会尽快为您处理(人工客服工作时间:9:00-18:30)。
Composition \ 图表作文General StructureFrom the graph ( table, chart ), we can clearly see the increase( decrease ) of _______. It added up to ( decreased ) ___________ in19____, while it increased ( decreased ,were ,was ) to _____in 19____. Therefore, it can be predicated that ________ is ( are ) to be on the rise ( on the decrease) in the future.There are chiefly _______ reasons for the increase ( decline ). In the first place, owing to ______, _______have realized the importance of_______. Secondly, with the development of ( with the growth of, with the increase of , with the improvement of ), ________ have adopted more active and effective methods.In spite of what’s mentioned above, there are some problems. The graph indicates that _______ was ( were ) fluctuated ( 波动) . Hence, the situation is still serious and how to improve ________ is still a challenging task.Models1. Changes in People Diet●Outline:●state the changes in people’s diet in the past five years●give possible reasons for the changes●draw your own conclusio nThe GraphYear/food 1992 1993 1994 1995 1996 Grain 49% 47% 46.5% 45% 45%Milk 10% 11% 11% 12% 13%Meat 17% 20% 22.5% 23% 23.5% 24% 22% 20% 20% 21%FruitVegetableTotal 100% 100% 100% 100% 100%From the graph, we can clearly see that great changes have been taking place in people’s diet over the period from 1992 to 1996. The consumption of grain is decreasing year by year, while that of some high energy food, such as milk and meat, is increasing steadily.There are two major reasons. In the first place, with the improvement in the living standard, people can afford to buy much more expensive food with better nutrition. Secondly, people now pay more attention tothe quality of it, because they know it is of great benefit to their health to diet in a scientific way. Therefore, they try their best to improve the structure of their food.From the above, we can see that people’s living level has been rising markedly in the past five years. And it can be concluded that there will be a more prosperous future waiting for us.2. Production of Radios and TV Sets in Factory A根据左图,写一篇120字的短文。
Production of Radios and TV Sets in Factory AAccording to the graph, during the period from 1980 to 1989, there was gradual decline in the production of radios in Factory A. It fell from 1,600 sets per month in 1980 to 1,000 ,sets per month in 1989. Thus, there was a total fall of 600 sets per monthly output during the ten years.On the other hand, there was a marked increase in the product km of TV sets, The factory produced only 200 sets in 1980, but the output rose to 1, 200 sets per month in 1989. Thus. there was a total increase of 1,000 sets per month during the ten years period. The present output appears stable at 1,200 sets per month.Traveling Abroad图表作文模板●①As can be clearly seen from the graph/table/chart,●great changed have taken place in _________ ①图表显示的情况●Or: As is shown in the table/figure, .●②The __________ have/has skyrocketed/jumped from _____ to _____.②描述变化●③When it comes to the reasons for the changes, different people givedifferent explanations. Here I shall just give a few. ③概述原因●④To begin with, . ④原因之一●⑤What’s more, . ⑤原因之二●⑥Last but not least, . ⑥原因之三●⑦While it is desirable that ___________, there are still someproblems and difficulties for __________ ⑦话题转移●⑧Firstly, __________ ⑧要点一●⑨In addition, __________ ⑨要点二●⑩In a word, __________ ⑩总结●补充常见表达:● 1.As we can see from the chart/graph/table/diagram…● 2.The chart/graph/table/diagram shows that…●As is shown in…; According to…; As can be seen in…● 3. This chart/graph/table/diagram shows agreat/sharp/sudden/slow/rapid…. increase/drop...● 4. To make a generalization; on the whole; in general/generallyspeaking● 5. 表示增长、上升的词汇●increase, rise, climb, go up, soar, skyrocket,副词:sharply,remarkably, obviously, significantly, gradually, slowly● 6. 表示下降、减少的词汇decrease, drop, fall, go down, decline●7. 表示持续不变的词汇level off; remain steady/unchanged●8. 表示倍数的词汇●double; triple the number of/the percentage of; four/five times●9. 表示多少的词汇a little/ much/ a lot more/less than…, over…图表作文框架:第一段只写三句第一句:As is shown in the graph above, we can see clearly that great changes have taken place in … from…to…第二句:The first … years saw…第三句:The last … years witnessed …第二段只写四句第一句:What has caused this problem? It seems to me that there are …reasons.第二句:Firstly, …/ 第三句:Secondly,…/第四句:Finally,…第三段只写四句第一句:How to solve the problem has become a hot issue among many people. 第二句:For one thing, …// 第三句:For another, …第四句:Only in this way can we successfully solve the problem.不同观点作文第一段一般只写三句●第一句:It is widely believed that by many people for some time that ...●第二句:One reason they think is that...●第三句:The other reason they hold is that...第二段一般只写三句●第一句:While others argue that ...●第二句:They maintain that...●第三句:They also claim that...第三段写四句●第一句:From what has been discussed above, we may come to theconclusion that ...●第二句:On the one hand, ...●第三句:On the other hand, ...●第四句:Only in this way can we ...书信作文第一段只写两句●第一句:I am writing this letter today to …●第二句:My name is … and I am …第二段按照题目要求写:第三段只写三句第一句:I sincerely hope you can take my letter seriously.第二句:Your prompt response will be highly appreciated.第三句:Thanks a lot for your time and consideration.现象作文第一段只写两句●第一句:In recent years, there has been…●第二句:How to solve the problem has become a hot issue among manypeople.第二段只写四句●第一句:What has caused this problem? It seems to me that there are …reasons.●第二句:Firstly, …●第三句:Secondly,…●第四句:Finally,…第三段只写四句●第一句:How to solve the problem has become a hot issue among manypeople.●第二句:For one thing, …●第三句:For another, …●第四句:Only in this way can we successfully solve the problem.谚语作文第一段只写四句●第一句:It is … that …●第二句:You cannot … until you …●第三句:The more you …, the more …●第四句:If you …, you …第二段举例写The Harmfulness of Smoking● 1. Show your understanding of the symbolic meaning of the cartoon;● 2. Give reasons why smoking is harmful; and● 3. How we can solve the problem.Model Composition●As is shown in the cartoon, when the man is enjoying the cigarette,the smoke becomes a monster (怪物) which will devour him. This picture tells us vividly that smoking is harmful to people.●The harmfulness of smoking can be illustrated in three aspects.First of all, smoking does harm to people’s health. It is common knowledge that many deadly diseases derive from smoking. The best example is lung cancer. In addition, smoking costs a lot of money.It is estimated that tens of billions of yuan is spent on cigarettes every year in our country, which is a huge waste. Last but not the least important, smoking may cause fire. Do you still remember the big fire in Northeastern China which caused serious damages to people’s lives and properties?●Since smoking does so many harms, every one of us should try todo something to put an end to the problem. The government should make stricter rules to prohibit smoking in public places and the smokers should give up smoking.The Tears of A Bird● 1·Describe the cartoon and deduce the purpose of the drawer of the picture;●2·State the harmful effects of the phenomenon;●3·Give suggestions as to how to solve the problem.●As can be clearly seen from the cartoon, a bird is sitting on the top of ahuge ax, with tears streaming from its eyes. Because all the trees are cut down, the bird will have no habitat. The cartoon conveys the meaning that it is urgent to preserve the woods for the birds and protect the environmentfor human beings.●The cutting of trees, as well as the destruction of our environment, maylead to several harms as follows. In the first place, the trees provide us with many vital things we humans need, such as oxygen, food, shelter and so on. The animals, such as the bird in the picture, also need the trees. In the second place, if trees are cut down, then there will be nothing to retain the rain water, thus floods will happen more often in the future. Last but not least, there is only one earth. If the environment is destroyed, then we will have no place to live in.Since this phenomenon causes so many harmful effects, we have to come up with some measures to deal with it. First of all, the authorities should adopt the policy of “sustainable development”, just as our government has been doing. What’s more, every citizen should realize the seriousness of the problem and make concerted efforts to protect our environment.Love●Among all the worthy feelings of mankind, love is probably the noblest, buteveryone has his/her understanding of it.●There has been a discussion recently on the issue in a newspaper. Write anessay to the newspaper to●1·show your understanding of the symbolic meaning of the picture below,●2·give a specific example, and●3·give your suggestion as to the●best way to show love.●It is generally believed that love is a hot topic which is most talked about.This is true not only in China but also in other countries. Love is of theutmost importance to the human beings. As is described in the picture, “love is a lamp which is brighter in darker places.”This is indeed true.People in darker places need more light than ordinary people.●Take my neighbor as an example. There are three members in their familyand the two adults were laid off last year. The only child will have to drop out of school next semester. In order to help them, I donated all my money —300 yuan to pay the tuition. And I plan to call on others to donate more money. Though I cannot do a lot, I have given love which is like a lamp ina dark place where light is most needed.●So to sum up, we should offer our help to all who are in need. We expect toget love from others and we also give love to others. I believe that therelationship between people will be harmonious and our society will be a better place for us to live in.。