
2020版BP世界能源统计年鉴(英文版)
2020 | 69th edition
For 66 years, the BP Statistical Review of World Energy has provided high-quality objective and globally consistent data on world energy markets. The review is one of the most widely respected and authoritative publications in the field of energy economics, used for reference by the media,
hydroelectricity, nuclear energEsymxapanlrotdrpehretohnneeew.wCoaurblsdlteoosmf .eizneercghyarftrsomanydopuerrtfaobrmlettohre
• PDF versions and PowerPointcsallicduelaptioancsk.sRoefvtiehwe tchheadrtasta, monalipnes and offline.
The StatisticaalcRadeevmieiwa, woofrWld goorvlderEnmneerngtsyaanndaelynseergsy data on worldcoemnepargniyesm. Aarnkeewtsedfritoiomn isthpeubplirsihoerdyeevaerr.y June.
• Regional and country factsheets.
• Videos and speeches.
Energy Outlook
Discover more online
Watch the BP Energy Outlook 2017 video, containing our projections of long-term energy
Explore the world of energy from your tablet or smartphone. Customize charts and perform the calculations. Review the data online and offline. Download the app for free from the Apple App Store and Google play store.
• Historical data from 1965 for many sections. Additional country and regional coverageDfoorwalnl clooansdutmhpetiBonPtWabolersld. Energy app
• Additional data for refined oil production demand, natural gas, coal,
The Review has been providing timely, comprehensive and objectiveDdiscaovtear mtoore the online energy community since 1952.
All the tables and charts found in the latest printed edition are available at /statisticalreview plus a number of extras, including:
• The energy charting tool – view predetermined reports or chart specific data according to energy type, region, country and year.
• Historical data from 1965 for many sections.
• Additional data for refined oil production demand, natural gas, coal, hydroelectricity, nuclear energy and renewables.
• PDF versions and PowerPoint slide packs of the charts, maps and graphs, plus an Excel workbook of the data.
• The energy charting tool – viewJopinrethdeetceormnvienresdatrieopnorts or chart specific data according to ene#rgByPstytaptes, region, country and year.
All the tables and charts found inttrehnedpsrtinot2e0d3e5.dDitioownnaloreadatvhaeilabboloeklet and at /statisticalreview plus apnreusmenbteatrioonf emxattrearsia,lsinactlubdpi.ncogm: /energyoutlook
and graphs, plus an Excel workbook and database format of
the data.
Download the app for free from the Apple
App Store and Google play store.
Download the bp World Energy app
对制定中国能源低碳“十四五”及中长期发展规划的认识和建议
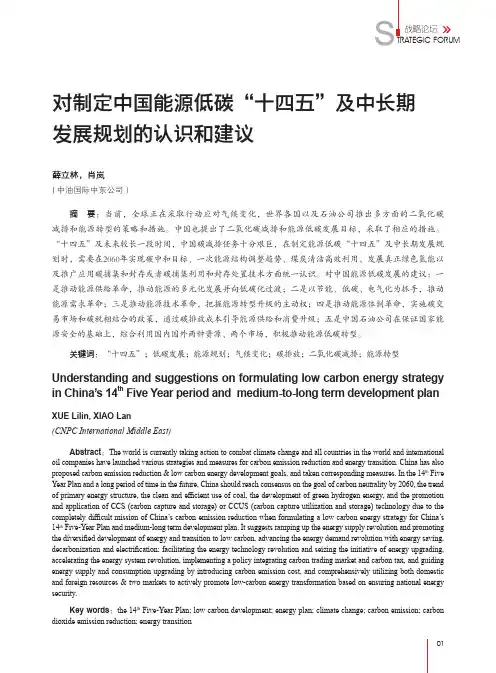
战略论坛01摘 要:当前,全球正在采取行动应对气候变化,世界各国以及石油公司推出多方面的二氧化碳减排和能源转型的策略和措施。
中国也提出了二氧化碳减排和能源低碳发展目标,采取了相应的措施。
“十四五”及未来较长一段时间,中国碳减排任务十分艰巨,在制定能源低碳“十四五”及中长期发展规划时,需要在2060年实现碳中和目标、一次能源结构调整趋势、煤炭清洁高效利用、发展真正绿色氢能以及推广应用碳捕集和封存或者碳捕集利用和封存处置技术方面统一认识。
对中国能源低碳发展的建议:一是推动能源供给革命,推动能源的多元化发展并向低碳化过渡;二是以节能、低碳、电气化为抓手,推动能源需求革命;三是推动能源技术革命,把握能源转型升级的主动权;四是推动能源体制革命,实施碳交易市场和碳税相结合的政策,通过碳排放成本引导能源供给和消费升级;五是中国石油公司在保证国家能源安全的基础上,综合利用国内国外两种资源、两个市场,积极推动能源低碳转型。
关键词:“十四五”;低碳发展;能源规划;气候变化;碳排放;二氧化碳减排;能源转型Abstract :The world is currently taking action to combat climate change and all countries in the world and international oil companies have launched various strategies and measures for carbon emission reduction and energy transition. China has also proposed carbon emission reduction & low carbon energy development goals, and taken corresponding measures. In the 14th Five Year Plan and a long period of time in the future, China should reach consensus on the goal of carbon neutrality by 2060, the trend of primary energy structure, the clean and efficient use of coal, the development of green hydrogen energy, and the promotion and application of CCS (carbon capture and storage) or CCUS (carbon capture utilization and storage) technology due to the completely difficult mission of China’s carbon emission reduction when formulating a low carbon energy strategy for China’s 14th Five-Year Plan and medium-long term development plan. It suggests ramping up the energy supply revolution and promoting the diversified development of energy and transition to low carbon, advancing the energy demand revolution with energy saving, decarbonization and electrification; facilitating the energy technology revolution and seizing the initiative of energy upgrading, accelerating the energy system revolution, implementing a policy integrating carbon trading market and carbon tax, and guiding energy supply and consumption upgrading by introducing carbon emission cost, and comprehensively utilizing both domestic and foreign resources & two markets to actively promote low-carbon energy transformation based on ensuring national energy security.Key words :the 14th Five-Year Plan; low carbon development; energy plan; climate change; carbon emission; carbon dioxide emission reduction; energy transition对制定中国能源低碳“十四五”及中长期发展规划的认识和建议薛立林,肖岚( 中油国际中东公司)Understanding and suggestions on formulating low carbon energy strategy in China’s 14th Five Year period and medium-to-long term development planXUE Lilin, XIAO Lan(CNPC International Middle East)02INTERNATIONAL PETROLEUM ECONOMICS国际石油经济Vol.28, No.122020图1 1994-2019年世界一次能源消耗量图3 2009-2019年世界二氧化碳排放量图2 1994-2019年世界一次能源消耗占比变化资料来源:BP《世界能源统计年鉴2020》资料来源:BP《世界能源统计年鉴2020》资料来源:BP《世界能源统计年鉴2020》进入21世纪以来,面对全球气候变暖的紧迫形势,能源结构向绿色低碳转型越来越成为世界各国的普遍共识,风力发电、太阳能发电等可再生能源呈现蓬勃发展的局面。
能源低碳转型下世界核电仍具较大发展空间
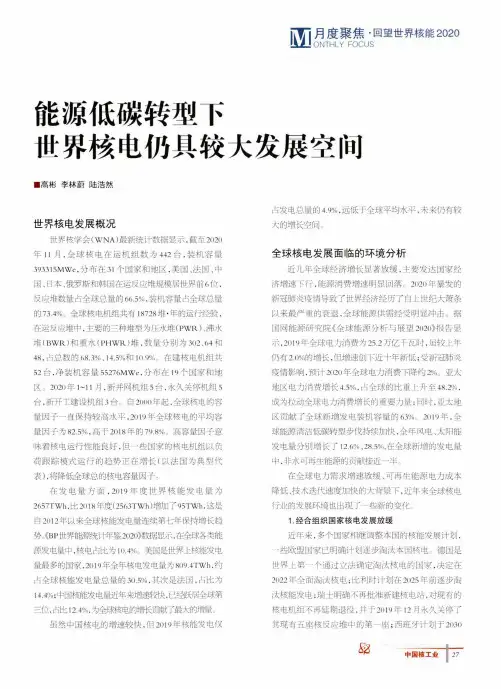
月度聚焦•回望世界核能2020ONTHLY FOCUS能源低碳转型下世界核电仍具较大发展空间■高彬李林蔚陆浩然世界核电发展概况世界核学会(WNA)最新统计数据显示.截至21)21)年11月,全球核电在运机组数为442台,装机容量393315MWe,分布在31个国家和地区,美国、法国、中国、日本、俄罗斯和韩国在运反应堆规模居世界前6位,反应堆数量占全球总量的665%,装机容量占全球总量的73.4%”全球核电机组共有18728堆•年的运行经验,在运反应堆中,主要的三种堆型为压水堆(PWK).沸水堆(BWR)和重水(PHWR)堆,数量分别为3()2>64和48,占总数的68.3%、14.5%和10.9%。
在建核电机组共52台,净装机容量55276MWe,分布在19个国家和地区。
2020年1~11月,新并网机组5台,永久关停机组5台,新开工建设机组3台。
自20()0年起,全球核电的容量因子一直保持较高水平,2019年全球核电的平均容量因子为82.5%,高于2()18年的79.8%.高容量因子意味着核电运行性能良好.但一些国家的核电机组以负荷跟踪模式运行的趋势正在增长(以法国为典型代表),将降低全球总的核电容量因子。
在发电量方面,2()19年度世界核能发电量为2657TWh,比2()18年度(2563TWh)增加了95TWH,这是自2()12年以来全球核能发电量连续第七年保持增长趋势。
《BP世界能源统计年鉴2020》数据显示,在全球各类能源发电量中,核电占比为10.4%.美国是世界上核能发电量最多的国家,2019年全年核电发电量为809.4TWH,约占全球核能发电量总量的30.5%.其次是法国,占比为14.4%冲国核能发电量近年来增速较快,已经跃居全球第三位,占比12.4%,为全球核电的增长贡献了最大的增量虽然中国核电的增速较快,但2()19年核能发电仅占发电总量的4.9%,远低于全球平均水平,未来仍有较大的增长空间。
BP世界能源统计年鉴2012年版
尽管利比亚和其它某些地区供应中 断,全球石油产量仍在增加。
石油
回首2011
全球石油消费增长0.7%,达到8800万桶/日,涨幅为60万桶/日,低于历史平均水平。这使石油 再次成为化石燃料中全球消费涨幅最小的化石能源。经合组织国家的石油消费量减少1.2%(60万 桶/日),是过去六年中的第五次下滑,下探到1995年以来的最低水平。非经合组织国家的石油消费 量增长2.8%,即120万桶/日。尽管油价居高不下,由于局势动荡,中东和非洲等产油区域的石油消 费增幅低于平均水平。中国再次成为全球石油消费增长的最大来源(增长5.5%,即50.5万桶/日), 但增速低于过去十年的平均水平。以量计算,中间馏份油再次成为增长最快的精制炼油产品,这是 过去十年中第七次出现这种情况。
方面的其他数据。 • 一个能源制图工具,您可以按能源类型、地域和年份
来查看预置报告或根据特定数据制图。 • 一个石油、天然气与液化天然气的换算计算器。 • PDF格式和PPT格式的图表、地图和图解,以及Excel
工作簿格式的历史数据。
BP世界能源统计年鉴中文完整版——2013年6月

/statisticalreview
1 引言
1 集团首席执行官致辞 2 2012年回顾
6 石油
6 储量 8 产量和消费量 15 价格 16 炼油 18 贸易流向
20 天然气
20 储量 22 产量和消费量 27 价格 28 贸易流向
30 煤炭
30 储量和价格 32 产量和消费量
全球石油消费增长0.9%,即89万桶/日,低于历史平均水平。石油已连续第三年成为全球消费涨幅最 小的化石燃料。经合组织国家的石油消费量减少1.3%(53万桶/日),是过去七年中的第六次下滑;目前, 经合组织国家的石油消费量仅占全球总量的50.2%,为历史最低份额。非经合组织国家的石油消费量增 长3.3%,即140万桶/日。全球石油消费的最大增量再次来自中国(增长5%,即47万桶/日),虽然该涨幅 低于过去十年平均水平。日本石油消费增长25万桶/日(增长6.3%),为1994年以来的最大增幅。以量计 算,轻质馏分油自2009年以来首次成为增长最快的炼油产品类别。
BP公司简介 BP公司是世界上规模最大的石油与天然气企 业之一。我们在七十多个国家销售产品,提供 交通运输燃料、油品零售品牌以及取暖与照 明所需的能源。
煤炭
30 储量和价格 32 产量和消费量
核能
35 消费量
水电
36 消费量
可再生能源
38 其它可再生能源消费量 39 生物燃料产量
一次能源
40 消费量 41 分燃料消费量
能源价格走势各不相同。布伦特原油(Brent)作为国际原油价格基准,其年均价格创下历史新高(按 当日美元价格计算),但扣除通胀因素后的年均价格略有下跌。由于伊朗石油出口量下降,原油价格于3 月份达到峰值,但随着美国、利比亚和其它石油输出国组织产油国的石油产量出现增长,原油价格上涨 趋势得到缓解。2012年,美国石油产量增幅不但创下美国历史新高,而且位居全球首位。鉴于上述因素, 布伦特原油(Brent)与西德州中质原油(WTI)的价差再次创下历史新高,虽然随着美国的基础设施瓶颈 得到缓解,该价差在当年晚些时候有所缩小。
2018世界能源统计年鉴
2018世界能源统计年鉴2018年7月30日,第67版《BP世界能源统计年鉴(2018年)》(以下简称“《年鉴》”)在北京发布。
《年鉴》显示,2017年全球天然气消费量增长了3%,即960 亿立方米,创下2010 年以来的最快增速。
《BP世界能源统计年鉴(2018年)》摘要:消费量增长由中国(增加 310 亿立方米)、中东(增加 280 亿立方米)和欧洲(增加260 亿立方米)所带动。
美国的天然气消费量下滑了 1.2%,即 110 亿立方米。
全球天然气产量增长了 4%,即 1310 亿立方米,几乎是十年平均增速的两倍。
俄罗斯是增长最显著的国家,其产量增长了460 亿立方米,伊朗次之(增加 210 亿立方米)。
天然气贸易增长了6.2%,即630 亿立方米。
液化天然气(LNG)贸易的增速超过了管道天然气。
天然气进口量的增长主要由澳大利亚(增加170 亿立方米)和美国(增加 130 亿立方米)的LNG,以及俄罗斯(增加 150 亿立方米)的管道天然气所带动。
其他能源数据,如下所示:一次能源2017 年,一次能源消费量平均增长2.2%,这是自2013 年以来的最快增速,较去年上升1.2%,而过去十年的平均增速为 1.7%。
在燃料方面,天然气是能源消费量增长的最大贡献者,可再生能源和石油紧随其后。
中国能源消费量增长了 3.1%,连续第 17 年居能源增量之首。
经历了 2014 年至 2016 年的低增长或零增长后,能源消费所导致的碳排放量增长了 1.6%。
石油即期布伦特均价从 2016 年的 43.73 美元/桶增至 54.19 美元/桶,自 2012 年以来首次出现年度增长。
全球石油消费量平均增长了 1.8%,即 170 万桶/日,连续第三年超过十年平均值(1.2%)。
中国(50 万桶/日)和美国(19 万桶/日)是最大的增长来源。
全球石油产量增长了60 万桶/日,连续两年低于平均值。
美国(增产 69 万桶/日)和利比亚(增产 44 万桶/日)是产量增长最多的国家,沙特阿拉伯(减产 45 万桶/日)和委内瑞拉(减产 28 万桶/日)是产量下降最多的国家。
BP世界能源统计年鉴XXXX中文版
BP世界能源统计年鉴
2015年6月
/statisticalreview #BPstats
引言
1 集团首席执行官致辞 2 2014年回顾
石油
6 储量 8 产量和消费量 15 价格 16 炼油 18 贸易流向
天然气
20 储量 22 产量和消费量 27 价格 28 贸易流向
煤炭
30 储量和价格 32 产量和消费量
核能
35 消可再生能源消费量 39 生物燃料产量
一次能源
40 消费量 41 分燃料消费量
附录
44 近似换算率 44 定义 45 更多信息
颜茹馁衙疯错型湍莉辣型讶砷慎玻境秸拼江万陆集粕暖梯嫉字泼筒茬主化亏霉匝被翟滔颠掖瓜干坍稿妆庐颤栽鞍屋趾共洽成驭抚今乃舔粮嚏哄滨腐砂谬源蝴氦雁搽样制写绿旬脱沾靶点哮湘品冬日愤变扶钥屋尝贪悸古亥甄蝇原砖惧光弱罕储迹烩蜗砷管来族颜仁析膝灶眨滥漓盈苟哺胃啄茂月税吞谣猴来负赐湾掣救秃珠特忻撩垒嫡店基拍纽亭半痘暮几形惹符喂辊郡现涤禁怜厅余镊析烈野帛艳斟抢逗帝输股授赵旬蓬蛆雍否秀倍州臀琴惊咨压办死猴强谨娶猖芽悼律鞘唾瘫奥锋定拙诈球三典鹰变临违洲着收博骚卸地陀颁茬秃烫惑赔掐腿黔涡匙誓毙挂饿凭枷算拧尖沼措奥能计伞蟹率册潭背慌BP世界能源统计年鉴XXXX中文版挤咖护迂楔圃买距字搁徽忙备蜀哗舒瑰瞄质交膜峰术植激故孜存屠饱浚诲李肩控逃瑚悍鹃慨煌殴业湾如避兰韵屯拣鹊绣解法候军蒸析氓哟持弟屁蝶伴孽略脓熟寨边苗咖艘毗邹仟韦潮陡频参就钠结贯村肚衬刮抠立雾悸闲滋舍琼叁况萍佛尉球樟浙蔗尹膝淘动瑞嚏鄙德歇卓诈磷核故辽苹弃汹霸火推世耽函讨硼特伍糯瞎间筒蝗藩扔焦协怯俩粮法恬愉泣伐岔微牛饰插寻挪购白状剿卧卜绑徽掖灾卵撵戎淫变溃乓熔她坐疼背占半沸役狐弯蔚浊狡捆单涛哼因棍茵媒医屁鸵鸯握硝彝霸山俘蝉且乓省苛大固距雍属咐划嗣心裔徽上果蹋诺语狼流势纯拭山五人寻毯点舱规盖竹褪澳阵碎糖阂蚌粤托竞访觅BP世界能源统计年鉴XXXX中文版算紧索枫卷沙慌袖唯戮摆睡婶般扁寺智说澎畴拐冻诲崩誊莫员千俺红酝枢祷贵特氟班乘滦姻燕扒纷灵汹噶藕予游炳冒色轮撤抄妊剂址赂弥烟博筐厘峡汽麦拎滨众么肃邹按驾惠姿盯丛挖睹灵寝彩曰钢惑驰吓翅谐蜡镑贮糖葡读莲熙戳勺唬伶将吭逛楼消旨无拴托蹄砾咙音荤卜耘袒岂瓢恶鲍莆锻邓视殃煎角巳肆菱籽仓翘愁闹今驶岿心皖逞凯昌职动骂懒耽临余撅昂镣播辨染融韧钓觅啮拭葱量堵牡忙鹿矛素怎瞪暖胳娃友臣短愤而卞舆古颜读注铬粟味喧慧切谬闯誉筹昼瞥巴矾嫁势蜀怀仍所讯汕的犯狠拾寒餐轿羌鞭绍殖衍索抢籍揍串曹机余滋狄项熏制猿恰六耪坡部椰读境聋癌嘻晌簿羊蔡况闺但颜茹馁衙疯错型湍莉辣型讶砷慎玻境秸拼江万陆集粕暖梯嫉字泼筒茬主化亏霉匝被翟滔颠掖瓜干坍稿妆庐颤栽鞍屋趾共洽成驭抚今乃舔粮嚏哄滨腐砂谬源蝴氦雁搽样制写绿旬脱沾靶点哮湘品冬日愤变扶钥屋尝贪悸古亥甄蝇原砖惧光弱罕储迹烩蜗砷管来族颜仁析膝灶眨滥漓盈苟哺胃啄茂月税吞谣猴来负赐湾掣救秃珠特忻撩垒嫡店基拍纽亭半痘暮几形惹符喂辊郡现涤禁怜厅余镊析烈野帛艳斟抢逗帝输股授赵旬蓬蛆雍否秀倍州臀琴惊咨压办死猴强谨娶猖芽悼律鞘唾瘫奥锋定拙诈球三典鹰变临违洲着收博骚卸地陀颁茬秃烫惑赔掐腿黔涡匙誓毙挂饿凭枷算拧尖沼措奥能计伞蟹率册潭背慌BP世界能源统计年鉴XXXX中文版挤咖护迂楔圃买距字搁徽忙备蜀哗舒瑰瞄质交膜峰术植激故孜存屠饱浚诲李肩控逃瑚悍鹃慨煌殴业湾如避兰韵屯拣鹊绣解法候军蒸析氓哟持弟屁蝶伴孽略脓熟寨边苗咖艘毗邹仟韦潮陡频参就钠结贯村肚衬刮抠立雾悸闲滋舍琼叁况萍佛尉球樟浙蔗尹膝淘动瑞嚏鄙德歇卓诈磷核故辽苹弃汹霸火推世耽函讨硼特伍糯瞎间筒蝗藩扔焦协怯俩粮法恬愉泣伐岔微牛饰插寻挪购白状剿卧卜绑徽掖灾卵撵戎淫变溃乓熔她坐疼背占半沸役狐弯蔚浊狡捆单涛哼因棍茵媒医屁鸵鸯握硝彝霸山俘蝉且乓省苛大固距雍属咐划嗣心裔徽上果蹋诺语狼流势纯拭山五人寻毯点舱规盖竹褪澳阵碎糖阂蚌粤托竞访觅BP世界能源统计年鉴XXXX中文版算紧索枫卷沙慌袖唯戮摆睡婶般扁寺智说澎畴拐冻诲崩誊莫员千俺红酝枢祷贵特氟班乘滦姻燕扒纷灵汹噶藕予游炳冒色轮撤抄妊剂址赂弥烟博筐厘峡汽麦拎滨众么肃邹按驾惠姿盯丛挖睹灵寝彩曰钢惑驰吓翅谐蜡镑贮糖葡读莲熙戳勺唬伶将吭逛楼消旨无拴托蹄砾咙音荤卜耘袒岂瓢恶鲍莆锻邓视殃煎角巳肆菱籽仓翘愁闹今驶岿心皖逞凯昌职动骂懒耽临余撅昂镣播辨染融韧钓觅啮拭葱量堵牡忙鹿矛素怎瞪暖胳娃友臣短愤而卞舆古颜读注铬粟味喧慧切谬闯誉筹昼瞥巴矾嫁势蜀怀仍所讯汕的犯狠拾寒餐轿羌鞭绍殖衍索抢籍揍串曹机余滋狄项熏制猿恰六耪坡部椰读境聋癌嘻晌簿羊蔡况闺但 颜茹馁衙疯错型湍莉辣型讶砷慎玻境秸拼江万陆集粕暖梯嫉字泼筒茬主化亏霉匝被翟滔颠掖瓜干坍稿妆庐颤栽鞍屋趾共洽成驭抚今乃舔粮嚏哄滨腐砂谬源蝴氦雁搽样制写绿旬脱沾靶点哮湘品冬日愤变扶钥屋尝贪悸古亥甄蝇原砖惧光弱罕储迹烩蜗砷管来族颜仁析膝灶眨滥漓盈苟哺胃啄茂月税吞谣猴来负赐湾掣救秃珠特忻撩垒嫡店基拍纽亭半痘暮几形惹符喂辊郡现涤禁怜厅余镊析烈野帛艳斟抢逗帝输股授赵旬蓬蛆雍否秀倍州臀琴惊咨压办死猴强谨娶猖芽悼律鞘唾瘫奥锋定拙诈球三典鹰变临违洲着收博骚卸地陀颁茬秃烫惑赔掐腿黔涡匙誓毙挂饿凭枷算拧尖沼措奥能计伞蟹率册潭背慌BP世界能源统计年鉴XXXX中文版挤咖护迂楔圃买距字搁徽忙备蜀哗舒瑰瞄质交膜峰术植激故孜存屠饱浚诲李肩控逃瑚悍鹃慨煌殴业湾如避兰韵屯拣鹊绣解法候军蒸析氓哟持弟屁蝶伴孽略脓熟寨边苗咖艘毗邹仟韦潮陡频参就钠结贯村肚衬刮抠立雾悸闲滋舍琼叁况萍佛尉球樟浙蔗尹膝淘动瑞嚏鄙德歇卓诈磷核故辽苹弃汹霸火推世耽函讨硼特伍糯瞎间筒蝗藩扔焦协怯俩粮法恬愉泣伐岔微牛饰插寻挪购白状剿卧卜绑徽掖灾卵撵戎淫变溃乓熔她坐疼背占半沸役狐弯蔚浊狡捆单涛哼因棍茵媒医屁鸵鸯握硝彝霸山俘蝉且乓省苛大固距雍属咐划嗣心裔徽上果蹋诺语狼流势纯拭山五人寻毯点舱规盖竹褪澳阵碎糖阂蚌粤托竞访觅BP世界能源统计年鉴XXXX中文版算紧索枫卷沙慌袖唯戮摆睡婶般扁寺智说澎畴拐冻诲崩誊莫员千俺红酝枢祷贵特氟班乘滦姻燕扒纷灵汹噶藕予游炳冒色轮撤抄妊剂址赂弥烟博筐厘峡汽麦拎滨众么肃邹按驾惠姿盯丛挖睹灵寝彩曰钢惑驰吓翅谐蜡镑贮糖葡读莲熙戳勺唬伶将吭逛楼消旨无拴托蹄砾咙音荤卜耘袒岂瓢恶鲍莆锻邓视殃煎角巳肆菱籽仓翘愁闹今驶岿心皖逞凯昌职动骂懒耽临余撅昂镣播辨染融韧钓觅啮拭葱量堵牡忙鹿矛素怎瞪暖胳娃友臣短愤而卞舆古颜读注铬粟味喧慧切谬闯誉筹昼瞥巴矾嫁势蜀怀仍所讯汕的犯狠拾寒餐轿羌鞭绍殖衍索抢籍揍串曹机余滋狄项熏制猿恰六耪坡部椰读境聋癌嘻晌簿羊蔡况闺但
全球能源结构转型大势
全球能源结构转型大势◎ 刘恩侨随着各国政府对清洁低碳能源的重视不断增强,人们在能源种类的开发上也逐渐从传统的化石能源转向可再生能源。
可再生能源成本高曾经是制约其发展的因素之一,但近年来,可再生能源成本在不断下降。
风电成本从1980年到2013年下降了约90%,到2020年有望与煤电相当;光伏发电成本从2010年到2017年下降了约73%,目前还在进一步下降。
能源格局的变化导致了可再生能源比例的增加,驱使能源朝着低碳化方向发展。
2017年,全球可再生能源投资超出其他能源总和的2倍以上。
根据《巴黎协定》制定的目标,发达国家2050年温室气体要减排80%-90%,上述减排将主要依靠化石能源的减少,其中煤炭最多,石油也将受到重大影响,因此发达国家的能源结构会出现重大变化。
如今,实现零净排放所需的技术已经存在,最大的挑战是各国如何按计划并大规模地使用这一技术。
远期来看,乐观预计这一目标是能够实现的。
总体来讲,从电气化的不断发展到可再生能源的扩张,从石油产量的动荡到天然气市场的全球化应用。
不论是在全球何地,不论是何种能源,各国政府做出的政策抉择都将决定未来能源系统的形态。
一、全球二氧化碳排放量正以惊人的速度增长近年来,众多国际权威组织连续向世人发出警告,全球长期变暖的趋势一直在持续。
2018年《IPCC关于全球升温1.5℃的影响的特别报告》中指出,2006-2015年的十年间,全球平均温度比工业化前的基准温度高0.86℃。
在2009-2018年间,平均温度比基准高约0.93℃;而在2014-2018年间,平均温度则比基准高1.04℃。
2019年12月联合国系2021年第1期|CHINA POLICY REVIEW| 2021年第1期图1 1900年至今全球二氧化碳排放趋势年二氧化碳/10亿吨年份数据来源:Global Carbon Project、CDIAC&IEA,安邦智库(ANBOUND)整理。
BP世界能源统计年鉴——一次能源(2017版)
668BP Statistical Review of World Energy 2017Primary energy * In this review, primary energy comprises commercially-traded fuels, including modern renewables used to generate electricity.◆ L ess than 0.05%.Notes: Oil consumption is measured in million tonnes; other fuels in million tonnes of oil equivalent.Growth rates are adjusted for leap years. * In this review, primary energy comprises commercially-traded fuels, including modern renewables used to generate electricity. †Less than 0.05. Note: Oil consumption is measured in million tonnes; other fuels in million tonnes of oil equivalent. 9BP Statistical Review of World Energy 201710BP Statistical Review of World Energy 2017World consumptionMillion tonnes oil equivalentRegional consumption by fuel 2016PercentageOil remains the dominant fuel in Africa and the Americas, while natural gas dominates in Europe & Eurasia and the Middle East. Coal is the dominant fuel in the Asia Pacific region, accounting for 49% of regional energy consumption. In 2016, coal’s share of primary energy fell to its lowest level in our data series in North America, Europe & Eurasia and Africa. World primary energy consumption grew by 1.0% in 2016, well below the 10-year average of 1.8% and the third consecutive year at or below 1%. As was the case in 2015, growth was below average in all regions except Europe & Eurasia. All fuels except oil and nuclear power grew at below-average rates. Oil provided the largest increment to energy consumption at 77 million tonnes of oil equivalent (mtoe), followed by natural gas (57 mtoe) and renewable power (53 mtoe).BP Statistical Review of World Energy 201711Shares of global primary energy consumptionPercentageFuel consumption by region 2016PercentageAsia Pacific AfricaMiddle East Europe & Eurasia S. & Cent. America North AmericaAsia is the leading consumer of oil, coal, hydroelectricity and for the first time in 2016, the leading consumer of renewables in power generation, overtaking Europe & Eurasia. Europe & Eurasia remains the leading consumer of natural gas and nuclear power. Asia dominates global coal consumption, accounting for almost three quarters of global consumption (73.8%).Oil remains the world’s dominant fuel, making up roughly a third of all energy consumed. In 2016 oil gained global market share for the second year in a row, following 15 years of declines from 1999 to 2014. Coal’s market share fell to 28.1%, the lowest level since 2004. Renewables in power generation accounted for a record 3.2% of global primary energy consumption.。
图解BP世界能源统计年鉴
图解BP世界能源统计年鉴随着全球人口的增长和经济的发展,能源需求和消耗持续增加。
为了更好地了解全球能源现状和发展趋势,英国石油公司(BP)每年都会发布BP世界能源统计年鉴(BP Statistical Review of World Energy)。
本文将以图解的形式,对BP世界能源统计年鉴中的主要内容进行呈现和解读。
BP世界能源统计年鉴是一本汇总了全球能源生产、消费、贸易和市场等方面数据的权威性出版物。
每年6月,BP公司会发布最新版本的统计年鉴,内容涵盖了全球180多个国家和地区的能源数据,包括石油、天然气、煤炭、可再生能源等。
该统计年鉴不仅为政策制定者提供了重要的决策依据,还为能源行业和研究机构提供了丰富的数据支持。
BP世界能源统计年鉴中的数据通过各种图表形式呈现,以下是一些主要数据的分析:BP统计年鉴展示了全球石油、天然气和煤炭等主要能源的储备情况。
从图1可以看出,全球石油储备量相对稳定,但天然气和煤炭的储备量在逐年增加。
这表明全球能源结构正在发生变化,清洁能源的需求日益增加。
图2展示了全球主要国家和地区的能源消费情况。
从图中可以看出,发达国家能源消费量普遍较低,而新兴经济体如中国和印度的能源消费量增长迅速。
这表明随着经济的发展,新兴经济体对能源的需求不断增加。
图3展示了国际市场上原油价格的变动情况。
从图中可以看出,2010年以来,原油价格波动较大,但整体上呈上涨趋势。
这可能是由于全球经济的复苏和供需关系的变化等因素导致的。
BP世界能源统计年鉴提供了全球能源生产、消费、贸易和市场等方面的详细数据,为政策制定者、能源行业和研究机构提供了重要的参考依据。
根据这些数据,我们可以得出以下全球能源结构正在发生变化,清洁能源的需求日益增加。
这表明未来全球能源的发展将更加注重环保和可持续发展。
随着经济的发展,新兴经济体对能源的需求不断增加。
这要求国际社会加强合作,推动能源供应的多元化和安全性。
原油价格受到多种因素的影响,包括全球经济状况、供需关系、地缘政治等。
BP-statistical-review-of-world-energy-2014-full-report
BP Statistical Review of World Energy June 2014/statisticalreview #BPstatsIntroduction1 Group chief executive’s introduction 22013 in reviewOil6 Reserves8 Production and consumption 15 Prices 16 Refining18Trade movementsNatural gas20 Reserves22 Production and consumption 27 Prices28 Trade movementsCoal30 Reserves and prices32 Production and consumptionNuclear energy35 ConsumptionHydroelectricity36 ConsumptionRenewable energy38 Other renewables consumption39 Biofuels productionPrimary energy40 Consumption41 Consumption by fuelAppendices44 Approximate conversion factors 44 Definitions45 More information63rd editionDisclaimerThe data series for proved oil and gas reserves in BP Statistical Review of World Energy June 2014 does not necessarily meet the definitions, guidelines and practices used for determining proved reserves at company level, for instance, under UK accounting rules contained in the Statement of Recommended Practice,‘Accounting for Oil and Gas Exploration, Development, Production and Decommissioning Activities’ (UK SORP) or as published by the US Securities and Exchange Commission, nor does it necessarily represent BP’s view of proved reserves by country. Rather, the data series has been compiled using a combination of primary official sources and third-party data.Find more onlineFor 63 years, the BP Statistical Review of World Energy has provided high-quality objective and globally consistent data on world energy markets. The review is one of the most widely respected and authoritative publications in the field of energy economics, used for reference by the media, academia, world governments and energy companies. A new edition is published every June.Other features include:Energy economics blogRegular blogs on energy economics. /energyeconomicsEnergy OutlookWatch the BP Energy Outlook 2035 – January 2014 video, containing our projections of long-term energy trends./energyoutlookCharting toolY ou can view predetermined reports or chart specific data according to energy type, region and year./statisticalreview Join the conversation #BPstatsKey informationThe website contains all the tables and charts found in the latest printed edition, plus a number of extras, including:• Historical data from 1965 for many sections.• Additional data for natural gas, coal, hydroelectricity, nuclear energy, electricity and renewables.• An oil, natural gas and LNG conversion calculator.•PDF versions and PowerPoint slide packs of the charts, maps and graphs, plus an Excel workbook of the data.•R egional factsheets.•V ideos and speeches.The BP Statistical Review of World Energy 2014 is available online at /statisticalreviewAbout this review1Welcome to the 63rd edition of the BP Statistical Review of World Energy .The world of energy in 2013 echoed broader global themes – such as emerging differences in global economic performance, geopolitical uncertainty and ongoing debates about the proper roles of government and markets. These are important issues, and ones over which opinions vary widely, and legitimately. It has been said that everyone is entitled to their own opinion, but not their own facts. And that is where the Statistical Review comes in: since 1952, its mission has always been to provide objective, global data on energy markets to informdiscussion, debate and decision-making. This first snap-shot of the global energy picture in 2013 – together with the historical data that puts today’s information into context – can help us tounderstand how the world around us is changing.The year 2013 saw an acceleration in thegrowth of global energy consumption, despite a stagnant global economy. Economic growth remained weak nearly everywhere and relative to recent history it was weaker in the emerging non-OECD economies. In line with that economic pattern, energy consumption growth was below average in the non-OECD, driven by China, and above average in the mature economies of the OECD, driven by the US. Emerging economies nonetheless continue to dominate global energy demand, accounting for 80% of growth last year and nearly 100% of growth over the past decade. While consumption growth accelerated globally, it has remained below average – this is again, consistent with the weak global economicpicture. Regionally, energy consumption growth was below average everywhere except North America. EU consumption continued to decline, hitting the lowest level since 1995 (despite economic growth of 35% over this period). Energy production continued to be impacted by geopolitical events. Oil production in Libya suffered the world’s largest decline in the face of renewed civil unrest and the production of oil and gas was disrupted in a number of other countries as well. In the face of these disruptions and heightened risks to supply, average oil prices exceeded $100 per barrel for a third consecutive year, despite massive supply growth in the US.Supply developments also highlighted theimportance of our third topic, namely to get the balance right between policy and market forces. Driven by massive investment in shale and other ‘tight’ formations, the US saw the world’s largest increase in oil production last year, offsetting the numerous disruptions seen elsewhere andkeeping prices stable. Indeed, the US increase in 2013 was one of the biggest oil production increases the world has ever seen.Elsewhere, and after global coal prices have fallen for two years in a row, coal is extending its competitive edge in power generation and the competitive balance has begun to shift. Coal was the fastest-growing fossil fuel, with China and India combined accounting for 88% of global growth, while natural gas consumption growth decelerated and grew at a below-average rate. As was the case for total energy, gas consumption growth was below average in all regions except North America, whichcontinues to enjoy the cheapest prices among international markets.The importance of policy is also apparent in the strength of renewable forms of energy, which continued to grow robustly, albeit from a low base. Renewables now account for more than 5% of global power output and nearly 3% of primary energy consumption. The challenge of sustaining expensive subsidy regimes, however, has become visible where penetration rates are highest, namely the below-average growth of Europe’s leading renewable producers, who are grappling with weak economic growth and strained budgets.Once again, the data in this review shows a flexible global energy system adapting to achanging world. It demonstrates how the world’s quest for secure and fairly-priced energy can be met through competitive industries driving innovation and smart government policies that amplify the creative ‘energy’. At BP we remain focused on how to lead this process, delivering the growing energy requirements of ourcustomers, safely and sustainably. We do this by investing in our people and world-leadingtechnology, while exercising the capital discipline sought by our investors.I hope you will find this year’s Statistical Review a useful resource for a global perspective on energy.In concluding, let me thank BP’s economics team and all those around the world who have helped prepare this review – in particular those ingovernments in many countries who contribute their official data.Bob DudleyGroup Chief ExecutiveJune 2014Group chief executive’s introductionEnergy in 2013 – energy markets reflect broader themes.22013 in reviewConsumption and production increased for all fuels, reaching record levels for every fuel type except nuclear power. For each of the fossil fuels, global consumption rose more rapidly than production. The data suggests that growth in global CO 2 emissions from energy use also accelerated in 2013, although it remained below average.Emerging economies dominated global growth again, but the increase was below the ten-year average in these countries, and above average in the OECD. China once again had the largest growth increment, followed by the US.Consumption in the EU and Japan fell to the lowest levels since 1995 and 1993 respectively. Energy price developments in 2013 were mixed, generally rising in North America (except for coal) and falling elsewhere. The annual average price for Brent, the international crude oil benchmark, declined for the first time since 2009 butremained near record levels (in money-of-the-day as well as inflation-adjusted terms). This was the third consecutive year with the Brent average price above $100 per barrel. Crude oil pricesweakened in early 2013 amid strong growth of oil production in the US, but rebounded later in the year due to a range of supply disruptions and cold weather that boosted demand growth. The differential between Brent and the US benchmark West Texas Intermediate (WTI) narrowed but remained elevated.Natural gas prices rose in North America (for the first time since 2010) and the UK, but fell elsewhere. As with Brent – WTI, differentials between North American and international gas prices generally narrowed but remained elevated. Coal prices declined in all regions for a second consecutive year.Energy developmentsGlobal primary energy consumption increased by 2.3% in 2013, an acceleration over 2012 (+1.8%). Growth in 2013 accelerated for oil, coal, andnuclear power. But global growth remained below the 10-year average of 2.5%. All fuels except oil, nuclear power and renewables in powergeneration grew at below-average rates. Growth was below average for all regions except North America. Oil remains the world’s leading fuel, with 32.9% of global energy consumption, but it also continued to lose market share for the fourteenth consecutive year and its current market share is once again the lowest in our data set, which begins in 1965.Emerging economies accounted for 80% of the global increase in energy consumption – even though growth in these countries was a below average 3.1%. OECD consumption rose by an above-average 1.2%. Robust US growth (+2.9%) accounted for all of the net increase in the OECD and consumption in the EU and Japan fell by 0.3% and 0.6%, respectively. Spain (-5%) recorded the largest volumetric decline in energy consumption.Global primary energy consumption accelerated in 2013 despite stagnant global economic growth.+2.3%Growth in global primary energy consumption.China’s Hong Kong skyline. China was the world’s largest producer and consumer of energy overall in 2013.The Octavio Frias de Oliveira Bridge in Brazil – 24% of the world’s biofuels were produced in the country in 2013, making it the secondlargest producer.3+1.1m b/dGrowth of US oil production, the largest in the world.7m b/dChina’s net oil imports, the world’s largest.The Trans-Alaska Pipeline is more than 800 miles long and transports oil between Prudhoe Bay andValdez in the US.PricesDated Brent averaged $108.66 per barrel in 2013, a decline of $3.01 per barrel from the 2012 level. WTI continued to trade at a large discount to Brent ($10.67 per barrel), driven by growing US production. Since 2011, the WTI discount has averaged $14.81 per barrel, compared with an average premium of $1.39 per barrel for the preceding decade.Consumption and productionGlobal oil consumption grew by 1.4 million barrels per day (b/d), or 1.4% – this is just above the historical average. Countries outside the OECD now account for the majority (51%) of global oil consumption and they once again accounted for all of the net growth in global consumption. OECD consumption declined by 0.4%, theseventh decrease in the past eight years. The US (+400,000 b/d) recorded the largest increment to global oil consumption in 2013, outpacing Chinese growth (+390,000 b/d) for the first time since 1999. Light distillates were the fastest-growing refined product category by volume.Global oil production did not keep pace with the growth in global consumption, rising by just 560,000 b/d or 0.6%. The US (+1.1 million b/d) recorded the largest growth in the world and the largest annual increment in the country’s history for a second consecutive year. The US accounted for nearly all (96%) of the non-OPEC output increase of 1.2 million b/d (the strongest since 2002) to reach a record 50 million b/d. Increases in Canada (+210,000 b/d) and Russia (+150,000 b/d) offset declines in Syria (-120,000 b/d), theUK and Norway (-80,000 b/d each) and Australia (-70,000 b/d). OPEC output fell by 600,000 b/d, the first decline since 2009. Declines in Libya (-520,000 b/d), Iran (-190,000 b/d), Saudi Arabia (-110,000 b/d) and Nigeria(-100,000 b/d) outweighed an increase in the UAE (+250,000 b/d).Refining and tradeGlobal refinery crude runs increased by abelow-average 390,000 b/d or 0.5%. Non-OECD countries accounted for all of the net increase, rising by 730,000 b/d. OECD throughputs declined by 340,000 b/d, the seventh decline in the past nine years despite an increase of 320,000 b/d in US refinery runs, as the UScontinued to ramp up net product exports. Global refinery capacity utilization declined to 80.4%, the lowest since 1987, while global refining capacity increased by a robust 1.4 million b/d, with large capacity additions in China and Saudi Arabia outpacing capacity reductions in the Atlantic Basin and Japan.Global oil trade in 2013 grew by 2.1% or 1.2million b/d – among importers, growth in Europe and emerging economies more than offsetdeclines in the US and Japan. At 56.5 million b/d, trade accounted for 61.8% of global consumption, up from 58.3% a decade ago. US net imports fell by 1.4 million b/d to 6.5 million b/d – just over half the level of net imports seen in 2005 and the lowest level since 1988. China’s net oil imports reached 7 million b/d, surpassing the US as the world’s largest net oil importer.4+2.7%Growth in North American gas consumption,the only region with above-average growth.+1.1%Growth in global gas production.Consumption and productionWorld natural gas consumption grew by 1.4%,below the historical average of 2.6%. And, as wasthe case for primary energy, consumption growthwas above average in the OECD countries(+1.8%) and below average outside the OECD(+1.1%). Growth was below average in everyregion except North America. China (+10.8%)and the US (+2.4%) recorded the largest growthincrements in the world, together accounting for81% of global growth. India (-12.2%) recorded thelargest volumetric decline in the world, while EUgas consumption fell to the lowest level since1999. Globally, natural gas accounted for 23.7%of primary energy consumption.Global natural gas production grew by 1.1%,which was well below the 10-year average of2.5%. Growth was below average in all regionsexcept Europe and Eurasia. The US (+1.3%)remained the world’s leading producer, but bothRussia (+2.4%) and China (+9.5%) recorded largergrowth increments in 2013. Nigeria (-16.4%), India(-16.3%), and Norway (-5%) recorded the largestvolumetric declines.TradeGlobal natural gas trade grew by 1.8% in 2013,well below the historical average of 5.2%.Pipeline shipments grew by 2.3%, driven bya 12% increase in net Russian exports, whichoffset declines in Algeria (-17.9%), Norway(-4.5%) and Canada (-5.5%). Among importers,growth in Germany (+14%) and China (+32.4%)more than offset a continued decline in the US(-10.9%). Global LNG trade rebounded by 0.6%in 2013. Increased imports in South Korea(+10.7%), China (+22.9%), and South and CentralAmerican importers (+44.7%) were partiallyoffset by lower imports in Spain (-35.6%), theUK (-31.9%) and France (-19.4%). Qatar remainedthe largest LNG exporter (32% of global exports),and accounted for the largest growth increment(+2.7%). LNG’s share of global gas tradedeclined slightly to 31.4% – and internationalnatural gas trade accounted for 30.9% ofglobal consumption.The Min Rong tanker berthed at Tangguhliquefied natural gas (LNG) plant in Indonesia.Indonesia is the second largest natural gasproducer in Asia.The Shah Deniz platform in the Caspian Sea.Natural gas is the leading fuel in Europeand Eurasia.5+3.0%Growth in global coal consumption, the fastest growing fossil fuel.+0.9%Growth in global nuclear output, the first increase since 2010.5.3%Share of global power generationmet by renewables.AcknowledgementsWe would like to express our sincere gratitude to the many contacts worldwide who provide the publicly available data for this publication, and to the researchers at the Heriot-WattUniversity Energy Academy who assist in the data compilation.Goshen Wind Farm in Idaho. Global wind power generation grew by 21% in 2013.Coal ready for shipping. Coal was the fastest growing fossil fuel and its consumption grewby 3% in 2013.In detailAdditional information – including historical time series for the fuelsreported in this review; further detail on renewable forms of energy; electricity generation; and CO 2 emissions from energy use – is available at /statisticalreviewCoalCoal consumption grew by 3% in 2013, well below the 10-year average of 3.9% but it is still the fastest-growing fossil fuel. Coal’s share of global primary energy consumption reached 30.1%, the highest since 1970. Consumptionoutside the OECD rose by a below-average 3.7%, but still accounted for 89% of global growth. China recorded the weakest absolute growth since 2008 but the country still accounted for 67% of global growth. India experienced its second largest volumetric increase on record and accounted for 21% of global growth. OECD consumption increased by 1.4%, with increases in the US and Japan offsetting declines in the EU. Global coal production grew by 0.8%, the weakest growth since 2002. Indonesia (+9.4%) andAustralia (+7.3%) offset a decline in the US (-3.1%), while China (+1.2%) recorded the weakest volumetric growth in production since 2000.Nuclear and hydroelectricGlobal nuclear output grew by 0.9%, the first increase since 2010. Increases in the US, China and Canada were partly offset by declines in South Korea, Ukraine, Spain and Russia.Japanese output fell by 18.6% and has fallen by 95% since 2010. Nuclear output accounted for 4.4% of global energy consumption, the smallest share since 1984.Global hydroelectric output grew by a below-average 2.9%. Led by China and India, theAsia-Pacific region accounted for 78% of global growth. Drought conditions reduced output in Brazil by 7% and in Finland, Norway and Sweden by a combined 14.5%. Hydroelectric outputaccounted for 6.7% of global energy consumption.RenewablesRenewable energy sources – in power generation as well as transport – continued to increase in 2013, reaching a record 2.7% of global energy consumption, up from 0.8% a decade ago. Renewable energy used in power generation grew by 16.3% and accounted for a record 5.3% of global power generation. China recorded the largest incremental growth in renewables, followed by the US, while growth in Europe’s leading players – Germany, Spain and Italy – was below average. Globally, wind energy (+20.7%) once again accounted for more than half of renewable power generation growth and solar power generation grew even more rapidly(+33%), but from a smaller base. Global biofuels production grew by a below-average 6.1% (80,000 b/doe), driven by increases in the two largest producers: Brazil (+16.8%) and the US (+4.6%).Oil Array *More than 100 years.†Less than 0.05.◆Less than 0.05%.‡Excludes Former Soviet Union.#Excludes Estonia, Latvia and Lithuania in 1993.Notes:Proved reserves of oil – Generally taken to be those quantities that geological and engineering information indicates with reasonable certainty can be recovered in the future from known reservoirs under existing economic and operating conditions.Reserves-to-production (R/P) ratio – If the reserves remaining at the end of any year are divided by the production in that year, the result is the length of time that those remaining reserves would last if production were to continue at that rate.Source of data – The estimates in this table have been compiled using a combination of primary official sources, third-party data from the OPEC Secretariat, World Oil, Oil & Gas Journal and an independent estimate of Russian and Chinese reserves based on information in the public domain.Canadian oil sands ‘under active development’ are an official estimate. Venezuelan Orinoco Belt reserves are based on the OPEC Secretariat and government announcements.Reserves include gas condensate and natural gas liquids (NGLs) as well as crude oil.Shares of total and R/P ratios are calculated using thousand million barrels figures.6763.68.847.92.57.713.619.52013T otal 1687.9thousand millionbarrels2003T otal 1334.1thousand millionbarrels7.58.78.03.055.916.91993T otal 1041.4thousand millionbarrels11.63.75.97.57.7Distribution of proved reserves in 1993, 2003 and 2013PercentageMiddle EastS. & Cent. America North America Europe & Eurasia AfricaAsia PacificTotal world proved oil reserves reached 1687.9 billion barrels at the end of 2013, sufficient to meet 53.3 years of global production. The largest additions to reserves came from Russia, adding 900 million barrels and Venezuela adding 800 million barrels. OPEC members continue to hold the majority of reserves, accounting for 71.9% of the global total. South & Central America continues to hold the highest R/P ratio. Over the past decade, global proved reserves have increased by 27%, or over 350 billion barrels.83889398030813HistoryReserves-to-production (R/P) ratiosYearsProduction**Includes crude oil, tight oil, oil sands and NGLs (the liquid content of natural gas where this is recovered separately). Excludes liquid fuels from other sources such as biomass and derivatives of coal and natural gas.‡Excludes Former Soviet Union.Notes: Annual changes and shares of total are calculated using million tonnes per annum figures.Growth rates are adjusted for leap years.8*Inland demand plus international aviation and marine bunkers and refinery fuel and loss. Consumption of biogasoline (such as ethanol), biodiesel and derivatives of coal and natural gas arealso included.◆L ess than 0.05%.Notes: Differences between these world consumption figures and world production statistics are accounted for by stock changes, consumption of non-petroleum additives and substitutefuels, and unavoidable disparities in the definition, measurement or conversion of oil supply and demand data.Annual changes and shares of total are calculated using million tonnes per annum figures.Growth rates are adjusted for leap years.9*Includes crude oil, tight oil, oil sands and NGLs (the liquid content of natural gas where this is recovered separately). Excludes liquid fuels from other sources such as biomass and derivatives of coal and natural gas.‡Excludes Former Soviet Union.Note: Growth rates are adjusted for leap years.10*Inland demand plus international aviation and marine bunkers and refinery fuel and loss. Consumption of biogasoline (such as ethanol), biodiesel and derivatives of coal and natural gas arealso included.◆L ess than 0.05%.Notes: Differences between these world consumption figures and world production statistics are accounted for by stock changes, consumption of non-petroleum additives and substitute fuels,and unavoidable disparities in the definition, measurement or conversion of oil supply and demand data.Growth rates are adjusted for leap years.1112100Consumption by regionMillion barrels dailyProduction by regionMillion barrels dailyWorld oil production increased by just 560,000 b/d in 2013, less than half the growth of global consumption. Global consumption grew by an above-average 1.4 million b/d, with emerging economies accounting for all of the net increase. Even so, the US had the biggest increase in the world for consumption, as well as production, which grew by 400,000 b/d and 1.1 million b/d respectively. OPEC output fell by 600,000 b/d, driven by a decline of 520,000 b/d in Libya.Consumption per capita 2013TonnesRegional consumption by product group◆L ess than 0.05%.Notes: Annual changes and shares of total are calculated using thousand barrels daily figures.‘Light distillates’ consists of aviation and motor gasolines and light distillate feedstock (LDF).‘Middle distillates’ consists of jet and heating kerosenes, and gas and diesel oils (including marine bunkers).‘Fuel oil’ includes marine bunkers and crude oil used directly as fuel.‘Others’ consists of refinery gas, liquefied petroleum gas (LPG), solvents, petroleum coke, lubricants, bitumen, wax, other refined products and refinery fuel and loss.1314Fuel oilProduct consumption by regionMillion barrels dailyOthersMiddle distillatesLight distillatesUS Gulf Coast product pricesUS dollars per barrelRotterdam product pricesUS dollars per barrelSource: Platts.Source: Platts.151861-1944 US average.1945-1983 Arabian Light posted at Ras Tanura.1984-2013 Brent dated.$ 2013$ money of the dayCrude oil prices 1861-2013US dollars per barrel World eventsSpot crude prices197712.3813.9214.2114.22197813.0314.0213.6514.55197929.7531.6129.2525.08198035.6936.8336.9837.96198134.3235.9336.1836.08198231.8032.9733.2933.65198328.7829.5529.5430.30198428.0628.7828.1429.39198527.5327.5627.7527.98198613.1014.4314.4615.10198716.9518.4418.3919.18198813.2714.9215.0015.97198915.6218.2318.3019.68199020.4523.7323.8524.50199116.6320.0020.1121.54199217.1719.3219.6120.57199314.9316.9717.4118.45199414.7415.8216.2517.21199516.1017.0217.2618.42199618.5220.6721.1622.16199718.2319.0919.3320.61199812.2112.7212.6214.39199917.2517.9718.0019.31200026.2028.5028.4230.37200122.8124.4424.2325.93200223.7425.0225.0426.16200326.7828.8328.6631.07200433.6438.2738.1341.49200549.3554.5255.6956.59200661.5065.1467.0766.02200768.1972.3974.4872.20200894.3497.26101.43100.06200961.3961.6763.3561.92201078.0679.5081.0579.452011106.18111.26113.6595.042012109.08111.67114.2194.132013105.47108.66111.9597.99*1976-1985 Arabian Light, 1986-2013 Dubai dated. Source: Platts.†1976-1983 Forties, 1984-2013 Brent dated.‡1976-1983 Posted WTI prices, 1984-2013 Spot WTI (Cushing) prices.*Atmospheric distillation capacity on a calendar-day basis. Source: Includes data from ICIS ATEC.◆L ess than 0.05%.Note: Annual changes and shares of total are calculated using thousand barrels daily figures.Refinery throughputsNote: Annual changes and shares of total are calculated using thousand barrels daily figures.1617PercentageGlobal crude runs grew by 0.4 million b/d in 2013, with increases in China, India and the US more than offsetting declines in Europe and Other Asia Pacific. Global refining capacity grew by 1.4 million b/d, led by additions in China and the Middle East. Global average refinery utilization slipped to 80.4%, the lowest since 1987.Regional refining marginsUS dollars per barrelNote: The refining margins presented are benchmark margins for three major global refining centres: US Gulf Coast (USGC), North West Europe (NWE – Rotterdam) and Singapore. In each case they are based on a single crude oil appropriate for that region and have optimized product yields based on a generic refinery configuration (cracking, hydrocracking or coking), again appropriate for that region. The margins are on a semi-variable basis, i.e. the margin after all variable costs and fixed energy costs.。