霍尼韦尔实时数据库PHD说明书pim3501
Honeywell Pro-Watch集成保安系统教程说明书

Focus more on business outcomes, worry less about security needs with Honeywell Pro-Watch software.PRO-WATCH INTEGRATED SECURITY SUITE combines the power of Pro-Watch Access Control, Pro-Watch Intelligent Command with Pro-Watch VMS to create information-driven insights that are delivered in a unified dashboard. System tools such as system health dashboards and bulk firmware and password updates lower operational costs and improve operator efficiency. A unified view of alarms in maps and allowing for customized salvo views enhances situational awareness. Automated operating procedure workflows reduce compliance costs and everyday operational costs. Pro-Watch Integrated Security suite also reduces total cost of ownership by leveraging existing infrastructureAdditionally, Pro-Watch Integrated Security Suite uses data from the customer's system to provide proactive diagnostics – allowing the user to accurately budget for maintenance costs. Regional regulations create everyday challenges for security teams. By automating compliance, Pro-Watch reduces the risks of potential fines that could be levied for non-compliance. Automated workstreams allow the security operator to focus on daily needs, instead of on compliance activities.Pro-Watch Integrated Security Suite's flexible architecture achieves 24x7 availability with the industry’s lowest installation and lifecycle costs. The user-friendly design blends functional richness and configurability with an intuitive design requiring minimal operational training. Embedded system tours guide new operators through the basics of system operation, enabling them to be effective within 10 minutes – eliminating the need for costly on-site training.Situational awareness is a core concept in security systems. Pro-Watch Integrated Security Suite uses artificial intelligence to make sense of the mountain of data from multiple systems as it looks for abnormal situations. When detected, the location of the incident is represented on a building map and an incident workflow is created while SOP is executed. All actions related to an incident are archived for later analysis and packaged for external review.Pro-Watch delivers comprehensive options for audit and reporting to address forensics, compliance and business intelligence data mining needs.PRO-WATCH ®5.5Integrated Security SuiteHoneywell Pro-Watch 5.5, part of the Pro-Watch Integrated Security Suite platform, provides robust, global integrated access control, video surveillance and intrusion detection in a single view to protect staff,property, optimize productivity and comply with strict industry regulations all while reducingoperational costs.• Web Based Client for Badging, Reporting, Alarm and Event Monitoring • Mobile Client for Badging, Badging Verification, and Door Control•Server support including Windows® Server 2012/2016/2019, Windows 10 (32-bit and 64-bit), SQL Server 2014/ 2016/2019• Single user interface for multiple security and business functions•Honeywell Software Development Kit(HSDK) and Pro-Watch can be integrated with other building systems such as secondary fire, lighting and heating, ventilation, and air conditioningPERFORMANCE FEATURES AT A GLANCE• Web Services API enables Integration to third-party systems and Active Directory • Certification Management•Event/action associations including sending emails, running a storedprocedure, or triggering a panel I/O point •Pro-Watch-level triggered events for panel-to-panel and panel-to-software actions or within a panel for local actions • Advanced Reports• Support for Microsoft Azure•Virtualization support for VMWare and Microsoft® Hyper-V• HID Origo™ Integration•Compliance Reports that offer data and statistical reporting; auto generated reports upon schedules• Easy system setup and maintenance with user definable hardware templates •Database partitioning and definable operator permissions• Mercury Series 3 Controller •Mercury M5 (CASI) and MS Bridge (Software House) Controller • Lite, Professional, Corporate and Enterprise editionsSMALL SYSTEMS:PRO-WATCH LITE ANDPRO-WATCH PROFESSIONAL EDITIONSPro-Watch Lite Edition (PWLT) and Pro- Watch Professional Edition (PWPE) are optimized for the needs of smaller security systems.These editions leverage Microsoft SQL Express 2019, so the server can be accommodated on either a workstation for a single PC or on a separate server. In either case, additional clients may be connected to the server up to supported limits. Refer to the specifications guide on page 5 for more details.Pro-Watch Lite Edition offers basic functionality for the small office and features Pro-Watch PW Series access controllers. Up to four total client licenses can be added as needed.Pro-Watch Professional Edition is ideal for sites requiring more than 32 readers or up to 6 client workstations.MEDIUM & LARGE SYSTEMS: PRO-WATCH PROFESSIONAL AND PRO-WATCH CORPORATE EDITIONSBoth Pro-Watch Professional Edition(PWPE) and Pro-Watch Corporate Edition (PWCE) are targeted for the needs of medium to large installations.Figure 1. Integrations available using Pro-WatchCameraPrinterBadging workstationLite,Professional and Corporate editions MAXPRO® Workstationand server with Pro-Watch ClientVideo wallDVRNVR Analogmatrix switchPro-Watch workstation and serverMAXPRO® NVR IP camerasVISTA® and Galaxy* Dimension intrusion integrationFacial recognition reader Smart card readerPW-7000PW-7000Prox card readerFingerprint readerWith the exception of Badging and Vista,integration to these systems is not available on Pro-Watch Lite Edition*Galaxy is not available in the USThe reporting application includes basic report templates and the capability to generate custom reports exported as XLS, CSV and PDF formats.Pro-Watch provides a solid and proven security management solution. It is successfully deployed in enterprises of many sizes and across various vertical platform for intelligent campuses, government facilities and critical infrastructure.Additional licensed features include:• Alarm roll-up on maps • GIS maps implementation• System health dashboards for accessdevices• Exporting incidents as PDF• Bulk firmware and password updatesfor non-Honeywell camerasCorporate edition Corporate editionCorporate editionCorporate edition Pro-WatchEnterpriseeditionENTERPRISE SYSTEMS:PRO-WATCH ENTERPRISE EDITIONPro-Watch Enterprise Edition (PWEE) provides a security solution for the global organization by sharing badge holder identities and event data across the organization.With a PWEE system, an enterprise server facilitates two-way data sharing among regional servers. This enables single credential solutions across organizations. If equipped with two or more Pro-Watch Corporate Editions (PWCE), an organization may easily upgrade its servers to become part of an Enterprise system. Each corporate edition server becomes a regional server and retains regional system control.Table 1. Pro-Watch 5.5 specifications1 Must have a standard client license on a machine in order to run an Advanced Badging client license. 2Must order one regional server in an Enterprise system for each PWCE server in the system.Enterprise systems link together two or more Corporate edition systems to share badgeholder identities and events among the Corporate edition systems.PROFESSIONAL, CORPORATE AND ENTERPRISE EDITIONS• Standard badging and advancedbadging client • 2D PDF417 barcode add-on licensefor badging • Option for Transportation SecurityClearinghouse (TSC) background checks in Pro-Watch AP (Airport) and Vendor Management Portal • Integration to Honeywell VISTA®panels 128 /250 FBP, FBPT, BPE, and BPT, and GX in North America and to Honeywell Galaxy® Dimension GD-48, GD-96, GD-264, GD-520 in Europe • Event procedures triggers onconsecutive duplicate events • Mustering, anti-passback and guardtour • Minimum and maximum occupancyenforcement • Integrates video devices added inMAXPRO VMS • Supports Commend® intercomsystem servers GE200, GE300, GE700 and GE800• Detailed historic records for trackingconfiguration changes, security operations and device events to comply with audit • Intercoms linked to readers andlocations on maps provide quick access to specific units • Options for integrating biometrics,third-party hardware, radar-video solutions and IT convergence • High availability and redundantserver solutions (Corporate and Enterprise Edition)• Support for wireless locksets fromAllegion, Assa Abloy and Salto • Support for disconnected locksetsfrom Salto • Direct support for biometric readersfrom Morpho™ and Iris ID™• FICAM PACS Infrastructure APLlistedTable 2. Pro-Watch 5.5 SpecificationsIncludes RAM required by the customer's computer to run the Windows operating system.12RAID technology used for the larger system server – disk sets 1 and 2. When several physical disks are set up to use RAID technology, the operating system will be installed on a single disk(OS installed on RAID1 mirrored set) and the database and storage on a separate disk (RAID 5 or 10 disk set)3To estimate database storage space, use the following approximations and add to the base database size of 500MB:• Badgeholder storage = (number of badgeholders) x (75 KB)* estimate based on typical captured picture size• Event history storage = (number of events per day) x (2.5 KB) x (number of days to retain in server)• Audit history storage = [(number of cardholder changes per day) + (number of system configuration changes per day)+(number of events per day)+(number of operator system changes per day)]* (1.2 KB) x (number of days to retain in server)4Honeywell highly recommends some type of removable media for daily database backups. Database backups should be removed from the server and stored in a safe, secure location so in the event of system failure, this valuable data can be recovered. Honeywell recommends two or more removable media per server based upon end-user processes. Alternatively, Honeywell system installers can engage the end-users' IT group to participate in some type of network backup program.• Important Notice – These server and workstation hardware guidelines are intended for use as a reference only. The specifications are subject to changes due to market conditions, software updates, manufacturing changes and other variables outside of our control. Honeywell recommends for planning based on system growth and expansion, operating system updates and upgrades, database engine updates and upgrades, end-user system expansion, historical data retention requirements and archive data storage requirements. Please consult with Honeywell as applicable for assistance.Table 3. Pro-Watch 5.5 Part Number and DescriptionsMicrosoft®, Windows™, Azure®, Hyper-V®, Windows Server®, SQL Server® are trademarks or registered trademarks of Microsoft, Inc. in the United States and other countries.VMware® is a registered trademark of VMware, Inc. in the United States and other countries.HID® and Mercury™ are trademarks or registered trademarks of HID Global Corporation in the United States and other countries.Intel®, Xeon® , and Core™ are trademarks or registered trademarks of Intel Corporation or its subsidiaries in the United States or other countries.AutoCAD is a trademark or registered trademark of Autodesk, Inc., in the United States and other countries.Stentofon is a trademark or registered trademark of Zenitel Norway ASA in the United States and other countries.HID Origo™ is a trademark or registered trademark of HID Global Corporation/ASSA ABLOY AB.COMMEND is a trademark or registered trademark of Commend International GmbH in the United States and other countries.MORPHO™ is a trademark or registered trademark of Idemia Identity & Security France in the United States and other countries.IRIS ID™ is a trademark or registered trademark of Datastrip, Inc. in the United States and other countries.Neverfail® is a trademark or registered trademark of Hierholzer Holdings Inc. in the United States and other countries.Pro-Watch®, VISTA®, Galaxy®, LobbyWorks® and MAXPRO® are trademarks or registered trademark of Honeywell International Inc. in the United States and other countries.Honeywell reserves the right, without notification, to make changes in product design or specifications.HIS-PRW55-02-US-EN(1121)DS-IL © 2021 Honeywell International Inc.For More Information/security Honeywell Commercial Security 715 Peachtree St NE Atlanta, GA 303081.800.323.4576。
Aeroflex DT350H Honeywell ASCB Analyzer 产品说明书

FEATURES • ASCB-A, B, and C in one unit • Two receive and one transmit port • Easy menu-driven setup allows intuitive control of unit • Reprogrammable scaling database • Powerful RECORD and BREAKPOINT modes • Four hours of operation from internal battery or operation
PHYSICAL CHARACTERISTICS
Weight 3.8 lbs (1.7 kg)
Height 6.5" (16.5 cm)
Width 9.75" (24.7 cm)
Depth 2.0" (5.0 cm)
Display Super-twist, back-lit LCD; 16-line x 40 characters, 240 x 128 dot graphics
Receive words may be displayed in their predefined scale format from the database or in HEX, Binary, bcd, or a user defined format.
The DT350H has a very powerful breakpoint feature. Receive data can be captured based on up to two breakpoint words which can be programmed to occur independently or in a specific sequence.
A D Medlcal 医用PLUSCONNECT无线体重秤UC-350BLE使用手册说明书
UC-350BLE weight scale
E-5
Pair-Up
• Turn on Bluetooth® and the app. Make sure both are ON when pair-up is proceeding.
• Press and hold “UNIT” button in the back of the scale to start pair-up.
marked inside the compartment.
* The digits “
” will be shown on the LCD.
• Close the battery door and wait until the digits “ ” are shown on the LCD.
CAUTION
If SUCCEED, symbol will be shown on the scale LCD.
If FAIL, symbol “E1” will be shown on the LCD. (Please refer to Troubleshooting for more details.)
Honeywell Black 解码器使用说明书

高清解码器用户手册2安全使用注意事项此内容的目的是确保用户正确使用本产品,以避免危险或财产损失。
在使用此产品之前,请认真阅读此说明手册并妥善保存以备日后参考。
如下所示,预防措施分为“警告”和“注意”两部分: 警告:无视警告事项,可能会导致死亡或严重伤害。
注意:无视注意事项,可能会导致伤害或财产损失。
警告1.在本产品安装使用中,必须严格遵守国家和使用地区的各项电气安全规程。
2.请使用正规厂家提供的电源适配器。
3.请不要将多个编码器连接至同一电源(超过适配器负载量,可能会产生过多热量或导致火灾)。
4.在接线、拆装等操作时请一定要将编码器电源断开,切勿带电操作。
5.如录编码器中出现冒烟现象,或产生恶臭,或发出杂音,请立即关掉电源并且将电源线拔掉,并同经销商或服务中心联系。
6.如果编码器工作不正常,请联系购买设备的商店或最近的服务中心,不要以任何方式拆卸或修改设备。
(对未经认可的修改或维修所导致的问题,本公司不承担责任)。
注意1.请不要使物体摔落到设备上或大力震动编码器,并使设备远离存在磁场干扰的地点。
避免将设备安装到表面震动或容易受到冲击的地方(忽视此项可能会损坏设备)。
2.不能暴露安装于可能淋到雨或非常潮湿的地方。
3.避免将设备放在阳光直射地点、或通风不良的地点,或如加热器或暖气等热源附近(忽视此项可能会导致火灾危险)。
4.为了避免编码器损坏,切勿把编码器设置在有油烟或水蒸气、温度过高或有很多灰尘的场所5.清洁时,用软布擦拭掉机壳上的污垢。
清理污垢时,应以干布清理,污垢不易清除时,可用中性清洗剂轻拭干净,切勿使用碱性清洁剂洗涤。
声明:非常感谢您购买我公司的产品,如果您有什么疑问或需要请随时联系我们。
本手册为编码器产品安装使用手册,支持功能由于型号不同而有所区别,请以实物和随机快速使用说明为准。
本手册旨在供您作为操作和编程系统时的参考工具。
您可以在本手册中找到有关功能和命令的信息,以及详细的菜单树和快速操作指南。
Honeywell HumidIcon数字湿度温度传感器操作指南说明书

Technical NoteSPI Communication with the Honeywell HumidIcon™ Digital Humidity/Temperature SensorsSensing and Control1.0 IntroductionThe Serial Peripheral Interface (SPI) is a simple bus system for synchronous serial communication between one Master and one or more Slaves. It operates in either full-duplex mode or half-duplex mode, allowing simultaneous communication in both directions, or in one direction only. The Master device initiates an information transfer on the bus and generates clock and control signals. Slave devices are controlled by the Master through individual Slave select lines and are active only when selected.Honeywell HumidIcon ™ digital humidity sensors with SPI output operate in half-duplex mode only, with data transfer from the Slave to the Master. Three data lines are required for data transmission:Slave Select (SS)Signal Clock (SCLK)Master-In-Slave Out (MISO)All three of these bus lines are unidirectional. SS and SCLK are controlled by the Master while MISO is controlled by the Slave (see Figure 1).2.0 Data Transfer with SPI Output Humidity SensorsHoneywell’s digital output humidity sensors are design ed to work as Slaves and will therefore only respond when the SS line is asserted. Once the SS line is asserted, the sensor will begin sending data once a clock is received. By default, Honeywell digital humidity sensors are configured to change data on the MISO line with the falling edge of SCLK. This means the Master device should sample MISO on the rising (opposite edge) of SCLK.Honeywell digital humidity sensors can handle high and low SCLK polarity without configuration change. Please contact Honeywell Customer Service with questions regarding SCLK polarity and sampling MISO.Figure 2 shows an example of a 1 byte data transfer from the Slave to the Master. In this example, the data 101 (01100101 binary, or 65 hex) would be read.Figure 2. Example of a 1 Byte SPI Data Transfer with aOnce the clocking begins, Honeywell digital humidity sensors are designed to output up to four bytes of data, depending on the sensor options and the needs of the application. In all cases, the first two data bytes are the compensated humidity output, along with sensor status bits. The third and fourth bytes are for optional compensated temperature output. 2.1 Making a Measurement RequestBy default, the digital output humidity sensor performs humidity measurement and temperature measurement conversions whenever it receives a measurement request (MR) command; otherwise, the sensor is always powered down. The results are stored after each measurement in output registers to be read using a data fetch (DF) command.Detecting whether data is ready to be fetched can be handled by testing the status bits in the fetched data. Refer to Section 2.5 for details of the status bits.SPI Communication with the Honeywell HumidIcon™ Digital Humidity/Temperature Sensors2 Honeywell Sensing and Control2.2 Humidity and Temperature Measurement Request To wake up the humidity sensor and complete a measurement cycle, an MR command is used. The complete measurement cycle performs a humidity measurement and a temperature measurement and stores the results. As shown in Figure 3, an MR command is a read of eight or more bits, ignoring the data that is returned.A DF (Data Fetch) command must be completed before sending another measurement request command to start a new measurement cycle.2.3 Humidity Data FetchTo receive a compensated humidity reading, the Master generates the necessary clock signal after activating thesensor with the Slave select line. The sensor will transmit up to four bytes of data: the first two bytes contain the compensated humidity output, and the second two bytes contain the compensated temperature output.If only the compensated humidity value is required, the Master can terminate communication by stopping the clock and deactivating the slave select line after the second byte. An example of the communication is shown in Figure 4.2.4 Humidity and Temperature Data FetchThe optional corrected temperature data is read out with 14 bitresolution. By reading out the third and fourth bytes of data from the sensor, the complete 14 bit optional compensated temperature value can be read, as shown in Figure 5.When reading the full 14 bit resolution temperature output, the two least significant bits of the fourth data byte are “Do Not Care” and should be ignored.Figure 5. SPI Humidity and Temperature Data FetchPacket = [ {S(1:0),C(13:8)}, {C(7:0)}, {T(13:6)},{T(5:0),xx} ]Where:S(1:0) = Status bits of packetC(13:8) = Upper six bits of 14-bit humidity data C(7:0) = Lower eight bits of 14-bit humidity data T(13:6) = Corrected temperature dataT(5:0),xx = Remaining bits of corrected temperature data forfull 14-bit resolutionHiZ = High impedance 2.5 Status BitsHoneywell digital output humidity sensors offer status bits to ensure robust system operation in critical applications. The sensor status is indicated by the first two most significant bits of data byte 1 (See Table 1).Note 1: Command Mode is used for programming the sensor. This mode should not be seen during normal operationWhen the status bits read “01”, “s tale” data is indicated. This means that the data in the output buffer of the sensor has already been fetched by the Master, and has not yet beenupdated with the new data from the current measurement cycle. This can happen when the Master polls the data quicker than the sensor can update the output buffer.SPI Communication with the Honeywell HumidIcon™ Digital Humidity/Temperature SensorsHoneywell Sensing and Control 33.0 Measurement CycleFigure 6 shows the measurement cycle for the humidity sensor. The measurement cycle time is typically 36.65 ms fortemperature and humidity readings. It is recommended that the user wait until the measurement cycle has completed rather than polling for data to reduce current consumption and noise.Figure 6. Measurement Cycle for Humidity and4.0 Calculation of the Humidity Value from the Digital OutputFor Honeywell humidity sensors, the output of the device is simply a 14 bit number representing between 0 %RH and 100 %RH (see Equation 1):0 %RH = 0 counts100 %RH = 214- 2 counts5.0 Calculation of Optional Temperature from the Digital OutputFor Honeywell Humidity Sensors with the optionalcompensated temperature output, the output of the device is simply a 14 bit number representing between -40 ºC and 125 ºC (see Equation 2):-40 ºC = 0 counts125 ºC = 214– 2 counts6.0 Timing and Level Parameters (See Figure7.)SPI Communication with the Honeywell HumidIcon™ Digital Humidity/Temperature SensorsSensing and ControlHoneywell1985 Douglas Drive NorthGolden Valley, MN 55422 /sensing 009071-1-ENJuly 2012Copyright © 2012 Honeywell International Inc. All rights reserved.WARRANTY/REMEDYHoneywell warrants goods of its manufacture as being free of defective materials and faulty workmanship. Honeywell’s standard product warranty applies unless agreed to otherwise by Honeywell in writing; please refer to your order acknowledgement or consult your local sales office for specific warranty details. If warranted goods are returned to Honeywell during the period of coverage, Honeywell will repair or replace, at its option, without charge those items it finds defective. The foregoin g is buyer’s sole remedy and is in lieu of all other warranties, expressed or implied, including those of merchantability and fitness for a particular purpose. In no event shall Honeywell be liable for consequential, special, or indirect damages.While we provide application assistance personally, through our literature and the Honeywell web site, it is up to the customer to determine the suitability of the product in the application.Specifications may change without notice. The information we supply is believed to be accurate and reliable as of this printing. However, we assume no responsibility for its use. SALES AND SERVICEHoneywell serves its customers through a worldwide network of sales offices, representatives and distributors. For application assistance, current specifications, pricing or name of the nearest Authorized Distributor, contact your local sales office or:E-mail:*********************Internet: /sensingPhone and Fax:Asia Pacific +65 6355-2828+65 6445-3033 FaxEurope +44 (0) 1698 481481+44 (0) 1698 481676 FaxLatin America +1-305-805-8188+1-305-883-8257 FaxUSA/Canada +1-800-537-6945+1-815-235-6847+1-815-235-6545 Fax。
Honeywell PHD实时数据库结构浅析
基于高级程序语言 的应用开发和功能强大 的趋势分析功
能。
其接 口形式主要有 : a ) S h a d o w接 口。S h a d o w接 口可 以将远 程P H D与主 P HD 连 接起来 ,远程P HD 是 一个完 整的P H D系统 ,主
二 、P HD 系统 的构成 及接 口形式
据 的压缩可 以实现大量数据 的长期存储 。系统的虚拟位
3 4 信 息 系统1 程 【2 0 1 3 . 5 2 0
三 、结束 语
P H D 实 时数据库 和O r a c l e 关系数据库搭建的数据平 台,能够确保数据交流通 畅,并将实时数据纳入管理系 统 中 ,进行深层次挖掘和分析 ,管理者可以利用实 时数 据 动态 地监控 生产成 本 ,使 成本控 制发 生在生 产过程
P H D服 务器从 实时系统 中收集 并存储 在 自己的P H D数 据库 中,主P H D J ]  ̄ 务器定期 的获取这些信 息并提供给用
户 。如 果 由于某 种原 因 主P HD J ]  ̄ 务 器 和远 程 P H D H  ̄ 务 器
b ) 数据 的处理和储 存。P H D作为一 体化数据库应用
P H D 系统是由霍尼韦尔公司推出的生产信息集成平 台 ,为流程工业提供 了一个用于生产管理的统一 的信息
化数据库 。它将生产过程数据 、物料移动数据 、设备状
态 、产 品质量指标 等各种数据采集 、存储并 加工成新 的 信息 资源 ,提供给管理 、销售 、技术 、操作 等各层次人 员 ,从而解决 了企业各个部 门信息不一致的问题 ,帮助 他们做 出及时有效 的决策 。
a ) 数据 的采 集 。P H D系统 具有 统一 的数据 采集 基 础 结 构 和 连接 多种 系 统 的 实 时数 据 库 的 产 品化 接 口 R D I ( R e a l T i me Da t a b a s e I n t e r f a c e ) ,其能够像D c s 一样长
Honeywell 35 Series Embedded NVR支持说明书

FEATURES AND BENEFITSSupports Honeywell 35 Series Embedded NVRs Connection to NVR anytime anywhere (local,remote, global P2P)Multi-NVR magement, supports up to2048 video channel connectionSupports two way audio through 35S NVR with 35S camerasSupports up to 64 live view windows in 1 single screenSupports Windows® 10 (64-bit)Auto streaming size to save decode and streaming bandwidthSupports receiving video analytic events from 35S series cameras through 35S NVRDual monitorsconfigurable to display live view, tour, E-map or event viewsEditable displayinformation on liveview End to end HTTPs stream encryptionVideo recording and playback managementEvent management and event trigger Device management PTZ ControlMFZ and digital zoom Fisheye dewarping E-mapHONEYWELL SMARTVIEWERHoneywell Smart Viewer (HSV) is designed to connect and manage multiple 35 Series Embedded NVRs.For 35 Series NVRsFeaturing a user-friendly interface, HSV can be deployed for device management and configuration, video live view and playback, event management, PTZ control, fisheye camera de-warping and E-map.This view also features multiple monitor support, multiple display layouts, customized views and tours, two-way audio and global P2P remote connection for efficiency monitoring and operation. HSV supports up to 2048 cameras and multiple NVRs making it ideal for medium to large scale video surveillance systems. With HTTPS and TLS 1.2 encryption streaming and communication between HSV and 35 Series NVRs, customers can increase compliance, reduce potential liability costs and realize the benefits of an end-to-end encrypted and secure video surveillance.MARKET OPPORTUNITIESIntuitive user interface, full features, HTTPs encryption, multiple sites management, global P2P enabled remote connection make this video management viewer perfect for a wide range of medium and large scale security applications where efficiency is important, compliance is essential and data is protected.SYSTEM DIAGRAM35 Series NVRs InternetHoneywell Smart ViewerIP Cameras * For more hardware and integration details, please refer to user manualTECHNICAL SPECIFICATIONSComputer version available onhttps://Android™ is a trademark or registered trademark of Google Inc. in the United States and/or other countries.Apple® is a trademark or registered trademark of Apple, Inc. in the United States and/or other countries.Intel® and Core™ are trademarks or registered trademarks of Intel Corporation or its subsidiaries in the United States and/or other countries.Microsoft® and Windows®are either registered trademarks or trademarks of Microsoft Corporation in the United States and/or other countries.ONVIF and the ONVIF logo are trademarks of ONVIF Inc.HEVC Advance logo is a trademark of HEVC Advance .Honeywell reserves the right, without notification, to make changes in product design or specifications.HVS-35HSV-02-US(0123)DS-Y© 2023 Honeywell International Inc.For more information:/securityHoneywell Commercial Security 715 Peachtree St. NE Atlanta, GA 。
(完整版)霍尼韦尔-实时数据库PHD-介绍
Uniformance PHD R310霍尼韦尔工厂过程历史数据库管理系统将数据转化为知识Uniformance PHD过程历史数据库管理系统采集、存储、重现历史及实时工厂数据,提高数据安全和利用率,提升业务绩效PHD为企业的今天及未来,提供完整的历史数据解决方案Uniformance PHD 采集、存储、重现历史及实时工厂数据,使得在生产车间、工厂乃至全公司范围内均能及时了解相关数据信息。
PHD强大的实时数据处理能力确保了企业员工更方便高效地协作、制定并执行生产计划,从而提升业务绩效。
Uniformance PHD支持跨越多个工厂和现场的多控制系统及多应用程序的大规模集成,提供无缝的数据集成接口、自动故障恢复的数据采集、自动历史数据恢复功能,保证大型长周期历史数据库的数据安全与可靠性,确保用户能随时访问数据以及与各类应用的有效集成。
除了采集和整合潜在的大量过程数据之外,PHD还具备强大的历史数据处理功能,可以将繁杂的数据转换成有用的信息。
如“虚拟位号”数学计算功能允许用户将工程和业务知识应用至当前和历史数据中,而内置的工程单位自动转换功能可以帮助用户以其熟悉的方式查看相关数据。
过程数据与业务数据的紧密整合使得用户可以全面了解整个企业的运营情况。
PHD的效益Uniformance PHD为用户带来如下效益:•可扩展性: PHD的分布式结构保证可以从不同的数据源采集数据并汇总到单一而一致的数据库系统中。
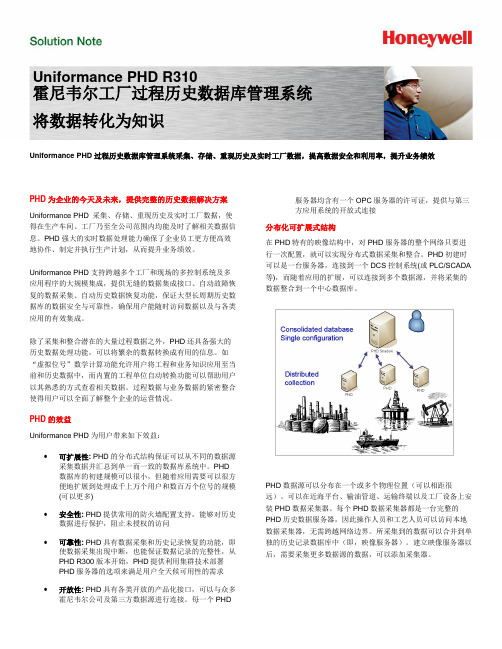
PHD数据库的初建规模可以很小,但随着应用需要可以很方便地扩展到处理成千上万个用户和数百万个位号的规模(可以更多)•安全性: PHD提供常用的防火墙配置支持,能够对历史数据进行保护,阻止未授权的访问•可靠性: PHD具有数据采集和历史记录恢复的功能,即使数据采集出现中断,也能保证数据记录的完整性,从PHD R300版本开始,PHD提供利用集群技术部署PHD服务器的选项来满足用户全天候可用性的需求•开放性: PHD具有各类开放的产品化接口,可以与众多霍尼韦尔公司及第三方数据源进行连接。
- 1、下载文档前请自行甄别文档内容的完整性,平台不提供额外的编辑、内容补充、找答案等附加服务。
- 2、"仅部分预览"的文档,不可在线预览部分如存在完整性等问题,可反馈申请退款(可完整预览的文档不适用该条件!)。
- 3、如文档侵犯您的权益,请联系客服反馈,我们会尽快为您处理(人工客服工作时间:9:00-18:30)。
Uniformance®Robust Data CollectionUser GuideR310Copyright, Notices, and Trademarks© Honeywell International Inc. 1998 – 2012 All Rights Reserved.While this information is presented in good faith and believed to be accurate, Honeywell disclaims the implied warranties of merchantability and fitness for a particular purpose and makes no express warranties except as may be stated in its written agreement with and for its customers.In no event is Honeywell liable to anyone for any indirect, special or consequential damages. The information and specifications in this document are subject to change without notice.Honeywell, Experion, PlantScape, TotalPlant, Uniformance PHD, and Business FLEX are U.S. registered trademarks of Honeywell International Inc.Other brand or product names are trademarks of their respective owners.Release InformationUniformanceDocument Revision: 14Document Revision Date: February, 2012Document ID: pim3501Document Revisions:DocumentPAR DescriptionRevision13 n/a Revised the document for R300.14 n/a Revised the document for R310.Honeywell Process Solutions1860 W. Rose Garden LnPhoenix, Arizona 85027-2708 USA/psii Uniformance - Robust Data Collection User GuideSupport and Other ContactsUnited States and CanadaContact: Honeywell Solution Support CenterPhone: 1-800 822-7673.Calls are answered by dispatcher between 6:00 A.M. and 4:00 P.M. Mountain StandardTime. Emergency calls outside normal working hours are received by an answeringservice and returned within one hour.Mail: Honeywell HPS TAC, MS L171860 W Rose Garden LnPhoenix, Arizona 85027-2708EuropeTAC-EMEAContact: HoneywellPhone: +32-2-728-2732Facsimile: +32-2-728-2696Mail: TAC-BE02PlazaHermes1HHermeslaan,B-1831 Diegem, BelgiumPacificContact: Honeywell Global TAC – PacificPhone: 1300-300-4822 (toll free within Australia)Australia)(outside+61-8-9362-9559Facsimile: +61-8-9362-9564Mail: Honeywell Limited Australia5 Kitchener WayBurswood 6100, Western AustraliaEmail: GTAC@IndiaContact: Honeywell Global TAC – India66039400Phone: +91-20-Facsimile: +91-20- 66039800Mail: Honeywell Automation India Ltd.56 and 57, Hadapsar Industrial EstateHadapsar, Pune –411 013, IndiaEmail: Global-TAC-India@Uniformance Robust Data Collection User Guide iiiSupport and Other Contacts iv Uniformance - Robust Data Collection User GuideKoreaContact: Honeywell Global TAC – KoreaPhone: +82-80-782-2255 (toll free within Korea)Facsimile: +82-2-792-9015Mail: Honeywell Co., Ltd4F, Sangam IT Tower B4-4 Block1590, DMC Sangam-dong, Mapo-gu,Seoul, 121-835, KoreaEmail: Global-TAC-Korea@People’s Republic of ChinaContact: Honeywell Global TAC – ChinaPhone: +86- 21-52574568Mail: Honeywell (China) Co., Ltd33/F, Tower A, City Center, 100 Zunyi Rd.Shanghai 200051, People’s Republic of ChinaEmail: Global-TAC-China@SingaporeContact: Global TAC – South East AsiaPhone: +65-6580-3500Facsimile: +65-6580-3501+65-6445-3033Mail: Honeywell Private LimitedHoneywell Building17, Changi Business Park Central 1Singapore 486073Email: GTAC-SEA@TaiwanContact: Global TAC – TaiwanPhone: +886- 7- 536 2567Facsimile: +886-7-536 2039Mail: Honeywell Taiwan Ltd.17F-1, No. 260, Jhongshan 2nd Road.Cianjhen DistrictKaohsiung, Taiwan, ROCEmail: Global-TAC-Taiwan@Support and Other ContactsJapanContact: Global TAC – JapanPhone: +81-3-6730-7160Facsimile: +81-3-6730-7228Mail: Honeywell Japan Inc.New Pier Takeshiba, South Tower Building,20th Floor, 1-16-1 Kaigan, Minato-ku,Tokyo 105-0022, JapanEmail: Global-TAC-JapanJA25@ElsewhereCall your nearest Honeywell office.World Wide WebHoneywell Solution Support Online: /psTraining ClassesHoneywell Automation College: Uniformance - Robust Data Collection User Guide vSupport and Other Contactsvi Uniformance - Robust Data Collection User GuideContents1.ABOUT THIS DOCUMENT (11)1.1Who Should Use this Guide (11)1.2What is in this Guide (11)1.3Contact Us (11)2.INTRODUCING ROBUST DATA COLLECTION (13)2.1RDC Functionality (13)2.2RDC Configuration Overview (14)RDI/Link Configuration Requirements (14)RDC Port Number Usage (15)RDI Setup Utility (15)Interface.Dat File Requirements (15)Interfaces_CustomConfig.Dat File (15)Time Synchronization Requirements (16)2.3Single Collector Node to Shadow Configuration (16)2.4Dual Collector Node to Shadow Configuration (16)2.5Summary of RDC Features (19)2.6Real-time System Description (20)2.7Required Software Components (20)2.8History Recovery (21)Data Collection During History Recovery (21)History Recovery for RDC Scheme without a Standby Collector (22)Duration of History Recovery (22)RDC Caching during History Recovery (22)3.ROBUST DATA COLLECTION - DUAL COLLECTOR MODE (23)3.1Dual Collector RDC Architecture (23)3.2Fail-over Functionality (25)Uniformance Robust Data Collection User Guide viiContentsAutomatic Fail-over (25)Manual Fail-over (26)3.3Short Duration Data Loss (26)4.CONFIGURING ROBUST DATA COLLECTION (27)4.1General Guidelines (27)4.2Determine the Port Numbers (27)4.3RDC Configuration Checklist (28)4.4RDI-Specific Documents (30)4.5Prepare the System Environment (30)Update Hosts File on PHD Servers (30)Update Services File to Reserve RDC Ports (31)4.6To Define Source System Tag Attributes and Data Types (32)4.7Complete the RDI Type Configuration Form (32)4.8Complete the Interfaces (RDI’s & Links) Form (33)4.9Complete the RDC configuration Form (37)4.10Verify PHD Configuration on Each RDC Node (40)To Increase Maximum Tags (PhdParams.Dat) (40)5.INSTALL INTERFACES ON RDC NODES (41)5.1Run RDISetup (41)To Run RDISetup for RDC Nodes (41)5.2History Recovery on RDC Nodes (45)5.3Interpret Interfaces.Dat File on RDC Nodes (46)5.4Define and Start interfaces on a Running PHD System (47)6.CONFIGURING PHD TAGS (49)6.1Tags on RDC Shadow Interfaces (49)Tag Field Usage (49)6.2Tags on RDC Collector Interfaces (49)6.3Implement an RDC Watch Dog Tag (Optional) (50)WATCHDOG_TIMER parameter (50)viii Uniformance - Robust Data Collection User GuideContents Watch Dog Tag Configuration Guidelines (50)To Implement a Watch Dog Tag (51)7.MODIFY RDC REGISTRY SETTINGS (53)7.1Enable RDC Disk Caching (Optional) (53)7.2Enable Interface to Execute in Standby and Active Modes (54)8.MONITOR RDC STATUS (55)8.1Access RDC Status Display (55)8.2RDC Status Display Examples (56)8.3Use NSCAN Parameter To Monitor Status (58)9.TROUBLESHOOT RDC (59)9.1Watchdog-related Symptoms (59)APPENDIX A – RDC CONFIGURATION EXAMPLE (61)Example – RDC Topology (61)RDC Data specification form (62)Example – RDC Data Specification Form (63)Example – RDC Entries in Interfaces.Dat File (64)Interfaces.Dat – RDC Shadow node S37 (64)Interfaces.Dat – Collector node APP49 (64)Interfaces.Dat – Collector node APP50 (65)APPENDIX B – RDC FLOW CHARTS (67)RDC Flow Charts (67)Active RDI Flow (67)Standby RDI Flow (68)Shadow RDI Flow (69)GLOSSARY (71)INDEX (73)Uniformance - Robust Data Collection User Guide ixContentsx Uniformance - Robust Data Collection User Guide1. About This Document1.1 Who Should Use this GuideThis guide is intended for those experienced in the configuration and commissioningof PHD.1.2 What is in this GuideThe following table shows the information in each section of this guide:This section… Contains this information…Introducing Robust Data Collection Detailed description of what Robust Data Collection accomplishes when operating in single or dual collector mode.Robust Data Collection - Dual Collector Mode Additional details about an RDC scheme operating in dual collector mode.Configuring Robust DataCollectionInstructions on how to configure Robust Data Collection.Install Interfaces on RDC Nodes Instructions on how to install Robust Data Collection onthe shadow and collector nodes.Monitor RDC Status How to access and interpret the RDC status display.Appendix A – RDC Configuration Example An example RDC topology with associated PHD Configuration Tool forms and Interfaces.Dat files.Appendix B – RDC Flow Charts Flow charts of RDC operation.1.3 ContactUsIf you have any comments or concerns about this documentation, please e-mail us at: support@. Ensure that you type Uniformance Documentation in the subject line of your e-mail message.1 About This Document 1.3 Contact Us2. Introducing Robust DataCollectionFunctionality2.1 RDCRobust Data Collection (RDC) can be referred to as the methodology used to transferdata from a collector node PHD server to the shadow PHD server. A shadow server isa remote PHD node used to gather and store process information from one or morePHD collector node.RDIs and Links (interfaces) on the collector system send the real-time values directlyto the shadow server. The shadow and collector nodes use the same RDBMSdatabase and, therefore, share the same tags. The shadow node provides a bufferbetween the client environment and the process environment. The PHD collectornodes collect real-time data while the PHD Shadow nodes serve process history datato end users. The end user has access to process data without having to connect to anode on the real-time system.On a per-interface basis, Robust Data Collection provides the ability to configuredata collection in the following modes:∙single collector to shadow server∙dual collector to shadow server (not available for Links)When dual collector nodes are implemented, one collector acts as a primary collector,sending data to both the standby and the shadow servers. The standby collector actsas a warm backup node. If a standby collector detects that the primary is not in anACTIVE state, the standby will take over data collection.Note: Links can only be configured to use RDC in single collector to shadow servermode.2 Introducing Robust Data Collection2.2 RDC Configuration Overview2.2 RDC Configuration OverviewRDI/Link Configuration RequirementsThe ability to implement RDC is provided for all interfaces supported by PHD. Each interface must be configured to use RDC behavior for collector and shadowfunctionality. Each of the interfaces must be configured to act in collection or shadow operation. This behavior is available in the common base interface definitionstructures used by all RDIs and Links.You use the PHD Configuration Tool (previously named TPI) to enter the SQLServer data:∙Parameters must exist in the RDI Types configuration form. ∙ Interfaces must exist in the Interface (RDI’s & Links) configuration form for both collector and shadow nodes.∙An entry must exist in the Robust Data Collection configuration form to provide the port numbers for each interface that is to participate in an RDC scheme. The RDC configuration form contains a graphic diagram similar to the following figure for entry of the RDC data. You use the form to identify the behavior forcollector and shadow functionality. The form contains fields for each machine that is to run a copy of the RDI in an RDC scheme.An RDC scheme uses either two or three machines, depending on the functionality required by the site:∙SHADOW ∙ACTIVE ∙ STANDBY (only required for dual collector systems) Figure 1 – RDC Configuration Form – Single Collector Example2 Introducing Robust Data Collection2.2 RDC Configuration OverviewRDC Port Number UsagePHD 150 and prior releases had the Shadow node query (or poll) the collector node for historical and current data.PHD 201 and later now use a push technology for transferring data from the collector node to the shadow node.Communication from the collector computer to the shadow computer requires the configuration and use of unique TCP/IP port addresses between the computers. The ports used must not be used by any other applications resident on or accessing the computers.The receiving-end computer (which, for simple configurations, is the shadow computer) listens on the identified port. The sending-end computer (which, for simple configurations, is the collector computer) transmits data to the identified port. All subsequent communications for the interface between the affected computers use this identified port.Even during a period of History Recovery, the collector node continues to transmit current tag values to the shadow node. The shadow accumulates these values and processes them only after completing the processing of all historical values associated with the interface on the collector node.RDI Setup UtilityAfter entering the SQL Server data on the systems, you run the RDISetup utility (the replacement for the RDI_Services program) on each PHD Server to automatically configure the required SET commands in the Interfaces.Dat file. It may also have to copy the RDI DLL file.Interface.Dat File RequirementsAfter running RDISetup, the Interfaces.Dat file will contain the required RDC SET commands.Interfaces_CustomConfig.Dat FilePrior to Uniformance 210, the RDC SET commands were manually entered by the user into the Interfaces_CustomConfig.Dat file.On pre-210 systems, manual modifications to the Interfaces_CustomConfig.Dat file were required for any environment where RDC configuration was employed, because RDI_Services did not provide the extended configuration requirements for RDC configuration.2 Introducing Robust Data Collection2.3 Single Collector Node to Shadow ConfigurationOn 210 and greater systems, the Interfaces_CustomConfig.Dat file is used only forcustom interface configurations (for example, the WATCHDOG_TIMER parameter)and RDI_Services is replaced by the RDISetup utility.Time Synchronization RequirementsHoneywell highly recommends Time Synchronization across nodes if Robust DataCollection is being implemented.REFERENCE: Refer to Microsoft documentation for information about Windowstime synchronization mechanisms.2.3 Single Collector Node to Shadow ConfigurationIn the example form shown in Figure 1, the shadow computer is being told to listenon port 54200 for incoming communication; and the collector computer is being toldto send communications to port 54200 on the shadow computer. For thisconfiguration, the RDISetup utility inserts the following commands into theInterfaces.Dat file:On Shadow computer:SET MYRDI1:MODE SHADOWSET MYRDI1:ACTIVENODE COLLECTR1/54200On Collector computer:SET MYRDI1:MODE ACTIVESET MYRDI1:ACTIVENODE MYSHADOW/54200For each additional configured interface using RDC, the user must add another porton the shadow and collector computer.Note: Honeywell recommends that when configuring single collector/shadowconfigurations, the user increment the port number on the shadow computer by twofor each RDI.SET MYRDI1:ACTIVENODE COLLECTR1/54200SET MYRDI2:ACTIVENODE COLLECTR1/54202SET MYRDI3:ACTIVENODE COLLECTR2/542042.4 Dual Collector Node to Shadow ConfigurationIn the example in Figure 2, the user added a second collector (standby) computer tothe collection environment, and has set up the shadow computer to listen on port54201 for data from the standby computer COLLECTR1B. For this configuration,RDISetup will insert the following commands into the Interfaces.Dat file:On Shadow computer:2 Introducing Robust Data Collection2.4 Dual Collector Node to Shadow ConfigurationSET MYRDI1:ACTIVENODE COLLECTR1/54200SET MYRDI1:STANDBYNODE COLLECTR1B/54201Figure 2 – RDC Configuration Form – Dual Collector ExampleThe steps identified must be followed for each and every interface running on the collector computer for which the data collected is to be replicated to the shadow computer.For each interface running on any computer, a unique port must be used such that, should two separate collectors be replicating collected data to the same shadow computer, each interface on the shadow has a unique port.The forms in Figure 3 set up the following configuration for the shadow computer: ∙Listen on port 54203 for data from standby computer COLLECTR1B for RDIMYRDI2∙Listen on port 54205 for data from standby computer COLLECTR2B for RDIMYRDI3.For this configuration, RDISetup inserts the following commands into the Interfaces.Dat file.On Shadow computer:SET MYRDI2:ACTIVENODE COLLECTR1/54202SET MYRDI2:STANDBYNODE COLLECTR1B/54203SET MYRDI3:ACTIVENODE COLLECTR2/54204SET MYRDI3:STANDBYNODE COLLECTR2B/542052 Introducing Robust Data Collection2.4 Dual Collector Node to Shadow ConfigurationFigure 3 – RDC Configuration Forms – Additional Dual Collector Examples2 Introducing Robust Data Collection2.5 Summary of RDC Features The following figure summarizes the SET commands generated for RDIs in the previous examples.Figure 4 – Dual Collector to Shadow Server – Topology2.5 Summary of RDC FeaturesThe following is a list of the main features of Robust Data Collection.∙Configuration of a Standby Server for redundancy.∙Automatic fail-over to the Standby Server upon failure of the Active Server.∙Manual fail-over to Standby Server due to software maintenance on Active Server. ∙Automatic data recovery by the Active Server from the Standby Server.∙Standard access to PHD data from the Standby Server while in Standby Mode.∙No dual collection of data from the source system by the Standby Server while in Standby Mode.∙Interface type independent.2 Introducing Robust Data Collection2.6 Real-time System Description2.6 Real-time System DescriptionThe critical element is the ability of the source system to provide a lost connectivityindication to the interface. In general, most interfaces rely on a connectivity state,which is maintained by the interface layer to the source system. The capabilities ofthe interface layer may vary. As an example, the File Access RDI does not connectdirectly to a source system and, therefore, does not have a connectivity state. Thus, itdoes not support the switchover capability. Honeywell can provide furtherclarification upon request.2.7 Required Software ComponentsIn all cases, the collector computer uses an interface that communicates to the rawdata provider (it is a source system collector node).Example: RDILXS.dll, RDIOPC.dll, or PHDEXPInterface.dllIn all cases, the shadow computer will use either RDIShadow.dll orPHDEXPInterface.dll.From R310 and up RDI’s can be reentrant. In some cases this may not be the case. Ifa non-reentrant RDI is being used then each interface defined on a collectioncomputer must have a unique name. It is recommended this name be different fromthe supplied rdiXXX.dll name.Example (where 'rdiname' is identical on both nodes):RDIShadow.dll is copied to RDI<rdiname>.dll on the shadow node.RDILXS.dll is copied to RDI<rdiname>.dll on the collector node.2 Introducing Robust Data Collection2.8 History RecoveryFigure 5 – RDC Software Components Diagram2.8 HistoryRecoveryData Collection During History RecoveryWhen using Robust Data Collection with active/standby collectors, history recovery occurs concurrently with data collection. During the history recovery, the collected data is buffered and then applied to the archives once history recovery has completed. Continuation of real-time data collection during history recovery alleviates the problem with data gaps.The RDI Server buffers the real-time data that is collected while history recovery is in progress. The data is buffered until the history recovery is complete. Upon completion, the real-time data collected during history recovery is transferred to the PHD archives. When the interface retrieves real-time data during a history recovery, it records the data in the PHD archives in the correct time-sequenced order.2 Introducing Robust Data Collection2.8 History RecoveryHistory Recovery for RDC Scheme without a Standby CollectorWith 210 and later (and 201.1.6 or later and 202.1.2 or later), history recovery occursfrom the source system through the Collector node to the Shadow server, even if asecondary (Standby) collector is NOT configured in RDC.In previous releases under RDC, history recovery occurred from the secondarycollector only. When RDC history recovery was required in previous releases with asingle collector, a Gateway RDI on the shadow was used with the Remote Peer RDIon the collector.With release 310, history recovery may occur from the source system through theBuffer to the Shadow server, even if a secondary (Standby) collector is notconfigured in Robust Data Collection.In RDC, you can implement a shadow server and a single collector as a PHD to PHDtype of interface - a shadow interface runs on the Shadow RDC node and a historyrecoverable interface runs on the buffer node.Duration of History RecoveryFor systems running PHD 200 and later software, the interfaces on the Shadow RDCnode automatically perform full history recovery (all collected history is recovered).The default configuration may be modified if the site requires history recovery to bedependent on the amount of data being collected by the collector node or the durationof an outage.If full history recovery is not a site requirement, then parameters MIN_HISTRECMNand MAX_HISTRECMN (with appropriate settings) must be configured.For instructions on adding these parameters, refer to the section History Recovery onRDC Nodes.RDC Caching during History RecoveryDuring history recovery, simultaneously collected data is buffered. By default thevalues are buffered in memory. On a system with a large number of tags, orinterfaces, history recovery could take a long time. The longer history recovery takes,the more collected values need to be buffered.To minimize the amount of memory required by the RDI Server to buffer values, amechanism exists to cache the values to a disk file; thus, memory overhead isreduced and larger systems are supported.This requires a modification to the registry.For instructions for modifying the registry, refer to the section 7.1, Enable RDC DiskCaching (Optional).3. Robust Data Collection - DualCollector Mode3.1 Dual Collector RDC ArchitectureDual collector RDC mode is only available for RDI’s. Links do not support this modeof operation.The following Figure illustrates the architecture for RDI support of the fail-overcapability.Attention: The concept of 'Active' and 'Standby' is RDI-based, not node-based. Acomputer node can host both Active and Standby RDIs; this is beneficial for loadbalancing. For simplicity, the following examples segregate Active and StandbyRDIs on separate computer nodes.On the Active system, the RDIs collect data directly from the source system. Theysend the data to the Active PHD Server and to the partner RDIs on the StandbyServer.The RDIs on the Standby Server initialize, but do not communicate with the sourcesystem for the tag values. They rely on the RDIs on the Active system for the tagvalues. The values are pushed to the Standby Server so that the values are always upto date.Figure 6 – Dual Collector Fail-over ArchitectureIf the Active system goes down (loss of network connectivity or RDI shutdown), theStandby RDIs begin collecting data from the source system and provide these valuesto the Standby PHD Server. It continues to collect these values until the Activesystem comes back up and begins collecting.3 Robust Data Collection - Dual Collector Mode3.1 Dual Collector RDC ArchitectureWhen the Active system comes back up, it initiates a history recovery from theStandby Server and simultaneously begins collecting from the source system. See theActive RDI Flow in Appendix B – RDC Flow Charts.Similarly, when a Standby system has been down, and comes back up, it does ahistory recovery and begins receiving real-time values from the Active system. TheStandby always has a full history of the data collected on the Active Server. When afail-over condition occurs, any application that re-directs to the Standby has access tothe history data in addition to the real-time data. See the Standby RDI Flow inAppendix B – RDC Flow Charts.The mechanism for transferring data from the Active to the Standby RDIs is alsoused to transfer data between the collector and shadow systems (see the followingfigure).Upon Active collector fail-over, RDIs on the Standby system send the real-timevalues directly to the shadow server.Figure 7 – Dual Collector to Shadow Server RDC ArchitectureWhen a Shadow Server is receiving from a collector system consisting of anActive/Standby pair, the Shadow Server is able to receive data from the Standbysystem on failure of the Active Server. See the Shadow RDI Flow in Appendix B –RDC Flow Charts.3 Robust Data Collection - Dual Collector Mode3.2 Fail-over FunctionalityFunctionality3.2 Fail-overThe Standby system∙provides data storage,∙provides data collection,∙provides data transfer to a shadow, and∙is accessible to client applications.The fail-over functionality is available on all source systems supported by PHD. Automatic Fail-overIf the Active server is no longer in an ACTIVE state, or if network communication is lost, the Standby server takes over collection of data from the source system and continues the collection/storage of this data in PHD.For automatic fail-over to occur, there must exist at least one collected tag on the RDI (with a frequency as slow as one minute) to ensure that RDC is aware that the RDI on the primary went down.Automatic Failure Detection by Standby SystemRDC provides the ability for the Standby system to detect the failure of the Active RDI collection system and automatically begin the collection of data.Fail-over will occur only when∙the primary RDI is down or inaccessible, and∙the watchdog tag test has failed (if configured).Note: External errors such as node isolation, DCS errors, or bad data will not trigger an RDC fail-over unless they cause the RDI to fail.Optional Watchdog TagA watchdog tag is an optional feature of RDC, intended to protect the user from duplicate data collection between the primary and standby server in case of a network communication failure. During a network failure, the standby PHD server will check the state of the watchdog tag to see if the primary is continuing to operate normally. If the watchdog tag is being updated, the standby will not start collection, thus avoiding duplicate data collection.Note: A watchdog tag failure on its own will not cause RDC to fail-over. An RDC fail-over occurs only when∙the primary RDI is not ACTIVE, or∙the primary RDI cannot be reached over the network, and∙the watchdog tag is not current.。