Spatial2_空间数据分析_harvard_第二章
SAT 2 数学2 college board官网全部原题加答案讲解 SAT Subject Test Math Level 2
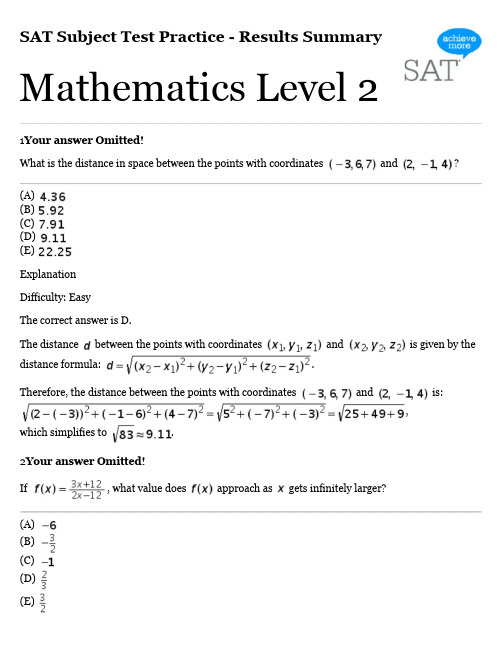
SAT Subject Test Practice - Results Summary Mathematics Level 21Your answer Omitted!What is the distance in space between the points with coordinates and ?(A)(B)(C)(D)(E)ExplanationDifficulty: EasyThe correct answer is D.The distance between the points with coordinates and is given by the distance formula: .Therefore, the distance between the points with coordinates and is:,which simplifies to .2Your answer Omitted!If , what value does approach as gets infinitely larger?(A)(B)(C)(D)(E)ExplanationDifficulty: EasyThe correct answer is E.One way to determine the value that approaches as gets infinitely larger is to rewrite the definition of the function to use only negative powers of and then reason about the behavior of negative powers of as gets infinitely larger. Since the question is only concerned with what happens to as gets infinitely larger, one can assume that is positive. For , theexpression is equivalent to the expression . As gets infinitely larger, the expression approaches the value , so as gets infinitely larger, the expression approaches the value . Thus, as gets infinitely larger, approaches .Alternatively, one can use a graphing calculator to estimate the height of the horizontal asymptote for the function . Graph the function on an interval with “large”, say, from to .By examining the graph, the all seem very close to . Graph the function again, from, say, to .The vary even less from . In fact, to the scale of the coordinate plane shown, the graph of the function is nearly indistinguishable from the asymptotic line . This suggests that as gets infinitely larger, approaches , that is, .Note: The algebraic method is preferable, as it provides a proof that guarantees that the value approaches is . Although the graphical method worked in this case, it does not provide a complete justification; for example, the graphical method does not ensure that the graph resembles a horizontal line for “very large”such as .3Your answer Omitted!If is a factor of , then(A)(B)(C)(D)(E)ExplanationDifficulty: EasyThe correct answer is A.By the Factor Theorem, is a factor of only when is a root ofthat is, , which simplifies to . Therefore, .Alternatively, one can perform the division of by and then find a value for so that the remainder of the division is .Since the remainder is , the value of must satisfy . Therefore, .4Your answer Omitted!Alison deposits into a new savings account that earns percent interest compounded annually. If Alison makes no additional deposits or withdrawals, how many years will it take for the amount in the account to double?(A)(B)(C)(D)(E)ExplanationDifficulty: MediumAfter year, the amount in the account is equal to . After years, the amount isequal to , and so on. After years, the amount is equal to . You needto find the value of for which . There are several ways to solve this equation. You can use logarithms to solve the equation as follows.Since , it will take more than years for the amount in the account to double. Thus, you need to round up to .Another way to find is to use your graphing calculator to graph and . From the answer choices, you know you need to set the viewing window with values from to about and values extending just beyond . The of the point of intersection is approximately . Thus you need to round up to .5Your answer Omitted!In the figure above, when is subtracted from , what is the length of the resultant vector?(A)(B)(C)(D)(E)ExplanationDifficulty: MediumThe resultant of can be determined by . The length of the resultant is:6Your answer Omitted!In the -plane, what is the area of a triangle whose vertices are , , and ?(A)(B)(C)(D)(E)ExplanationDifficulty: MediumIt is helpful to draw a sketch of the triangle:The length of the base of the triangle is and the height of the triangle is . Therefore, the area of the triangle is . The correct answer is B.7Your answer Omitted!A right circular cylinder has radius and height . If and are two points on its surface, what is the maximum possible straight-line distance between and ?(A)(B)(C)(D)(E)ExplanationDifficulty: MediumThe maximum possible distance occurs when and are on the circumference of opposite bases: You can use the Pythagorean Theorem:The correct answer is (B).8Your answer Omitted!Note: Figure not drawn to scale.In the figure above, and the measure of is . What is the value of ?(A)(B)(C)(D)(E)ExplanationDifficulty: MediumThere are several ways to solve this problem. One way is to use the law of sines. Since ,the measure of is and the measure of is . Thus, and . (Make sure your calculator is in degree mode.)You can also use the law of cosines:Since is isosceles, you can draw the altitude to the triangle.9Your answer Omitted!The function is defined by for .What is the difference between the maximum and minimum values of ?(A)(B)(C)(D)(E)ExplanationDifficulty: MediumIt is necessary to use your graphing calculator for this question. First graph the function. It is helpful to resize the viewing window so the -values go fromto . On this interval the maximum value of is and the minimum value of is. The difference between these two values is , which rounds to .10Your answer Omitted!Suppose the graph of is translated units left and unit up. If the resulting graph represents , what is the value of ?(A)(B)(C)(D)(E)ExplanationDifficulty: MediumIt may be helpful to draw a graph of and .The equation for is . Therefore,. The correct answer is B.11Your answer Omitted!A sequence is recursively defined by , for . If and , what is the value of ?(A)(B)(C)(D)(E)ExplanationDifficulty: MediumThe values for and are given. is equal to . is equal to. is equal to . is equal to.If your graphing calculator has a sequence mode, you can define the sequence recursively and findthe value of . Let , since the first term is . Define . Let , since we have to define the first two terms and . Then examining a graph or table, you can find .12Your answer Omitted!The diameter and height of a right circular cylinder are equal. If the volume of the cylinder is , what is the height of the cylinder?(A)(B)(C)(D)(E)ExplanationDifficulty: MediumThe correct answer is A.To determine the height of the cylinder, first express the diameter of the cylinder in terms of theheight, and then express the height in terms of the volume of the cylinder.The volume of a right circular cylinder is given by , where is the radius of the circular base of the cylinder and is the height of the cylinder. Since the diameter and height are equal, . Thus . Substitute the expression for in the volume formula to eliminate :. Solving for gives . Since the volume of the cylinder is , theheight of the cylinder is .13Your answer Omitted!If ,then(A)(B)(C)(D)(E)ExplanationDifficulty: MediumThe correct answer is E.One way to determine the value of is to apply the sine of difference of two angles identity: . Since and , the identity gives . Therefore, .Another way to determine the value of is to apply the supplementary angle trigonometric identity for the sine: . Therefore, .14Your answer Omitted!A line has parametric equations and , where is the parameter. The slope of the line is(A)(B)(C)(D)(E)ExplanationDifficulty: MediumThe correct answer is B.One way to determine the slope of the line is to compute two points on the line and then use the slope formula. For example, letting gives the point on the line, and letting gives the point on the line. Therefore, the slope of the line is equal to .Alternatively, one can express in terms of . Since and , it follows that . Therefore, the slope of the line is .15Your answer Omitted!What is the range of the function defined by ?(A) All real numbers(B) All real numbers except(C) All real numbers except(D) All real numbers except(E) All real numbers between andExplanationDifficulty: MediumThe correct answer is D.The range of the function defined by is the set of such thatfor some .One way to determine the range of the function defined by is to solve the equation for and then determine which correspond to at least one . To solve for , first subtract from both sides to get and then take the reciprocal of both sides to get . The equation shows that for anyother than , there is an such that , and that there is no such for . Therefore, the range of the function defined by is all real numbers except .Alternatively, one can reason about the possible values of the term . The expression can take on any value except , so the expression can take on any value except . Therefore, the range of the function defined by is all real numbers except .16Your answer Omitted!The table above shows the number of digital cameras that were sold during a three-day sale. The prices of models , , and were , , and , respectively. Which of the following matrix representations gives the total income, in dollars, received from the sale of the cameras for each of the three days?(A)(B)(C)(D)(E)ExplanationDifficulty: MediumThe correct answer is C.A correct matrix representation must have exactly three entries, each of which represents the total income, in dollars, for one of the three days. The total income for Day is given by the arithmetic expression , which is the single entry of the matrix product; in the same way, the total income for Day is given by, the single entry of ; and the total income for Day is given by , the single entry of. Therefore, the matrix representationgives the total income, in dollars, received from the sale of the cameras for each of the three days. Although it is not necessary to compute the matrix product in order to answer the question correctly, equals .17Your answer Omitted!The right circular cone above is sliced horizontally forming two pieces, each of which has the sameheight. What is the ratio of the volume of the smaller piece to the volume of the larger piece?(A)(B)(C)(D)(E)ExplanationDifficulty: HardIt is helpful to label the figure.The top piece is a cone whose height is one-half the height of the original cone . Using the properties of similar right triangles, you should realize the radii of these two cones must be in the same ratio. So if the top cone has radius , the original cone has radius .The volume of the top piece is equal to . The volume of the bottom piece is equal to the volume of the original cone minus the volume of the top piece.The ratio of the volume of the smaller piece to the volume of the larger piece is .18Your answer Omitted!In the figure above, is a regular pentagon with side of length . What is the -coordinate of ?(A)(B)(C)(D)(E)ExplanationDifficulty: HardThe sum of the measures of the interior angles of a regular pentagon is equal to . Each interior angle has a measure of . Using supplementary angles, has a measure of . You can use right triangle trigonometry to find the -coordinate of point .Since , is about . Since the length of each side of the pentagon is , the -coordinate of point is . Putting the information together tells us that the -coordinate of point is . The correct answer is (B).19Your answer Omitted!For a class test, the mean score was , the median score was , and the standard deviation of the scores was . The teacher decided to add points to each score due to a grading error. Which of the following statements must be true for the new scores?I. The new mean score is .II. The new median score is .III. The new standard deviation of the scores is .(A) None(B) only(C) only(D) and only(E) , , andExplanationDifficulty: HardFor this type of question you need to evaluate each statement separately. Statement is true. If you add to each number in a data set, the mean will also increase by . Statement is also true. The relative position of each score will remain the same. Thus, the new median score will be equal to more than the old median score. Statement is false. Since each new score is more than the old score, the spread of the scores and the position of the scores relative to the mean remain the same. Thus, the standard deviation of the new scores is the same as the standard deviation of the old scores.20Your answer Omitted!A game has two spinners. For the first spinner, the probability of landing on blue is . Independently, for the second spinner, the probability of landing on blue is What is the probability that the first spinner lands on blue and the second spinner does not land on blue?(A)(B)(C)(D)(E)ExplanationDifficulty: HardSince the two events are independent, the probability that the first spinner lands on blue and the second spinner does not land on blue is the product of the two probabilities. The first probability is given. Since the probability that the second spinner lands on blue is the probability that thesecond spinner does not land on blue is Therefore, . The correct answer is (E).21Your answer Omitted!In January the world’s population was billion. Assuming a growth rate of percent per year, the world’s population, in billions, for years after can be modeled by theequation . According to the model, the population growth from January to January was(A)(B)(C)(D)(E)ExplanationDifficulty: HardThe correct answer is C.According to the model, the world’s population in January was and in January was . Therefore, according to the model, the population growth from January to January , in billions, was , or equivalently,.22Your answer Omitted!What is the measure of one of the larger angles of a parallelogram in the that has vertices with coordinates , , and ?(A)(B)(C)(D)(E)ExplanationDifficulty: HardThe correct answer is C.First, note that the angle of the parallelogram with vertex is one of the two larger angles of the parallelogram: Looking at the graph of the parallelogram in the makes this apparent. Alternatively, the sides of the angle of the parallelogram with vertex are a horizontal line segment with endpoints and and a line segment of positive slope with endpoints and that intersects the horizontal line segment at its left endpoint , so the angle must measure more than Since the sum of the measures of the four angles of aparallelogram equals , the angle with vertex must be one of the larger angles.One way to determine the measure of the angle of the parallelogram with vertex is to apply the Law of Cosines to the triangle with vertices , , and . The length of the two sides of the angle with vertex are and; the length of the side opposite the angle is . Let represent the angle with vertex and apply the Law of Cosines: , so. Therefore, the measure of one of the larger angles of the parallelogram is .Another way to determine the measure of the angle of the parallelogram with vertex is to consider the triangle , , and . The measure of the angle of this triangle with vertex is less than the measure of the angle of the parallelogram with vertex . The angle of the triangle has opposite side of length and adjacent side of length , so the measure of this angle is . Therefore, the measure of the angle of the parallelogram withvertex is .Yet another way to determine the measure of the angle of the parallelogram with vertex is to use trigonometric relationships to find the measure of one of the smaller angles, and then use the fact that each pair of a larger and smaller angle is a pair of supplementary angles. Consider the angle of the parallelogram with vertex ; this angle coincides with the angle at vertex of the right triangle with vertices at , , and , with opposite side of lengthand adjacent side of length , so the measure of this angle is . This angle, together with the angle of the parallelogram with vertex , form a pair of interior angles on the same side of a transversal that intersects parallel lines, so the sum of the measures of the pair of angles equals . Therefore, the measure of the angle of the parallelogram with vertex is.23Your answer Omitted!For some real number , the first three terms of an arithmetic sequence are, and . What is the numerical value of the fourth term?(A)(B)(C)(D)(E)ExplanationDifficulty: HardThe correct answer is E.To determine the numerical value of the fourth term, first determine the value of and then apply the common difference.Since , and are the first three terms of an arithmetic sequence, it must be true that, that is, Solving for gives . Substituting for in the expressions of the three first terms of the sequence, one sees that they are , , and , respectively. The common difference between consecutive terms for this arithmetic sequence is , and therefore, the fourth term is .24Your answer Omitted!In a group of people, percent have brown eyes. Two people are to be selected at random from the group. What is the probability that neither person selected will have brown eyes?(A)(B)(C)(D)(E)ExplanationDifficulty: HardThe correct answer is A.One way to determine the probability that neither person selected will have brown eyes is to count both the number of ways to choose two people at random from the people who do not have brown eyes and the number of ways to choose two people at random from all people, and then compute the ratio of those two numbers.Since percent of the people have brown eyes, there are people with brown eyes, and people who do not have brown eyes. The number of ways of choosing two people, neither of whom has brown eyes, is : there are ways to choose a first person and ways to choose a second person, but there are ways in which that same pair of people could be chosen. Similarly, the number of ways of choosing two people at random from the people is . Therefore, the probability that neither of the two people selected has brown eyes is.Another way to determine the probability that neither person selected will have brown eyes is to multiply the probability of choosing one of the people who does not have brown eyes at random from the people times the probability of choosing one of the people who does not have brown eyes at random from the remaining people after one of the people who does not have brown eyes has been chosen.Since percent of the people have brown eyes, the probability of choosing one of the people who does not have brown eyes at random from the people is . If one of the people who does not have brown eyes has been chosen, there remain people who do not have brown eyes out of a total of people; the probability of choosing one of the people who does not have brown eyes at random from the people is . Therefore, if two people are to be selected from the group at random, the probability that neither person selected will have brown eyes is .25Your answer Omitted!If , what is ?(A)(B)(C)(D)(E)ExplanationDifficulty: HardThe correct answer is E.One way to determine the value of is to solve the equation for . Since , start with the equation , and cube both sides to get. Isolate to get , and apply the cube root to both sides of the equation to get .Another way to determine the value of is to find a formula for and then evaluate at Let and solve for : cubing both sides gives , so , and. Therefore, , and .26Your answer Omitted!Which of the following equations best models the data in the table above?(A)(B)(C)(D)(E)ExplanationDifficulty: HardThe correct answer is D.One way to determine which of the equations best models the data in the table is to use a calculator that has a statistics mode to compute an exponential regression for the data.The specific steps to be followed depend on the model of calculator, but can be summarized as follows: Enter the statistics mode, edit the list of ordered pairs to include only the four points givenin the table and perform an exponential regression. The coefficients are, approximately, for the constant and for the base, which indicates that the exponential equation is the result of performing the exponential regression. If the calculator reports a correlation, it should be a number that is very close , to which indicates that the data very closely matches the exponential equation. Therefore, of the given models, best fits the data.Alternatively, without using a calculator that has a statistics mode, one can reason about the data given in the table.The data indicates that as increases, increases; thus, options A and B cannot be candidates for such a relationship. Evaluating options C, D and E at shows that option D is the one that gives a value of that is closest to In the same way, evaluating options C, D and E at each of the other given data points shows that option D is a better model for that one data point than either option C or option E. Therefore, is the best of the given models for the data.27Your answer Omitted!The linear regression model above is based on an analysis of nutritional data from 14 varieties of cereal bars to relate the percent of calories from fat to the percent of calories from carbohydrates . Based on this model, which of the following statements must be true?I. There is a positive correlation between and .II. When percent of calories are from fat, the predicted percent of calories from carbohydrates is approximately .III. The slope indicates that as increases by , decreases by .(A) II only(B) I and II only(C) I and III only(D) II and III only(E) I, II, and IIIExplanationDifficulty: HardThe correct answer is D.Statement I is false: Since , high values of are associated with low values of which indicates that there is a negative correlation between and .Statement II is true: When percent of calories are from fat, and the predicted percent of calories from carbohydrates is .Statement III is true: Since the slope of the regression line is , as increases by , increases by ; that is, decreases by .28Your answer Omitted!The number of hours of daylight, , in Hartsville can be modeled by , where is the number of days after March . The day with the greatest number of hours of daylight has how many more daylight hours than May ? (March and May have days each. April and June have days each.)(A) hr(B) hr(C) hr(D) hr(E) hrExplanationDifficulty: HardThe correct answer is A.To determine how many more daylight hours the day with the greatest number of hours of daylight has than May , find the maximum number of daylight hours possible for any day and then subtract from that the number of daylight hours for May .To find the greatest number of daylight hours possible for any day, notice that the expressionis maximized when , which corresponds to , so. However, for this problem, must be a whole number, as it represents a count of days after March . From the shape of the graph of the sine function, either or corresponds to the day with the greatest number of hours of daylight, and since, the expression is maximized when days after March . (It is not required to find the day on which the greatest number of hours of daylight occurs, but it is days after March ,that is, June .)Since May is days after March , the number of hours of daylight for May is .Therefore, the day with the greatest number of hours of daylight hasmore daylight hours than May .。
定量分析实验室项目课程介绍
定量分析实验室项目课程介绍
1、回归分析(Linear Regression Analysis):
教师:Yu Xie(谢宇),美国密歇根大学社会学系教授。
时间:2007年7月16日至8月10日
课时:48学时。
课程内容:简介线性代数,以矩阵形式温习线性回归模型。
主要讲授线性回归在社会科学研究中的应用,并介绍通径分析、纵贯数据分析、对二分类因变量的logit 分析。
本课程将结合STATA统计软件的应用。
该课程为本实验室开设系列方法课程的必修课之一。
2、分层线性模型(Hierarchical Linear Model):
教师:Stephen Raudenbush,美国芝加哥大学社会学系教授
时间:2007年8月13日至8月31日
课时:48学时。
课程内容:介绍分层数据结构与分层模型的基本原理,通过大量纵贯数据和分层数据的分析实例来示范分层模型在社会科学研究中的应用。
课程从两层分析模型入手,然后扩展到三层模型(包括个体重复测量分析),并介绍对潜在变量和交互分组数据的分层分析。
本课程将结合HLM统计软件的应用。
希尔伯特空间

希尔伯特空间在数学中,希尔伯特空间(以大卫·希尔伯特命名)允许将线性代数和微积分的方法从二维和三维欧几里得空间推广到可能具有无限维数的空间。
希尔伯特空间是一个具有内积运算的向量空间,它允许定义距离函数和垂直度(称为正交性)。
此外,对于这个距离,希尔伯特空间是完备的,这意味着空间中有足够的限制,可以使用微积分技术。
希尔伯特空间在数学和物理中自然而频繁地出现,典型的是无穷维函数空间。
在偏微分方程、量子力学、傅立叶分析(包括信号处理和传热的应用)和遍历理论(形成热力学的数学基础)中,它们是不可或缺的工具。
约翰·冯·诺伊曼创造了希尔伯特空间这个术语,用来描述这些不同应用的抽象概念。
希尔伯特空间方法的成功开创了一个非常富有成果的泛函分析时代。
除了经典的欧几里得空间外,希尔伯特空间的例子还包括平方可积函数空间、序列空间、由广义函数组成的索伯列夫空间和全纯函数的哈代空间。
几何直觉在希尔伯特空间理论的许多方面都起着重要的作用。
毕达哥拉斯定理和平行四边形定律在希尔伯特空间中有确切的类比。
在更深层次上,在子空间上的垂直投影在优化问题和理论的其他方面起着重要的作用。
希尔伯特空间理论是代数、拓扑和几何的融合。
在这个意义上,代数和几何之间的“相互作用”是相当平滑的。
不过,只要考虑到无限维线性空间,情况就会发生变化,这也是拓扑学出现的地方。
对于无限维线性空间,所有的线性算子都是连续的,算子的收敛具有单一的含义,任何线性空间都与它的双重对偶自然同构,而且封闭单位球是紧凑的。
这些便利条件在无限维的情况下并不存在。
虽然基数确实存在,但其存在的证明是非结构性的,而且往往不能明确地给出基数。
因此,依靠坐标和矩阵的技术通常是不合适的。
线性算子不一定是连续的,事实上,许多感兴趣的线性算子都不是连续的。
由两个线性空间之间的所有线性算子组成的空间带有两种不同的拓扑结构,因此也有两种不同的收敛概念。
对偶空间的正确概念是所有连续线性算子进入地五十度的空间,即使如此,原空间也只嵌入其双重对偶中。
希尔伯特空间入门
希尔伯特空间入门希尔伯特空间是数学中的一个重要概念,它是由德国数学家希尔伯特在20世纪初提出的。
希尔伯特空间是一种具有内积的完备线性空间,它在数学分析、量子力学等领域中有着广泛的应用。
本文将介绍希尔伯特空间的基本概念、性质以及一些常见的例子。
一、希尔伯特空间的定义希尔伯特空间是一个向量空间,它具有内积的结构。
设H是一个实数域或复数域上的向量空间,如果在H上定义了一个满足以下条件的二元运算(内积)<x, y>,则称H为希尔伯特空间:1. 对于任意的x, y∈H,有<x, y>=<y, x>(对称性);2. 对于任意的x, y, z∈H和任意的实数a,有<a*x+y, z>=a<x,z>+<y, z>(线性性);3. 对于任意的x∈H,有<x, x>≥0,并且当且仅当x=0时,<x, x>=0(正定性)。
二、希尔伯特空间的性质1. 希尔伯特空间是一个完备的度量空间。
这意味着在希尔伯特空间中,任意一个柯西序列都收敛于该空间中的一个元素。
2. 希尔伯特空间中的范数可以由内积来定义。
对于任意的x∈H,定义||x||=√<x, x>,则||x||是H上的一个范数。
3. 希尔伯特空间中的向量可以进行正交分解。
设H是一个希尔伯特空间,x, y∈H,如果<x, y>=0,则称x和y是正交的。
4. 希尔伯特空间中的向量可以进行投影分解。
设H是一个希尔伯特空间,x, y∈H,如果y是x的一个投影,则y是x在H上的正交投影。
三、希尔伯特空间的例子1. 有限维希尔伯特空间:设V是一个n维向量空间,定义内积为<x, y>=x1y1+x2y2+...+xnyn,则V是一个希尔伯特空间。
2. L2空间:L2空间是所有平方可积函数的集合,定义内积为<f,g>=∫f(x)g(x)dx,则L2空间是一个希尔伯特空间。
函数分析中的Hilbert空间和Banach空间

函数分析是现代数学的一个重要分支,它研究的是函数空间及其中函数的性质。
在函数分析中,Hilbert空间和Banach空间是两个非常重要的概念。
本文将介绍Hilbert空间和Banach空间的定义及其在函数分析中的应用。
首先,让我们来了解一下Hilbert空间。
Hilbert空间是由一个内积所赋予的完备性质的向量空间。
对于一个Hilbert空间,我们可以定义内积运算,并且该向量空间在内积的度量下是完备的,也就是说,任一柯西序列都有极限。
Hilbert空间的内积具有线性性、对称性和正定性等性质,同时满足柯西-施瓦茨不等式和三角不等式。
经典的例子包括欧几里得空间,即n维实数向量空间R^n。
Hilbert空间在函数分析中有着广泛的应用。
例如,存在一个重要的表示定理,称为Reisz表示定理,它指出每一个有界线性泛函都可以用内积表示。
这个定理在函数分析的研究中起到了关键的作用,为研究函数空间中的函数提供了重要的工具。
接下来,让我们来了解一下Banach空间。
Banach空间是一个完备的赋范向量空间,也就是说该向量空间中的每一个柯西序列都有极限。
与Hilbert空间不同的是,Banach空间中没有内积结构,而是通过范数来定义空间中向量的大小。
范数具有非负性、齐次性和三角不等式等性质。
经典的例子包括连续函数空间C[0,1]和Lp空间。
Banach空间在函数分析中也有着重要的应用。
特别是在函数空间的研究中,Banach空间提供了非常有力的解析工具。
例如,通过引入范数的概念,我们可以定义连续函数的收敛性和一致连续性,并研究它们的性质。
此外,Banach空间上的算子理论也是函数分析中的重要研究内容,它包括线性算子、有界算子、紧算子等的定义和性质。
总结起来,Hilbert空间和Banach空间是函数分析中两个非常重要的概念。
Hilbert空间通过内积结构提供了一种自然的度量方式,并且有着重要的表示定理。
而Banach空间则通过范数结构定义了向量的大小,并且在函数空间的研究中起到了关键作用。
面板空间计量之Stata应用

面板空间计量之Stata应用:学习笔记【同舟共济】更新于2016年4月20日说明目前,在空间计量方面,Stata官方命令语句数量有限且较为零散,尚未形成系统的空间计量工具包。
因此,个人建议空间计量的初学者转向Matlab软件,James P. LeSage、J. P. Elhorst、Donald J. Lacombe等学者所开发的空间计量工具包,其功能相对更加完善,操作起来也比较方便。
本人已经习惯了使用stata,初次自学空间计量方面的操作,参考help文件及相关文献,在学习过程中做了简要总结,仅供初学者交流学习。
其中若有不当之处,敬请批评指正,谢谢!E-mail: ares0825@【Stata】Abd Elmessih Shehata (Econpapers)URL: /RAS/psh494.htmFederico Belotti (Econpapers)URL: /RAS/pbe427.htmP. Wilner Jeanty (Econpapers)URL:/RAS/pje95.htmMaurizio PisatiURL:/people/maurizio-pisatiYihua Yu (Econpapers)URL:/RAS/pyu79.htm目录第一章Stata空间计量命令语句安装 1 第二章中国31省市自治区(不含港澳台、附属岛屿)shp制作 3 第三章Stata空间权重制作8 第四章Stata 空间相关性检验27 第五章Stata 空间面板数据回归39面板空间计量之Stata应用:学习笔记第一章Stata空间计量命令包安装更新于2016-03-151.空间计量-Stata命令包Archive of user-written Stata packagesURL: /statistics/stata-blog/stata-programming/ssc_stata_package_list.php图1 Stata用户自拟命令语句列表另外,在IDEAS(URL: https:///)中可以查询相关命令,顺便推荐几个论坛,大家可以经常逛逛:Stata官方论坛URL: /UCLA-Idre论坛URL: /stat/stata/Stata Daily URL: /index/2.安装单击图1左侧红色框内命令名称,即可下载对应的压缩包,安装过程参考非官方命令手动安装说明(URL:/thread-2420580-1-1.html);单击图1右侧蓝色框内的各命令所对应的描述性语句,即可看到该命令的详细说明及应用举例。
内积空间和希尔伯特(Hilbert)空间

内积空间是希尔伯特空间的特例
完备的内积空间具有完备的几何结构,使得向量可以 按照内积进行长度和角度的度量,并且存在一个完备 的基底来表示空间中的任意向量。
内积空间是一个具有内积运算的线性空间,其满足正 定性、对称性和线性等性质。希尔伯特空间是内积空 间的特殊情况,它是一个完备的内积空间。
希尔伯特空间是内积空间的推广
Annual Work Summary Report
2021
2022
2023
目录
Байду номын сангаас
O1
引言
coOnte2nts
内积空间的基 本性质
O3
希尔伯特空间 的基本性质
O4
内积空间与希 尔伯特空间的 关系
O5
希尔伯特空间 的几何解释
O6
希尔伯特空间 的应用
#O1
引言
#2022
什么是内积空间
内积运算用于计算向量之间的角度和长度,是线性 代数和泛函分析中的基本概念。 内积空间是一个向量空间,其中定义了一个内积运 算,满足非负性、正交性、对称性和三角不等式等 性质。
希尔伯特空间的例子
$L^2$空间
01
函数空间,其元素是平方可积函数,通常用于描述物理系统的
状态。
$L^2$空间的子空间
02
例如,$L^2(0,1)$的闭子空间,通常用于描述量子力学中的束
缚态。
有限维空间
03
例如,$R^n$(实数向量空间),其具有有限个维度。
#O4
内积空间与希尔 伯特空间的关系
#2022
描述算子
在量子力学中,概率幅可以通过希尔伯 特空间中的内积计算。
计算概率幅
在信号处理和图像处理中的应用
地理信息系统 第二章 从现实世界到比特世界
我们借助于外感官(我们意识的一种性质)表象给我们自己外面的对象,这些对象毫无例外的在空间里面。
这些对象的形状、大小、以及它们相互间的关系是在空间里被规定的或能够在空间里被规定的。
空间不是一个从外部经验得来的经验概念。
因为为使着某种感觉与我以外的某些东西发生关系,以及同样地为着我能把那些感觉表象为互相在外、互相靠近,从而不只是彼此不同,并且是在不同的地方,这样就一定要以空间观念为前提。
康德第二章从现实世界到比特世界导读:本章从空间认知的角度讲述了对现实世界进行抽象的过程。
空间认知属于行为地理学的范畴,它研究个体如何对现实世界进行认知,并在意识中编码的过程。
在认识的基础上进行逐步抽象,最后得到数字化的空间数据,这正是OpenGIS九层抽象模型前五层所描述的内容。
最后是空间数据库模型,进一步强调了该抽象过程。
本章的内容有助于加深对空间数据和空间信息的理解。
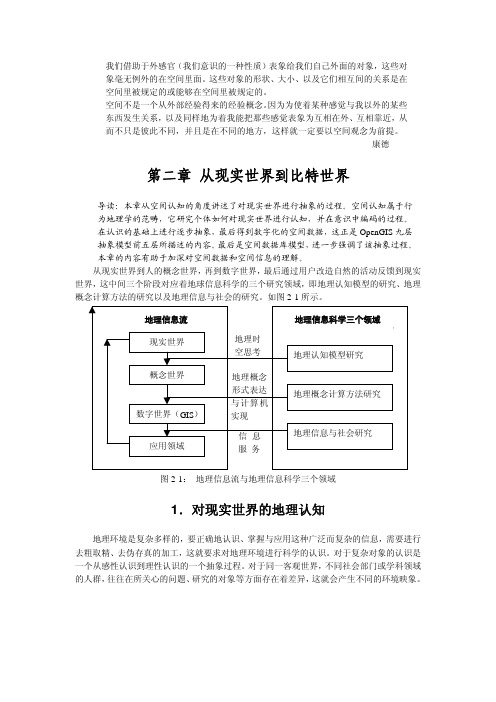
从现实世界到人的概念世界,再到数字世界,最后通过用户改造自然的活动反馈到现实世界,这中间三个阶段对应着地球信息科学的三个研究领域,即地理认知模型的研究、地理概念计算方法的研究以及地理信息与社会的研究。
如图2-1所示。
图2-1:地理信息流与地理信息科学三个领域1.对现实世界的地理认知地理环境是复杂多样的,要正确地认识、掌握与应用这种广泛而复杂的信息,需要进行去粗取精、去伪存真的加工,这就要求对地理环境进行科学的认识。
对于复杂对象的认识是一个从感性认识到理性认识的一个抽象过程。
对于同一客观世界,不同社会部门或学科领域的人群,往往在所关心的问题、研究的对象等方面存在着差异,这就会产生不同的环境映象。
1.1认知的含义认知属于心理学的范畴。
认知理论早在70年代就被引入地图学,并用“刺激——反应”的关系模式来研究用图者在读图时的心理——物理反应。
始于90年代的地图制图可视化研究也应用了认知概念,使“刺激——反应”模式的研究向纵深推进了一步,地图制图可视化的实质是探讨地图信息传输过程中人对空间客体的认识。
- 1、下载文档前请自行甄别文档内容的完整性,平台不提供额外的编辑、内容补充、找答案等附加服务。
- 2、"仅部分预览"的文档,不可在线预览部分如存在完整性等问题,可反馈申请退款(可完整预览的文档不适用该条件!)。
- 3、如文档侵犯您的权益,请联系客服反馈,我们会尽快为您处理(人工客服工作时间:9:00-18:30)。
Yuri M. Zhukov (IQSS, Harvard University)
Applied Spatial Statistics in R, Section 2
January 16, 2010
8/1
Spatial Autocorrelation
Global autocorrelation: Join Counts
The expected counts of each type of join are: E[BB ] = 1 2
2 wij PB i j
E[WW ] =
1 2
wij (1 − PB )2
i j
1 E[BW ] = 2
wij 2PB (1 − PB )
i j
Where 1 i j wij is the total number of joins (of any type) on a 2 map, assuming a binary connectivity matrix. The observed counts are: 1 1 wij yi yj WW = wij (1 − yi )(1 − yj ) BB = 2 2
i j i j
wij (yi − yj )2
i (yi
wij )
−y ¯ )2
where yi is the value of a variable for the i th observation, y ¯ is the sample mean and wij is the spatial weight of the connection between i and j . Values range from 0 (perfect correlation) to 2 (perfect dispersion). A value of 1 indicates a random spatial pattern.
wij
j
January 16, 2010 5/1 Applied Spatial Statistics in R, Section 2
Spatial Autocorrelation
Global autocorrelation: Geary’s C
The Geary’s C uses the sum of squared differences between pairs of data values as its measure of covariation. C= (n − 1) 2(
The Moran’s I coefficient calculates the ratio between the product of the variable of interest and its spatial lag, with the product of the variable of interest, adjusted for the spatial weights used. I= n
Applied Spatial Statistics in R, Section 2
Spatial Autocorrelation
Yuri M. Zhukov
IQSS, Harvard University
January 16, 2010
Yuri M. Zhukov (IQSS, Harvard University)
The probabilities of BB and WW in two adjacent cells are
2 PBB = PB PB = PB
PWW = (1 − PB )(1 − PB ) = (1 − PB )2
The probability of BW in two adjacent cells is PBW = PB (1 − PB ) + (1 − PB )PB = 2PB (1 − PB )
positive spatial autocorrelation (clustering) if the number of BW joins is significantly lower than what we would expect by chance, negative spatial autocorrelation (dispersion) if the number of BW joins is significantly higher than what we would expect by chance, null spatial autocorrelation (random pattern) if the number of BW joins is approximately the same as what we would expect by chance.
n i =1 n j =1 wij n i =1 n ¯ )(yj j =1 wij (yi − y n ¯ )2 i =1 (yi − y
−y ¯)
where yi is the value of a variable for the i th observation, y ¯ is the sample mean and wij is the spatial weight of the connection between i and j . Values range from –1 (perfect dispersion) to +1 (perfect correlation). A zero value indicates a random spatial pattern. Under the null hypothesis of no autocorrelation, E[I ] =
Models for continuous dependent variables Models for categorical dependent variables Spatiotemporal models
Yuri M. Zhukov (IQSS, Harvard University)
Applied Spatial Statistics in R, Section 2
i j
−n
i
(
j i (yi
wij +
j
wji )2 + 3(
i j
wij )2
s2 = s3 =
n −1 (n−1 1 2
− ¯)2 )2 i (yi − x (wij + wji )2 − 2n
j 2
x ¯ )4
i
1 2
(wij + wji )2
i j
+6
i
Yuri M. Zhukov (IQSS, Harvard University)
January 16, 2010
2/1Leabharlann Spatial Autocorrelation
What is Spatial Autocorrelation?
Spatial autocorrelation measures the degree to which a phenomenon of interest is correlated to itself in space (Cliff and Ord 1973, 1981). Tests of spatial autocorrelation examine whether the observed value of a variable at one location is independent of values of that variable at neighboring locations. Positive spatial autocorrelation indicates that similar values appear close to each other, or cluster, in space Negative spatial autocorrelation indicates that neighboring values are dissimilar or, equivalenty, that similar values are dispersed. Null spatial autocorrelation indicates that the spatial pattern is random.
Yuri M. Zhukov (IQSS, Harvard University)
Applied Spatial Statistics in R, Section 2
January 16, 2010
7/1
Spatial Autocorrelation
Global autocorrelation: Join Counts
2
Spatial Data and Basic Visualization in R
Points Polygons Grids
3 4 5 6 7
Spatial Autocorrelation Spatial Weights Point Processes Geostatistics Spatial Regression
When the variable of interest is categorical, a join count analysis can be used to assess the degree of clustering or dispersion. A binary variable is mapped in two colors (Black & White), such that a join, or edge, is classified as either WW (0-0), BB (1-1), or BW (1-0). Join count statistics can show