aix磁盘性能调优-3
优化AIX 7磁盘性能 第三部分用 ioo+filemon+fileplace+JFS+JFS2 进行调优
优化AIX 7磁盘性能第三部分用 ioo+filemon+fileplace+JFS+JFS2 进行调优关于本系列本系列共有三篇文章(见 参考资料),介绍 AIX® 磁盘和 I/O 子系统,重点关注在优化磁盘 I/O 性能时遇到的各种挑战。
尽管磁盘调优很可能没有 CPU 或者内存优化那么激动人心,但它是优化服务器性能的关键方面。
事实上,部分原因是因为磁盘 I/O 是最薄弱的子系统环节,与任何其他子系统相比,可以通过更多的措施提高磁盘 I/O 性能。
简介本系列的 第 1 部分 和 第 2 部分 讨论了设计系统架构的重要性,它对整体系统性能的影响,以及一个新的 I/O 优化工具 lvmo,可以使用该工具对逻辑卷进行调优。
在这个部分中,将研究如何使用 ioo 命令优化系统,该命令可以对大多数 I/O 调优参数进行配置,显示所有 I/O 调优参数的当前值或下一次启动值。
还将学习如何以及何时使用 filemon 和 fileplace 工具。
通过使用增强型日志文件系统(AIX 中的默认文件系统),提高整体文件系统性能、优化文件系统以及让 JFS2 产生最好的性能,这些都是调优技术的重要部分。
甚至还将研究一些可能影响性能的文件系统属性,比如顺序访问和随机访问。
文件系统概述本节讨论 JFS2、文件系统性能以及对 JFS 所做的特定性能改进。
正如您所知道的,在 AIX 中有两种类型的内核。
它们是 32 位内核和 64 位内核。
尽管它们共享一些共同的库、大多数的命令及实用工具,但了解它们的区别以及内核与整体性能调优之间的关系是非常重要的。
JFS2 针对 64 位内核进行了优化,而 JFS 则针对 32 位内核进行了优化。
尽管日志文件系统可以提供更高的安全性,但在以前往往会带来性能方面的开销。
在更重视性能(以牺牲可用性为代价)的情况下,可能会禁用元数据日志记录功能以提高 JFS 的性能。
对于 JFS2,也可以通过禁用日志记录(在 AIX 6.1 和更高版本中)帮助提高性能。
浅议AIX操作系统下应用系统的维护与性能优化
浅议AIX操作系统下应用系统的维护与性能优化摘要:AIX操作系统作为一种高可靠、高性能的操作系统,被广泛应用于金融、电信、制造等行业的服务器系统上。
本文将针对在AIX操作系统下应用系统的维护与性能优化进行论述。
首先,介绍了AIX操作系统的特点以及应用程序在其中的调度方式,并探讨了应用程序在AIX操作系统下的常见问题。
然后,从操作系统级别、网络级别以及应用程序级别三个方面着手对AIX操作系统下应用系统的维护进行了深入阐述。
最后,针对AIX操作系统下应用系统的性能优化,提出了基于硬件、操作系统和应用程序三个方面的优化措施。
关键词:AIX操作系统、应用系统维护、性能优化、调度方式、优化措施正文:一、AIX操作系统的特点及应用程序的调度方式AIX操作系统是IBM公司推出的一种商业级别的UNIX操作系统。
它具有高可靠性、高性能、高伸缩性、高安全性等特点,被广泛应用于金融、电信、制造等行业的服务器系统上。
在AIX操作系统下,应用程序的调度方式是通过进程、线程进行的。
进程是AIX操作系统中的一种资源分配单位,而线程是进程中最小的调度单位。
应用程序启动后,操作系统会为其分配进程和线程资源,并通过在进程和线程之间的切换,协调应用程序的运行。
在AIX操作系统下,应用程序存在着一些常见问题,如进程、线程崩溃、进程池资源泄露以及线程饥饿等。
这些问题通常是由于操作系统或应用程序自身的问题引起的,因此,对于AIX操作系统下的应用系统,维护和优化至关重要。
二、AIX操作系统下应用系统的维护(一)操作系统级别的维护在AIX操作系统下,进行操作系统级别的维护是确保应用系统稳定、高效运行的关键。
操作系统级别的维护主要包括以下方面:1、定期扫描安全漏洞,防范恶意攻击;2、定期进行操作系统补丁更新,确保操作系统处于最新状态;3、定期清理系统日志和垃圾文件,释放系统资源;4、定期备份系统数据和应用程序,确保数据安全;5、定期进行系统性能分析和优化,寻找存在的性能瓶颈并及时解决。
AIX 性能调优
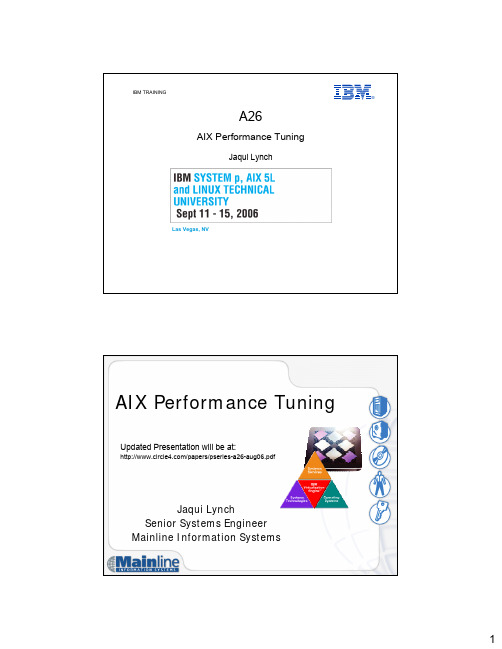
IBM TRAINING®A26AIX Performance TuningJaqui LynchLas Vegas, NVAIX Performance TuningUpdated Presentation will be at:/papers/pseries-a26-aug06.pdfJaqui LynchSenior Systems EngineerMainline Information SystemsAgenda•AIX v5.2 versus AIX v5.3•32 bit versus 64 bit •Filesystem Types•DIO and CIO•AIX Performance Tunables •Oracle Specifics •Commands•ReferencesNew in AIX 5.2•P5support•JFS2•Large Page support (16mb)•Dynamic LPAR•Small Memory Mode–Better granularity in assignment of memory to LPARs •CuOD•xProfiler•New Performance commands–vmo, ioo, schedo replace schedtune and vmtune •AIX 5.1 Status–Will not run on p5 hardware–Withdrawn from marketing end April 2005–Support withdrawn April 2006AIX 5.3•New in5.3–With Power5 hardware•SMT•Virtual Ethernet•With APV–Shared Ethernet–Virtual SCSI Adapter–Micropartitioning–PLMAIX 5.3•New in5.3–JFS2 Updates•Improved journaling•Extent based allocation•1tb filesystems and files with potential of 4PB•Advanced Accounting•Filesystem shrink for JFS2•Striped Columns–Can extend striped LV if a disk fills up•1024 disk scalable volume group–1024 PVs, 4096 LVs, 2M pps/vg•Quotas•Each VG now has its own tunable pbuf pool–Use lvmo commandAIX 5.3•New in5.3–NFSv4 Changes•ACLs–NIM enhancements•Security•Highly available NIM•Post install configuration of Etherchannel and Virtual IP –SUMA patch tool–Last version to support 32 bit kernel–MP kernel even on a UP–Most commands changed to support LPAR stats–Forced move from vmtune to ioo and vmo–Page space scrubbing–Plus lots and lots of other things32 bit versus 64 bit•32 Bit•Up to 96GB memory •Uses JFS for rootvg •Runs on 32 or 64 bit hardware •Hardware all defaults to 32 bit•JFS is optimized for 32 bit• 5.3 is last version of AIX with 32 bit kernel •64 bit•Allows > 96GB memory •Current max is 256GB (arch is 16TB) except 590/595 (1TB & 2TB)•Uses JFS2 for rootvg •Supports 32 and 64 bit apps•JFS2 is optimized for 64 bitFilesystem Types•JFS•2gb file max unless BF •Can use with DIO •Optimized for 32 bit •Runs on 32 bit or 64 bit •Better for lots of small file creates and deletes •JFS2•Optimized for 64 bit •Required for CIO •Can use DIO•Allows larger file sizes •Runs on 32 bit or 64 bit •Better for large files and filesystemsGPFSClustered filesystemUse for RACSimilar to CIO –noncached, nonblocking I/ODIO and CIO•DIO–Direct I/O–Around since AIX v5.1–Used with JFS–CIO is built on it–Effectively bypasses filesystem caching to bring data directlyinto application buffers–Does not like compressed JFS or BF (lfe) filesystems•Performance will suffer due to requirement for 128kb I/O –Reduces CPU and eliminates overhead copying data twice–Reads are synchronous–Bypasses filesystem readahead–Inode locks still used–Benefits heavily random access workloadsDIO and CIO•CIO–Concurrent I/O–Only available in JFS2–Allows performance close to raw devices–Use for Oracle dbf and control files, and online redo logs,not for binaries–No system buffer caching–Designed for apps (such as RDBs) that enforce writeserialization at the app–Allows non-use of inode locks–Implies DIO as well–Benefits heavy update workloads–Not all apps benefit from CIO and DIO –some arebetter with filesystem caching and some are saferthat wayPerformance Tuning•CPU–vmstat, ps, nmon•Network–netstat, nfsstat, no, nfso•I/O–iostat, filemon, ioo, lvmo•Memory–lsps, svmon, vmstat, vmo, iooNew tunables•Old way–Create rc.tune and add to inittab•New way–/etc/tunables•lastboot•lastboot.log•Nextboot–Use –p –o options–ioo–p –o options–vmo–p –o options–no –p –o options–nfso–p –o options–schedo-p –o optionsTuneables1/3•minperm%–Value below which we steal from computational pages -default is 20%–We lower this to something like 5%, depending on workload•Maxperm%–default is 80%–This is a soft limit and affects ALL file pages (including those in maxclient)–Value above which we always steal from persistent–Be careful as this also affects maxclient–We no longer tune this –we use lru_file_repage instead–Reducing maxperm stops file caching affecting programs that are running•maxclient–default is 80%–Must be less than or equal to maxperm–Affects NFS, GPFS and JFS2–Hard limit by default–We no longer tune this –we use lru_file_repage instead•numperm–This is what percent of real memory is currently being used for caching ALL file pages •numclient–This is what percent of real memory is currently being used for caching GPFS, JFS2 and NFS •strict_maxperm–Set to a soft limit by default –leave as is•strict_maxclient–Available at AIX 5.2 ML4–By default it is set to a hard limit–We used to change to a soft limit –now we do notTuneables2/3•maxrandwrt–Random write behind–Default is 0 –try 32–Helps flush writes from memory before syncd runs•syncd runs every 60 seconds but that can be changed–When threshhold reached all new page writes are flushed to disk–Old pages remain till syncd runs•Numclust–Sequential write behind–Number of 16k clusters processed by write behind•J2_maxRandomWrite–Random write behind for JFS2–On a per file basis–Default is 0 –try 32•J2_nPagesPerWriteBehindCluster–Default is 32–Number of pages per cluster for writebehind•J2_nRandomCluster–JFS2 sequential write behind–Distance apart before random is detected•J2_nBufferPerPagerDevice–Minimum filesystem bufstructs for JFS2 –default 512, effective at fs mountTuneables3/3•minpgahead, maxpgahead, J2_minPageReadAhead & J2_maxPageReadAhead–Default min =2 max = 8–Maxfree–minfree>= maxpgahead•lvm_bufcnt–Buffers for raw I/O. Default is 9–Increase if doing large raw I/Os (no jfs)•numfsbufs–Helps write performance for large write sizes–Filesystem buffers•pv_min_pbuf–Pinned buffers to hold JFS I/O requests–Increase if large sequential I/Os to stop I/Os bottlenecking at the LVM–One pbuf is used per sequential I/O request regardless of the number of pages–With AIX v5.3 each VG gets its own set of pbufs–Prior to AIX 5.3 it was a system wide setting•sync_release_ilock–Allow sync to flush all I/O to a file without holding the i-node lock, and then use the i-node lock to do the commit.–Be very careful –this is an advanced parameter•minfree and maxfree–Used to set the values between which AIX will steal pages–maxfree is the number of frames on the free list at which stealing stops (must be >=minfree+8)–minfree is the number used to determine when VMM starts stealing pages to replenish the free list–On a memory pool basis so if 4 pools and minfree=1000 then stealing starts at 4000 pages– 1 LRUD per pool, default pools is 1 per 8 processors•lru_file_repage–Default is 1 –set to 0–Available on >=AIX v5.2 ML5 and v5.3–Means LRUD steals persistent pages unless numperm< minperm•lru_poll_interval–Set to10–Improves responsiveness of the LRUD when it is runningNEW Minfree/maxfree•On a memory pool basis so if 4 pools andminfree=1000 then stealing starts at 4000pages•1 LRUD per pool•Default pools is 1 per 8 processors•Cpu_scale_memp can be used to changememory pools•Try to keep distance between minfree andmaxfree<=1000•Obviously this may differvmstat -v•26279936 memory pages•25220934 lruable pages•7508669 free pages• 4 memory pools•3829840 pinned pages•80.0 maxpin percentage•20.0 minperm percentage•80.0 maxperm percentage•0.3 numperm percentage All filesystem buffers•89337 file pages•0.0 compressed percentage•0 compressed pages•0.1 numclient percentage Client filesystem buffers only•80.0 maxclient percentage•28905 client pages•0 remote pageouts scheduled•280354 pending disk I/Os blocked with no pbuf LVM –pv_min_pbuf •0 paging space I/Os blocked with no psbuf VMM –fixed per page dev •2938 filesystem I/Os blocked with no fsbuf numfsbufs•7911578 client filesystem I/Os blocked with no fsbuf•0 external pager filesystem I/Os blocked with no fsbuf j2_nBufferPerPagerDevice •Totals since boot so look at 2 snapshots 60 seconds apart•pbufs, psbufs and fsbufs are all pinnedno -p -o rfc1323=1no -p -o sb_max=1310720no -p -o tcp_sendspace=262144no -p -o tcp_recvspace=262144no -p -o udp_sendspace=65536no -p -o udp_recvspace=655360nfso -p -o nfs_rfc1323=1nfso -p -o nfs_socketsize=60000nfso -p -o nfs_tcp_socketsize=600000vmo -p -o minperm%=5vmo -p -o minfree=960vmo -p -o maxfree=1088vmo -p -o lru_file_repage=0vmo -p -o lru_poll_interval=10ioo -p -o j2_maxPageReadAhead=128ioo -p -o maxpgahead=16ioo -p -o j2_maxRandomWrite=32ioo -p -o maxrandwrt=32ioo -p -o j2_nBufferPerPagerDevice=1024ioo -p -o pv_min_pbuf=1024ioo -p -o numfsbufs=2048ioo -p -o j2_nPagesPerWriteBehindCluster=32Increase the following if using raw LVMs (default is 9)Ioo –p –o lvm_bufvnt=12Starter Set of tunablesNB please test these before putting intoproduction vmstat -IIGNORE FIRST LINE -average since bootRun vmstat over an interval (i.e. vmstat 2 30)System configuration: lcpu=24 mem=102656MB ent=0kthr memory page faults cpu---------------------------------------------------------------------------r b avm fre re pi po fr sr cy in sy cs us sy id wa pc ec 56 1 18637043 7533530 0 0 0 0 0 0 4298 24564 986698 2 0 0 12.00 100.057 1 18643753 7526811 0 0 0 0 0 0 3867 25124 9130 98 2 0 0 12.00 100.0System configuration: lcpu=8 mem=1024MB ent=0.50kthr memory page faults cpu------------------------------------------------------------------------------r b p avm fre fi fo pi po fr sr in sy cs us sy id wa pc ec1 1 0 170334 968 96 163 0 0 190 511 11 556 662 1 4 90 5 0.03 6.81 1 0 170334 1013 53 85 0 0 107 216 7 268 418 02 92 5 0.02 4.4Pc = physical processors consumed –if using SPPEc = %entitled capacity consumed –if using SPPFre may well be between minfree and maxfreefr:sr ratio 1783:2949 means that for every 1783 pages freed 2949 pages had to be examined. ROT was 1:4 –may need adjustingTo get a 60 second average try: vmstat 60 2Memory and I/O problems•iostat–Look for overloaded disks and adapters•vmstat•vmo and ioo(replace vmtune)•sar•Check placement of JFS and JFS2 filesystems and potentially the logs•Check placement of Oracle or database logs•fileplace and filemon•Asynchronous I/O•Paging•svmon–svmon-G >filename•nmon•Check error logsioo Output•lvm_bufcnt= 9•minpgahead= 2•maxpgahead= 8•maxrandwrt = 32 (default is 0)•numclust= 1•numfsbufs= 186•sync_release_ilock= 0•pd_npages= 65536•pv_min_pbuf= 512•j2_minPageReadAhead = 2•j2_maxPageReadAhead = 8•j2_nBufferPerPagerDevice = 512•j2_nPagesPerWriteBehindCluster = 32•j2_maxRandomWrite = 0•j2_nRandomCluster = 0vmo OutputDEFAULTS maxfree= 128 minfree= 120 minperm% = 20 maxperm% = 80 maxpin% = 80 maxclient% = 80 strict_maxclient = 1 strict_maxperm = 0OFTEN SEEN maxfree= 1088 minfree= 960 minperm% = 10 maxperm% = 30 maxpin% = 80 Maxclient% = 30 strict_maxclient = 0 strict_maxperm = 0numclient and numperm are both 29.9So numclient-numperm=0 aboveMeans filecaching use is probably all JFS2/NFS/GPFSRemember to switch to new method using lru_file_repageiostatIGNORE FIRST LINE -average since bootRun iostat over an interval (i.e. iostat2 30)tty: tin tout avg-cpu: % user % sys % idle % iowait physc% entc0.0 1406.0 93.1 6.9 0.0 0.012.0 100.0Disks: % tm_act Kbps tps Kb_read Kb_wrtn hdisk1 1.0 1.5 3.0 0 3hdisk0 6.5 385.5 19.5 0 771hdisk14 40.5 13004.0 3098.5 12744 13264 hdisk7 21.0 6926.0 271.0 440 13412 hdisk15 50.5 14486.0 3441.5 13936 15036 hdisk17 0.0 0.00.00 0iostat–a AdaptersSystem configuration: lcpu=16 drives=15tty: tin tout avg-cpu: % user % sys % idle % iowait0.4 195.3 21.4 3.3 64.7 10.6Adapter: Kbps tps Kb_read Kb_wrtnfscsi1 5048.8 516.9 1044720428 167866596Disks: % tm_act Kbps tps Kb_read Kb_wrtn hdisk6 23.4 1846.1 195.2 381485286 61892408 hdisk9 13.9 1695.9 163.3 373163554 34143700 hdisk8 14.4 1373.3 144.6 283786186 46044360 hdisk7 1.1 133.5 13.8 628540225786128 Adapter: Kbps tps Kb_read Kb_wrtnfscsi0 4438.6 467.6 980384452 85642468Disks: % tm_act Kbps tps Kb_read Kb_wrtn hdisk5 15.2 1387.4 143.8 304880506 28324064 hdisk2 15.5 1364.4 148.1 302734898 24950680 hdisk3 0.5 81.4 6.8 3515294 16043840 hdisk4 15.8 1605.4 168.8 369253754 16323884 iostat-DExtended Drive Reporthdisk3 xfer: %tm_act bps tps bread bwrtn0.5 29.7K 6.8 15.0K 14.8Kread: rps avgserv minserv maxserv timeouts fails29.3 0.1 0.1784.5 0 0write: wps avgserv minserv maxserv timeouts fails133.6 0.0 0.3 2.1S 0 0 wait: avgtime mintime maxtime avgqsz qfull0.0 0.00.2 0.0 0iostat Otheriostat-A async IOSystem configuration: lcpu=16 drives=15aio: avgc avfc maxg maif maxr avg-cpu: % user % sys % idle % iowait150 0 5652 0 12288 21.4 3.3 64.7 10.6Disks: % tm_act Kbps tps Kb_read Kb_wrtnhdisk6 23.4 1846.1 195.2 381485298 61892856hdisk5 15.2 1387.4 143.8 304880506 28324064hdisk9 13.9 1695.9 163.3 373163558 34144512iostat-m pathsSystem configuration: lcpu=16 drives=15tty: tin tout avg-cpu: % user % sys % idle % iowait0.4 195.3 21.4 3.3 64.7 10.6Disks: % tm_act Kbps tps Kb_read Kb_wrtnhdisk0 1.6 17.0 3.7 1190873 2893501Paths: % tm_act Kbps tps Kb_read Kb_wrtnPath0 1.6 17.0 3.7 1190873 2893501lvmo•lvmo output••vgname= rootvg(default but you can change with –v)•pv_pbuf_count= 256–Pbufs to add when a new disk is added to this VG •total_vg_pbufs= 512–Current total number of pbufs available for the volume group.•max_vg_pbuf_count= 8192–Max pbufs that can be allocated to this VG•pervg_blocked_io_count= 0–No. I/O's blocked due to lack of free pbufs for this VG •global_pbuf_count= 512–Minimum pbufs to add when a new disk is added to a VG •global_blocked_io_count= 46–No. I/O's blocked due to lack of free pbufs for all VGslsps–a(similar to pstat)•Ensure all page datasets the same size although hd6 can be bigger -ensure more page space than memory–Especially if not all page datasets are in rootvg–Rootvg page datasets must be big enough to hold the kernel •Only includes pages allocated (default)•Use lsps-s to get all pages (includes reserved via early allocation (PSALLOC=early)•Use multiple page datasets on multiple disks –Parallelismlsps outputlsps-aPage Space Physical Volume Volume Group Size %Used Active Auto Typepaging05 hdisk9 pagvg01 2072MB 1 yes yes lvpaging04 hdisk5 vgpaging01 504MB 1 yes yes lvpaging02 hdisk4 vgpaging02 168MB 1 yes yes lvpaging01 hdisk3 vgpagine03 168MB 1 yes yes lvpaging00 hdisk2 vgpaging04 168MB 1 yes yes lvhd6 hdisk0 rootvg512MB 1 yes yes lvlsps-sTotal Paging Space Percent Used3592MB 1%Bad Layout aboveShould be balancedMake hd6 the biggest by one lp or the same size as the others in a mixedenvironment like thisSVMON Terminology•persistent–Segments used to manipulate files and directories •working–Segments used to implement the data areas of processesand shared memory segments•client–Segments used to implement some virtual file systems likeNetwork File System (NFS) and the CD-ROM file system•/infocenter/pseries/topi c/com.ibm.aix.doc/cmds/aixcmds5/svmon.htmsvmon-Gsize inuse free pin virtualmemory 26279936 18778708 7501792 3830899 18669057pg space 7995392 53026work pers clnt lpagepin 3830890 0 0 0in use 18669611 80204 28893 0In GB Equates to:size inuse free pin virtualmemory 100.25 71.64 28.62 14.61 71.22pg space 30.50 0.20work pers clnt lpagepin 14.61 0 0 0in use 71.22 0.31 0.15 0General Recommendations•Different hot LVs on separate physical volumes•Stripe hot LV across disks to parallelize•Mirror read intensive data•Ensure LVs are contiguous–Use lslv and look at in-band % and distrib–reorgvg if needed to reorg LVs•Writeverify=no•minpgahead=2, maxpgahead=16 for 64kb stripe size•Increase maxfree if you adjust maxpgahead•Tweak minperm, maxperm and maxrandwrt•Tweak lvm_bufcnt if doing a lot of large raw I/Os•If JFS2 tweak j2 versions of above fields•Clean out inittab and rc.tcpip and inetd.conf, etc for things that should not start–Make sure you don’t do it partially–i.e. portmap is in rc.tcpip and rc.nfsOracle Specifics•Use JFS2 with external JFS2 logs(if high write otherwise internal logs are fine)•Use CIO where it will benefit you–Do not use for Oracle binaries•Leave DISK_ASYNCH_IO=TRUE in Oracle•Tweak the maxservers AIO settings•If using JFS–Do not allocate JFS with BF (LFE)–It increases DIO transfer size from 4k to 128k–2gb is largest file size–Do not use compressed JFS –defeats DIOTools•vmstat –for processor and memory•nmon–/collaboration/wiki/display/WikiPtype/nmon–To get a 2 hour snapshot (240 x 30 seconds)–nmon-fT-c 30 -s 240–Creates a file in the directory that ends .nmon•nmon analyzer–/collaboration/wiki/display/WikiPtype/nmonanalyser–Windows tool so need to copy the .nmon file over–Opens as an excel spreadsheet and then analyses the data•sar–sar-A -o filename 2 30 >/dev/null–Creates a snapshot to a file –in this case 30 snaps 2 seconds apart •ioo, vmo, schedo, vmstat–v•lvmo•lparstat,mpstat•Iostat•Check out Alphaworks for the Graphical LPAR tool•Many many moreOther tools•filemon–filemon -v -o filename -O all–sleep 30–trcstop•pstat to check async I/O–pstat-a | grep aio| wc–l•perfpmr to build performance info forIBM if reporting a PMR–/usr/bin/perfpmr.sh300lparstatlparstat-hSystem Configuration: type=shared mode=Uncapped smt=On lcpu=4 mem=512 ent=5.0 %user %sys %wait %idle physc%entc lbusy app vcsw phint%hypv hcalls0.0 0.5 0.0 99.5 0.00 1.0 0.0 -1524 0 0.5 154216.0 76.3 0.0 7.7 0.30 100.0 90.5 -321 1 0.9 259Physc–physical processors consumed%entc–percent of entitled capacityLbusy–logical processor utilization for system and userVcsw–Virtual context switchesPhint–phantom interrupts to other partitions%hypv-%time in the hypervisor for this lpar–weird numbers on an idle system may be seen/infocenter/pseries/index.jsp?topic=/com.ibm.aix.doc/cmds/aixcmds3/lparstat.htmmpstatmpstat–sSystem configuration: lcpu=4 ent=0.5Proc1Proc00.27%49.63%cpu0cpu2cpu1cpu30.17%0.10% 3.14%46.49%Above shows how processor is distributed using SMTAsync I/OTotal number of AIOs in usepstat–a | grep aios| wc–lOr new way is:ps–k | grep aio| wc-l4205AIO max possible requestslsattr –El aio0 –a maxreqsmaxreqs4096 Maximum number of REQUESTS TrueAIO maxserverslsattr –El aio0 –a maxserversmaxservers 320 MAXIMUM number of servers per cpu TrueNB –maxservers is a per processor setting in AIX 5.3Look at using fastpathFastpath can now be enabled with DIO/CIOSee Session A23 by Grover Davidson for a lot more info on Async I/OI/O Pacing•Useful to turn on during backups (streaming I/Os)•Set high value to multiple of (4*n)+1•Limits the number of outstanding I/Osagainst an individual file•minpout–minimum•maxpout–maximum•If process reaches maxpout then it issuspended from creating I/O untiloutstanding requests reach minpoutNetwork•no –a & nfso-a to find what values are set to now•Buffers–Mbufs•Network kernel buffers•thewall is max memory for mbufs•Can use maxmbuf tuneable to limit this or increase it–Uses chdev–Determines real memory used by communications–If 0 (default) then thewall is used–Leave it alone–TCP and UDP receive and send buffers–Ethernet adapter attributes•If change send and receive above then also set it here–no and nfso commands–nfsstat–rfc1323 and nfs_rfc1323netstat•netstat–i–Shows input and output packets and errors foreach adapter–Also shows collisions•netstat–ss–Shows summary info such as udp packets droppeddue to no socket•netstat–m–Memory information•netstat–v–Statistical information on all adaptersNetwork tuneables•no -a•Using no–rfc1323 = 1–sb_max=1310720(>= 1MB)–tcp_sendspace=262144–tcp_recvspace=262144–udp_sendspace=65536(at a minimum)–udp_recvspace=655360•Must be less than sb_max•Using nfso–nfso-a–nfs_rfc1323=1–nfs_socketsize=60000–nfs_tcp_socketsize=600000•Do a web search on “nagle effect”•netstat–s | grep“socket buffer overflow”nfsstat•Client and Server NFS Info •nfsstat–cn or –r or –s–Retransmissions due to errors•Retrans>5% is bad–Badcalls–Timeouts–Waits–ReadsUseful Links• 1. Ganglia–• 2. Lparmon–/tech/lparmon• 3. Nmon–/collaboration/wiki/display/WikiPtype/nmon• 4. Nmon Analyser–/collaboration/wiki/display/WikiPtype/nmonanalyser • 5. Jaqui's AIX* Blog–Has a base set of performance tunables for AIX 5.3 /blosxomjl.cgi/• 6. vmo command–/infocenter/pseries/v5r3/index.jsp?topic=/com.ibm.aix.doc/cmds/aixcmds6/vmo.htm •7. ioo command–/infocenter/pseries/v5r3/index.jsp?topic=/com.ibm.aix.doc/cmds/aixcmds3/ioo.htm •8. vmstat command–/infocenter/pseries/v5r3/index.jsp?topic=/com.ibm.aix.doc/cmds/aixcmds3/ioo.htm •9. lvmo command–/infocenter/pseries/v5r3/index.jsp?topic=/com.ibm.aix.doc/cmds/aixcmds3/ioo.htm •10. eServer Magazine and AiXtra–/•Search on Jaqui AND Lynch•Articles on Tuning and Virtualization•11. Find more on Mainline at:–/ebrochureQuestions?Supplementary SlidesDisk Technologies•Arbitrated–SCSI20 or 40 mb/sec–FC-AL 100mb/sec–Devices arbitrate for exclusive control–SCSI priority based on address •Non-Arbitrated–SSA80 or 160mb/sec–Devices on loop all treated equally–Devices drop packets of data on loopAdapter Throughput-SCSI100%70%Bits Maxmby/s mby/s Bus DevsWidth •SCSI-15 3.588•Fast SCSI10788•FW SCSI20141616•Ultra SCSI201488•Wide Ultra SCSI 4028168•Ultra2 SCSI402888•Wide Ultra2 SCSI80561616•Ultra3 SCSI1601121616•Ultra320 SCSI3202241616•Ultra640 SCSI6404481616•Watch for saturated adaptersCourtesy of /terms/scsiterms.htmlAdapter Throughput-Fibre100%70%mbit/s mbit/s•13393•266186•530371• 1 gbit717• 2 gbit1434•SSA comes in 80 and 160 mb/secRAID Levels•Raid-0–Disks combined into single volume stripeset–Data striped across the disks•Raid-1–Every disk mirrored to another–Full redundancy of data but needs extra disks–At least 2 I/Os per random write•Raid-0+1–Striped mirroring–Combines redundancy and performanceRAID Levels•RAID-5–Data striped across a set of disks–1 more disk used for parity bits–Parity may be striped across the disks also–At least 4 I/Os per random write(read/write to data and read/write toparity)–Uses hot spare technology。
AIX内存性能优化剖析

AIX 5L 内存性能优化第1 部分: AIX Version 5.3 中内存的概述以及内存参数的优化本系列的三篇文章深入研究内存优化中的参数优化,重点关注于内存性能优化方面的各种挑战和各种最佳实践,并且还介绍了AIX® Version 5.3 中的一些改进。
尽管与中央处理单元(CPU) 优化相比,实现内存优化可能更加困难,但它同样是非常重要的。
在AIX 服务器中,与任何其他子系统相比,您可以对内存进行更多的优化工作。
更改系统中的某些内存参数,可以极大地提高性能,特别是在尚未对这些参数进行优化的运行环境中。
本系列文章的第1 部分提供了AIX 中内存的概述,包括对虚拟内存和虚拟内存管理器(VMM) 的介绍。
引言作为一名系统管理员,您应该已经对有关内存的基本知识非常熟悉,如物理和虚拟内存之间的区别。
您可能还不是很清楚AIX® 中的虚拟内存管理器(VMM) 是如何工作的、以及它与性能优化之间的关系如何。
而且,在最近几年中,有一些优化命令和参数发生了变化,如果您较长时间没有使用AIX 了,那么您可能会发现,您从前所熟悉的一些命令,现在甚至根本无法继续使用了。
本文详细地介绍了AIX VMM,以及优化VMM 所需使用的各种优化命令。
我将介绍一些监视工具,您可以使用这些工具来优化您的系统,本文还对一些比较重要的AIX Version 5.3 内存管理增强功能进行概述。
实现这些增强功能,即将其应用到您的系统环境,可以在您的系统中优化内存性能。
尽管您可能会发现,与其他的子系统相比,内存的优化更为困难一些,但是收到的效果往往更加显著。
可能还有一些应该在您的系统中进行设置的特定的优化建议,这取决于您所运行的系统的类型。
为了帮助证实这些内容,我使用了一个特定的示例,并介绍了进行这些参数设置的一些最佳实践。
在某些情况下,动态地优化一个或两个参数,可能会使得您的系统的整体性能完全不同。
无论您需要对哪个子系统进行优化,有一个方面是相同的,即优化系统—您始终应该将其看作一个正在进行的进程。
AIX 5L 网络性能优化 第 3 部分

AIX 5L 网络性能优化: 第3 部分引言虽然运行诸如 netstat 之类的命令可以提供一些有用的信息,但有时您仍然需要深入到数据包级别上进行更进一步的分析。
在这种情况下,可以使用各种跟踪工具。
本文将描述这些实用工具,包括 iptrace、ipreport 和 tcpdump。
本文还将向您介绍如何使用像 no 这样的工具来优化网络。
虽然 no 命令与 vmo 和ioo 很类似,但 no 是面向网络的版本。
本文重点关注于 tcp 工作负载优化、udp 工作负载优化,以及 no 实用工具所提供的一些其他值得关注的参数。
本文还将讨论 ARP 缓存优化,以及如何监视和优化 ARP 统计信息。
您还将了解名称解析,以及如何通过对解析主机名的方式进行少量的调整,以简单地提高性能。
监视网络数据包在这个部分中,您将了解一些相关工具的概述,这些工具可以帮助您监视网络数据包。
这些工具允许您快速地对性能问题进行故障排除,并获取相关的数据以便进行历史趋势的研究和分析。
第 1 部分介绍了一些非常基本的标志,如-in,这是 netstat 的一个常用标志。
使用 netstat,您还可以监视有关数据包本身的、更为详细的信息。
例如,-D选项将显示您的通信子系统所接收的、传输的和丢弃的数据包的总数。
可以按设备、驱动程序和协议来对结果进行排序(请参见清单 1)。
清单 1. 带-D选项的 netstatroot@lpar37p682e[/home] > netstat -DSource Ipkts Opkts Idrops Odrops-------------------------------------------------------------------------------ent_dev0 238122150 1805 0 0ent_dev1 17583646 301547 0 0--------------------------------------------------------------- Devices Total 255705796 303352 0 0-------------------------------------------------------------------------------ent_dd0 238122150 1805 0 0ent_dd1 17583646 301547 0---------------------------------------------------------------Drivers Total 255705796 303352 0 0-------------------------------------------------------------------------------ent_dmx0 238011223 N/A 110927 N/Aent_dmx1 17466977 N/A 116669 N/A--------------------------------------------------------------- Demuxer Total 255478200 N/A 227596 N/A-------------------------------------------------------------------------------IP 238073400 301739 2392 1691IPv6 0 0 0 0TCP 7373 296758 93 0UDP 238063379 4677 238055978 0--------------------------------------------------------------- Protocols Total 476144152 603174 238058463 1691-------------------------------------------------------------------------------en_if1 17466977 301547 0 0en_if0 238011223 1805 0 0lo_if0 609 619 10 0---------------------------------------------------------------Net IF Total 255478809 303971 10 0另一个有用的标志是-s,它将显示所使用的全部协议的详细统计信息(包括发送的、接收的和丢弃的数据包)。
AIX 性能调优-内存、CPU篇
AIX 性能调优-内存、CPU篇sar -P ALL cpu使用情况sar -a 文件访问情况dirblk/s 定位文件时被目录访问守护进程读取的快(512b)的个数iget/s i节点查找系统进程被调用次数lookuppn/s 目录查找进程找到v节点,并获取路径名的次数sar -b buffer的活动情况,包括传输、访问、和命中率bread/s、bwrit/s 块IO操作的数量lread/s、lwrit/s 逻辑 IO请求的个数pread/s、pwrit/s 裸设备IO操作数量%rcache、%rwrit cache命中率,计算共式为:((lreads-breads)/lreads)*100sar -c 系统调用情况exec/s、fork/s 调用和执行系统调用总数sread/s、swrit/s read/writ 系统调用次数rchar/s、wchar/s 被read/writ系统调用的字符数量scall/s 系统调用总数sar -k 内核进程活动情况kexit/s 中断的内核进程数kproc-ov/s 由于进程数的限制无法创建内核进程的次数ksched/s 被作业分派的内核进程数sar -m 消息队列和信号灯活动情况msg/s IPC消息队列活动情况sema/s 信号灯活动情况sar -d 磁盘读写情况sar -q 队列统计信息run-sz 内核线程处于运行队列的平均数%runocc 最近时间段运行队列占用百分比swpq-sz 内核线程等待页面调度的平均数%swpocc 交换队列最近活动情况sar -r 页面调度信息cycle/s 每秒中页面置换次数fault/s 每秒中page fault次数slots 在页空间中空闲页数量odio/s 每秒中不使用页面空间的磁盘io数sar -v 进程、内核线程、i节点、和文件表的状态sar-w 上下文切换次数sar -y tty设备活动情况canch/s tty输入队列中规范的字符数mdmin/s tty modem 中断outch/s 输出队列字符数rawch/s 输入队列字符数revin/s tty接收中断xmtin/s tty传输中断如果CPU的使用率接近100%(usr+system),可以视为是CPU瓶颈。
1如何在AIX下进行磁盘管理

如何在AIX下进行磁盘管理目录AIX下进行磁盘管理........................................................检查AIX磁盘信息.......................................................创建PV使设备能被系统使用..............................................创建VG并使用上PV.....................................................在VG上创建LV.........................................................创建文件系统........................................................... 常见故障处理..............................................................AIX6.1下安装UltraPath 报错............................................创建PV时报错..........................................................安装SSH注意事项.......................................................AIX下进行磁盘管理AIX 下进行磁盘管理过程包含以下几个主题:●检查AIX下磁盘信息●将存储资源创建成PV●创建VG并使用上PV●在VG上创建LV●创建文件系统检查AIX磁盘信息1、检查存储资源是否被系统识别。
重新扫描设备# cfgmgr –v查看磁盘:# lsdev –Cc diskhdisk0 Available 01-08-00 SAS Disk Drivehdisk1 Available 01-08-00 SAS Disk Drivehdisk2 Available Other iSCSI Disk Drive检查PV信息。
AIX性能问题诊断及调优
在AIX日常运维中,性能问题一直是一个很重要的问题,为了让操作系统能正常平稳高效的运行,便需要一些武功秘籍来进行快速定准并解决问题,本次我们便来讨论一下我们可以用到的武功秘籍。
所谓性能问题,主要几种在CPU、内存、I/O三个大类别,因此我们分类进行讨论。
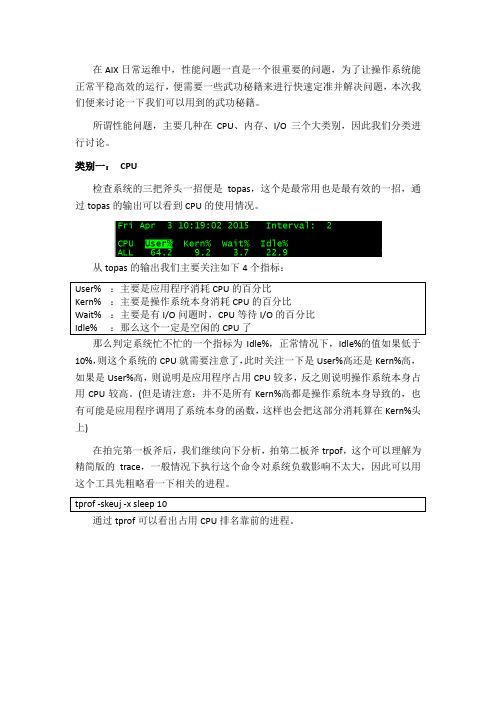
类别一:CPU检查系统的三把斧头一招便是topas,这个是最常用也是最有效的一招,通过topas的输出可以看到CPU的使用情况。
从topas的输出我们主要关注如下4个指标:那么判定系统忙不忙的一个指标为Idle%,正常情况下,Idle%的值如果低于10%,则这个系统的CPU就需要注意了,此时关注一下是User%高还是Kern%高,如果是User%高,则说明是应用程序占用CPU较多,反之则说明操作系统本身占用CPU较高。
(但是请注意:并不是所有Kern%高都是操作系统本身导致的,也有可能是应用程序调用了系统本身的函数,这样也会把这部分消耗算在Kern%头上)在拍完第一板斧后,我们继续向下分析,拍第二板斧trpof,这个可以理解为精简版的trace,一般情况下执行这个命令对系统负载影响不太大,因此可以用这个工具先粗略看一下相关的进程。
通过tprof可以看出占用CPU排名靠前的进程。
如果root cause还没有找到,那么便使出大招,收trace数据。
在收集trace 数据前请先注意以下原则:①收集trace数据会对当前系统的负载有影响,在CPU已经达到99%时,再收集trace有可能把操作系统搞夯。
②一定要等到问题重现时收集trace,由于trace产生的数据量巨大,因此要收集有效时间段的trace。
如果不确定问题什么时候重现,可以写个判断脚本,收集循环trace。
③用root用户进行trace收集④需要预估trace数据的大小,然后根据预估的空间,在操作系统上找一个空间较大的地方存放数据。
trace数据的大小可以用下列公式算出:预估数据大小=逻辑CPU的个数* 10MB(其中逻辑CPU的个数可以用vmstat | grep -i lcpu命令查看)在执行完上述收集命令后,会生成trace的raw文件。
- 1、下载文档前请自行甄别文档内容的完整性,平台不提供额外的编辑、内容补充、找答案等附加服务。
- 2、"仅部分预览"的文档,不可在线预览部分如存在完整性等问题,可反馈申请退款(可完整预览的文档不适用该条件!)。
- 3、如文档侵犯您的权益,请联系客服反馈,我们会尽快为您处理(人工客服工作时间:9:00-18:30)。
本系列共有三篇文章(见 参考资料),介绍 AIX® 磁盘和 I/O 子系统,重点关注在优化磁盘 I/O 性能时遇到的各种挑战。
尽管磁盘调优很可能没有 CPU 或者内存优化那么激动人心,但它是优化服务器性能的关键方面。
事实上,部分原因是因为磁盘 I/O 是最薄弱的子系统环节,与任何其他子系统相比,可以通过更多的措施提高磁盘 I/O 性能。
简介本系列的 第 1 部分 和 第 2 部分 讨论了设计系统架构的重要性,它对整体系统性能的影响,以及一个新的 I/O 优化工具 lvmo,可以使用该工具对逻辑卷进行调优。
在这个部分中,将研究如何使用 ioo 命令优化系统,该命令可以对大多数 I/O 调优参数进行配置,显示所有I/O 调优参数的当前值或下一次启动值。
还将学习如何以及何时使用filemon 和 fileplace 工具。
通过使用增强型日志文件系统(AIX 中的默认文件系统),提高整体文件系统性能、优化文件系统以及让JFS2 产生最好的性能,这些都是调优技术的重要部分。
甚至还将研究一些可能影响性能的文件系统属性,比如顺序访问和随机访问。
文件系统概述本节讨论 JFS2、文件系统性能以及对 JFS 所做的特定性能改进。
正如您所知道的,在 AIX 中有两种类型的内核。
它们是 32 位内核和 64位内核。
尽管它们共享一些共同的库、大多数的命令及实用工具,但了解它们的区别以及内核与整体性能调优之间的关系是非常重要的。
JFS2针对 64 位内核进行了优化,而 JFS 则针对 32 位内核进行了优化。
尽管日志文件系统可以提供更高的安全性,但在以前往往会带来性能方面的开销。
在更重视性能(以牺牲可用性为代价)的情况下,可能会禁用元数据日志记录功能以提高 JFS 的性能。
对于 JFS2,也可以通过禁用日志记录(在 AIX 6.1 和更高版本中)帮助提高性能。
可以在挂载文件系统时禁用日志记录功能,这意味着不需要担心修改或重新配置文件系统。
只需修改挂载选项。
例如,使用以下命令禁用文件系统上的日志记录功能:mount -i log=NULL /database。
尽管 JFS2 为提高元数据操作(即通常由日志记录框架处理的那些操作)的性能做了优化,但是对于文件修改和创建/删除操作比例很高的文件系统,关闭日志记录功能仍然会显著提高性能。
例如,对于开发文件系统,可能会看到性能提升。
对于使用比较静态的文件的数据库,性能改进可能不太显著。
但是,对于使用压缩功能,应该谨慎。
尽管压缩可以节省磁盘空间(因为对磁盘物理地读写的数据更少,还会减少磁盘读写操作),但是会加重系统的 CPU 负载,实际上会降低性能。
增强的 JFS2 在执行索引节点搜索时使用二叉树表示形式,与 JFS 使用的线性方法相比,这种方法要好得多。
另外,在创建文件系统的时候不再需要分配索引节点,因为现在它们是由 JFS2 动态分配的(这意味着将不会耗尽索引节点)。
尽管在本系列的第 1 部分中已经介绍过并发 I/O,但在这里有必要再次提及这个主题。
并发 I/O 的实现允许多个线程并发地对同一个文件进行读写数据的操作。
这是由于在实现 JFS2 时采用了写独占 (write-exclusive) 索引节点锁。
这种方式允许多个用户同时读取同一个文件,当多个用户需要读取相同的数据文件时,这能够显著地提高性能。
要想启用并发 I/O,只需使用合适的标志挂载文件系统(见 清单1)。
建议在使用 Oracle 等数据库时考虑使用并发 I/O。
清单 1. 启用并发 I/Oroot@lpar29p682e_pub[/] mount -o cio /testroot@lpar29p682e_pub[/] > df -k /testFilesystem 1024-blocks Free %Used Iused %Iused Mounted on/dev/fslv00 131072 130724 1% 4 1%/test表 1 说明 JFS2 的各种增强功能,以及它们与系统性能之间的关系。
在优化 I/O 系统时,许多可调项本身(稍后将深入讨论)也存在差别,这取决于正在使用的是 JFS 还是 JFS2,了解这一点也非常重要。
表 1. JFS2 的增强功能功能JFS JFS2压缩有无配额有有延迟的更新有无直接 I/O 支持有有优化32 位64 位最大文件系统大小 1 TB 4 PB最大文件大小64 GB 4 PB索引节点的数量在创建文件系统时确定动态大文件支持作为挂载选项默认联机碎片整理有有Namefs有有DMAPI无有filemon 和 fileplace本节介绍两个重要的 I/O 工具 filemon 和 fileplace,并讨论如何在日常系统管理工作中使用它们。
filemon 使用一种跟踪设施来报告物理和逻辑存储(包括实际文件)的I/O 活动。
按照在运行跟踪时指定的时间间隔,对 I/O 活动进行监视。
它报告文件系统的所有层的使用率,包括逻辑卷管理器 (LVM)、虚拟内存和物理磁盘层。
如果不使用任何标志,那么在要监视的应用程序或者系统命令运行时,它在后台运行。
跟踪自动启动,直到停止它为止。
此时,命令生成 I/O 活动报告,然后退出。
它还可以处理跟踪设施已经记录的跟踪文件。
然后,可以根据此文件生成报告。
因为发送到标准输出的报告常常会在屏幕上一滚而过,所以建议使用 -o 选项将输出写到一个文件中(见 清单 2)。
清单 2. 使用带 -o 选项的 filemonl488pp065_pub[/] > filemon -o dbmon.out -O allRun trcstop command to signal end of trace.Thu Aug 12 09:07:06 2010System: AIX 7.1 Node: l488pp065_pub Machine: 00F604884C00l488pp065_pub[/] > trcstopl488pp065_pub[/] > cat dbmon.outThu Aug 12 09:10:09 2010System: AIX 7.1 Node: l488pp065_pub Machine: 00F604884C00Cpu utilization: 72.8%Cpu allocation: 100.0%21947755 events were lost. Reported data may haveinconsistencies or errors.Most Active Files------------------------------------------------------------------------#MBs #opns #rds #wrs file volume:inode------------------------------------------------------------------------0.4 1 101 0 unix/dev/hd2:822410.0 9 10 0 vfs/dev/hd4:96410.0 4 6 1 db.sql0.0 3 6 2 ksh.cat/dev/hd2:1111920.0 1 2 0 cmdtrace.cat/dev/hd2:1107570.0 45 1 0 null0.0 1 1 0 dd.cat/dev/hd2:1108270.0 9 2 0 SWservAt/dev/hd4:91560.0 1 0 3 db2.sql0.0 9 2 0 SWservAt.vc/dev/hd4:9157Most Active Segments------------------------------------------------------------------------#MBs #rpgs #wpgs segid segtype volume:inode------------------------------------------------------------------------0.1 2 13 8359ba clientMost Active Logical Volumes------------------------------------------------------------------------util #rblk #wblk KB/s volume description------------------------------------------------------------------------0.04 0 32 0.3 /dev/hd9var /var0.00 0 48 0.5 /dev/hd8 jfs2log 0.00 0 8 0.1 /dev/hd4 /Most Active Physical Volumes------------------------------------------------------------------------util #rblk #wblk KB/s volume description------------------------------------------------------------------------0.00 0 72 0.7 /dev/hdisk0 N/A Most Active Files Process-Wise------------------------------------------------------------------------#MBs #opns #rds #wrs filePID(Process:TID)------------------------------------------------------------------------0.0 3 6 0 db.sql7667828(ksh:9437345)0.0 1 2 0 ksh.cat7667828(ksh:9437345)0.0 1 0 3 db2.sql7667828(ksh:9437345)0.0 1 0 1 db.sql7733344(ksh:7405633)0.4 1 101 0 unix7667830(ksh:9437347)0.0 1 2 0 cmdtrace.cat7667830(ksh:9437347)0.0 1 2 0 ksh.cat7667830(ksh:9437347)0.0 9 2 0 SWservAt7667830(ksh:9437347)0.0 9 2 0 SWservAt.vc7667830(ksh:9437347)0.0 1 0 0 systrctl7667830(ksh:9437347)0.0 44 0 44 null4325546(slp_srvreg:8585241)0.0 1 2 2 ksh.cat7667826(ksh:23527615)0.0 1 1 0 dd.cat7667826(ksh:23527615)0.0 1 1 0 null7667826(ksh:23527615)0.0 1 0 0 test7667826(ksh:23527615)0.0 8 8 0 vfs3473482(topasrec:13566119)0.0 1 0 0 CuAt.vc3473482(topasrec:13566119)0.0 1 0 0 CuAt3473482(topasrec:13566119)0.0 1 2 0 vfs2097252(syncd:2490503)0.0 1 0 0 installable4260046(java:15073489)Most Active Files Thread-Wise------------------------------------------------------------------------#MBs #opns #rds #wrs fileTID(Process:PID)------------------------------------------------------------------------0.0 3 6 0 db.sql9437345(ksh:7667828)0.0 1 2 0 ksh.cat 9437345(ksh:7667828)0.0 1 0 3 db2.sql 9437345(ksh:7667828)0.0 1 0 1 db.sql 7405633(ksh:7733344)0.4 1 101 0 unix 9437347(ksh:7667830)0.0 1 2 0 cmdtrace.cat 9437347(ksh:7667830)0.0 1 2 0 ksh.cat 9437347(ksh:7667830)0.0 9 2 0 SWservAt 9437347(ksh:7667830)0.0 9 2 0 SWservAt.vc 9437347(ksh:7667830)0.0 1 0 0 systrctl 9437347(ksh:7667830)0.0 44 0 44 null 8585241(slp_srvreg:4325546)0.0 1 2 2 ksh.cat 23527615(ksh:7667826)0.0 1 1 0 dd.cat 23527615(ksh:7667826)0.0 1 1 0 null 23527615(ksh:7667826)0.0 1 0 0 test 23527615(ksh:7667826)0.0 8 8 0 vfs 13566119(topasrec:3473482)0.0 1 0 0 CuAt.vc 13566119(topasrec:3473482)0.0 1 0 0 CuAt 13566119(topasrec:3473482)0.0 1 2 0 vfs 2490503(syncd:2097252)0.0 1 0 0 installable15073489(java:4260046)dbmon.out: END应该寻找比较长的寻道时间,因为它们会导致应用程序性能降低。