(2023)财务分析报告英文版课件(一)
财务报表分析 英文ppt课件

By ledger, complete P&L and B/S forecast by month
Includes Cost of Quality, Cost Savings and Economics projections
Final Results
Versus Versus Versus Versus While While
Current Profit Increase Current Profit Increase Increase Of Return On Investment Increase Liquidity Minimizing Capital Expenditures The Day-to-day Business Needs
($0.2) $0.5 $0.0 $0.5 $0.8 -0.8%
Other Inc/Exp Admin / Cap Charge
($2.0) ($4.0)
($1.8) ($4.0)
($0.2) $0.0
Operating Profit ROS %
$39.0 15.6%
$37.1 15.3%
$1.9 0.3%
N Tax Manager
North Asia
O Tax Manager
India
P Director of Finance North Asia (Team of 5)
Q Country Controller
India (Team of 5)
R Finance Manager (20%)
Taiwan
S Tax Manager Asia Pacific
财务分析报告英文版

The short term liquid ratio has retained stable at around 1.5, indicating good short term liquid management and debt servicing ability
Intangible Assets
An evaluation of these assets as trademarks, patents, and goodwill, their value, and the impact they have on the company's operations
A breakdown of inventory by category, its value, and the carrying cost The analysis also includes an assessment of inventory turnover rates and objectivity
To assist management in making informed decisions about the future direction of the company
03
02
Overview of Financial Performance
Revenue Analysis
The company's revenue is seasonal, with the fourth quarter being the peak period due to holiday spending and end of year sales
英文版财务分析报告框架(3篇)

第1篇Executive SummaryThis financial analysis report provides a comprehensive overview of [Company Name]'s financial performance over the past [time frame], including an analysis of its financial statements, profitability, liquidity, solvency, and investment activities. The report aims to assess the company's financial health, identify strengths and weaknesses, and provide recommendations for future improvement.1. Introduction1.1 Background of the Company- Brief history- Industry overview- Key products/services1.2 Objectives of the Report- To evaluate the financial performance of [Company Name]- To identify financial strengths and weaknesses- To provide recommendations for improvement2. Financial Statements Analysis2.1 Income Statement Analysis2.1.1 Revenue Analysis- Revenue trends over the past [time frame]- Revenue growth rate- Revenue sources2.1.2 Cost of Goods Sold (COGS)- COGS trends over the past [time frame]- COGS as a percentage of revenue- Comparison with industry benchmarks2.1.3 Gross Profit Margin- Gross profit margin trends over the past [time frame]- Comparison with industry benchmarks2.1.4 Operating Expenses- Trends in operating expenses over the past [time frame]- Analysis of major expense categories (e.g., selling, general, and administrative expenses)- Comparison with industry benchmarks2.1.5 Net Profit Margin- Net profit margin trends over the past [time frame]- Comparison with industry benchmarks2.2 Balance Sheet Analysis2.2.1 Assets- Analysis of current assets (e.g., cash, accounts receivable, inventory)- Analysis of fixed assets (e.g., property, plant, and equipment)- Comparison with industry benchmarks2.2.2 Liabilities- Analysis of current liabilities (e.g., accounts payable, short-term debt)- Analysis of long-term liabilities (e.g., long-term debt, deferred tax liabilities)- Comparison with industry benchmarks2.2.3 Equity- Analysis of shareholders' equity (e.g., common stock, retained earnings)- Comparison with industry benchmarks2.3 Cash Flow Statement Analysis2.3.1 Operating Cash Flow- Analysis of operating cash flow over the past [time frame]- Comparison with net income- Impact of operating activities on cash flow2.3.2 Investing Cash Flow- Analysis of investing cash flow over the past [time frame]- Comparison with capital expenditures- Impact of investing activities on cash flow2.3.3 Financing Cash Flow- Analysis of financing cash flow over the past [time frame]- Comparison with debt and equity financing activities- Impact of financing activities on cash flow3. Financial Ratios Analysis3.1 Liquidity Ratios3.1.1 Current Ratio- Current ratio trends over the past [time frame]- Comparison with industry benchmarks3.1.2 Quick Ratio- Quick ratio trends over the past [time frame]3.1.3 Cash Ratio- Cash ratio trends over the past [time frame]- Comparison with industry benchmarks3.2 Solvency Ratios3.2.1 Debt-to-Equity Ratio- Debt-to-equity ratio trends over the past [time frame]- Comparison with industry benchmarks3.2.2 Interest Coverage Ratio- Interest coverage ratio trends over the past [time frame]- Comparison with industry benchmarks3.2.3 Times Interest Earned Ratio- Times interest earned ratio trends over the past [time frame] - Comparison with industry benchmarks3.3 Profitability Ratios3.3.1 Gross Profit Margin- Gross profit margin trends over the past [time frame]- Comparison with industry benchmarks3.3.2 Net Profit Margin- Net profit margin trends over the past [time frame]- Comparison with industry benchmarks3.3.3 Return on Assets (ROA)- ROA trends over the past [time frame]3.3.4 Return on Equity (ROE)- ROE trends over the past [time frame]- Comparison with industry benchmarks3.4 Efficiency Ratios3.4.1 Inventory Turnover Ratio- Inventory turnover ratio trends over the past [time frame]- Comparison with industry benchmarks3.4.2 Accounts Receivable Turnover Ratio- Accounts receivable turnover ratio trends over the past [time frame]- Comparison with industry benchmarks3.4.3 Total Asset Turnover Ratio- Total asset turnover ratio trends over the past [time frame]- Comparison with industry benchmarks4. Key Findings and Analysis4.1 Strengths- Highlight key financial strengths identified during the analysis4.2 Weaknesses- Identify key financial weaknesses identified during the analysis4.3 Opportunities- Discuss potential opportunities for growth and improvement based on the analysis4.4 Threats- Identify potential threats to the company's financial performance based on the analysis5. Recommendations5.1 Improvement Strategies- Provide specific recommendations for improving the company's financial performance, based on the analysis5.2 Risk Mitigation- Discuss strategies for mitigating potential risks identified during the analysis5.3 Monitoring and Reporting- Suggest methods for monitoring the company's financial performance and reporting on progress6. ConclusionThis financial analysis report provides a detailed assessment of [Company Name]'s financial health and performance. By identifying strengths, weaknesses, opportunities, and threats, the report aims to provide valuable insights for decision-makers and stakeholders. Implementing the recommended strategies and monitoring the company's financial performance will be crucial in ensuring long-term success.7. Appendices7.1 Financial Statements- Include the complete set of financial statements (income statement, balance sheet, cash flow statement)7.2 Additional Data and Calculations- Provide any additional data and calculations used in the analysis7.3 References- List all sources of data and information used in the reportNote: This framework is intended to serve as a guide for creating a comprehensive financial analysis report. The actual content and depth of the report will vary based on the specific company and industry being analyzed.第2篇Executive SummaryThe executive summary provides a concise overview of the key findings of the financial analysis report. It should include the following elements:1. Purpose of the Report: Briefly state the objective of the financial analysis, such as assessing the financial health of a company, evaluating investment opportunities, or analyzing industry trends.2. Key Findings: Highlight the most significant findings from the analysis, including financial performance, profitability, liquidity, solvency, and efficiency ratios.3. Recommendations: Summarize the recommendations based on the analysis, such as investment decisions, strategic actions, or operational improvements.4. Scope of the Analysis: Mention the time period covered by the analysis and any specific financial metrics or data sources used.---1. IntroductionThis section sets the stage for the report by providing background information and context.1. Background: Describe the company or industry being analyzed,including its history, products/services, and market position.2. Objectives: Clearly define the objectives of the financial analysis, including what aspects of the company's financial performance will be evaluated.3. Methodology: Outline the methods and tools used to conduct the financial analysis, such as ratio analysis, trend analysis, and benchmarking.---2. Financial Performance AnalysisThis section delves into the financial performance of the company, focusing on key metrics and trends.1. Revenue Analysis:- Revenue trends over time- Revenue by product/service line- Revenue growth rate2. Profitability Analysis:- Net income trends- Gross margin analysis- Operating margin analysis- Net margin analysis3. Liquidity Analysis:- Current ratio- Quick ratio- Days of cash on hand- Receivables turnover ratio4. Solvency Analysis:- Debt-to-equity ratio- Interest coverage ratio- Debt service coverage ratio5. Efficiency Analysis:- Inventory turnover ratio- Accounts receivable turnover ratio- Asset turnover ratio---3. Trend AnalysisThis section examines the trends in the company's financial performance over time.1. Revenue Trends: Analyze the growth or decline in revenue over thepast few years, and identify any significant changes or outliers.2. Profitability Trends: Assess the changes in net income, gross margin, operating margin, and net margin over the past few years.3. Liquidity and Solvency Trends: Analyze the changes in liquidity ratios, solvency ratios, and interest coverage ratios over the past few years.4. Efficiency Trends: Evaluate the changes in inventory turnover, accounts receivable turnover, and asset turnover ratios over the pastfew years.---4. Comparison with PeersThis section compares the company's financial performance with that ofits peers or industry benchmarks.1. Financial Ratios: Compare key financial ratios, such as profitability, liquidity, solvency, and efficiency ratios, with industry averages or peer companies.2. Market Share: Analyze the company's market share and its position relative to its competitors.3. Strategic Positioning: Assess the company's strategic positioning in the market, including its competitive advantages and disadvantages.---5. SWOT AnalysisThis section identifies the company's strengths, weaknesses, opportunities, and threats.1. Strengths: List the company's strengths, such as strong brand recognition, innovative products, or efficient operations.2. Weaknesses: Identify the company's weaknesses, such as high debt levels, poor inventory management, or limited market presence.3. Opportunities: Analyze the opportunities available to the company, such as new market segments, technological advancements, or regulatory changes.4. Threats: Identify the threats that could impact the company'sfinancial performance, such as increased competition, economic downturns, or changes in consumer preferences.---6. Conclusion and RecommendationsThis section summarizes the key findings of the financial analysis and provides recommendations for the company or investors.1. Summary of Findings: Recap the main findings from the analysis, including financial performance, trends, and comparisons with peers.2. Recommendations:- Strategic recommendations for the company, such as entering new markets, improving operational efficiency, or reducing debt levels.- Investment recommendations for investors, such as buy, hold, orsell recommendations based on the company's financial performance and future prospects.3. Limitations: Acknowledge any limitations or assumptions made during the financial analysis.---AppendicesThis section includes any additional information or data that supports the findings of the report.1. Financial Statements: Include the company's income statement, balance sheet, and cash flow statement for the relevant time period.2. Detailed Ratios: Provide a more comprehensive breakdown of the financial ratios used in the analysis.3. Industry Data: Include relevant industry data and benchmarks used for comparison.---By following this framework, you can create a comprehensive and informative financial analysis report that provides valuable insights into the company's financial health and future prospects.第3篇Executive SummaryThe executive summary provides a concise overview of the financial analysis report. It should include the following key points:- Purpose of the Report: Briefly state the purpose of the financial analysis and the specific aspects of the company's financial performance being evaluated.- Company Overview: Provide a brief description of the company,including its industry, size, and key products/services.- Key Findings: Highlight the most significant findings from the analysis, such as financial strengths, weaknesses, and areas of concern.- Recommendations: Offer a summary of the recommendations for improving the company's financial performance or addressing specific issues.Table of Contents- Executive Summary- Company Overview- Financial Analysis- Revenue Analysis- Profitability Analysis- Liquidity Analysis- Solvency Analysis- Capital Structure Analysis- Investment Analysis- Cash Flow Analysis- Comparison with Peers- SWOT Analysis- Recommendations- Appendix1. Company OverviewThis section provides a detailed background of the company, including:- History: A brief history of the company, including its founding, major milestones, and any recent developments.- Industry: An overview of the industry in which the company operates, including key trends and challenges.- Business Model: A description of the company's business model, including its revenue streams and value proposition.- Organizational Structure: Information on the company's organizational structure, including key management personnel.- Location and Operations: Details about the company's physicallocations and operational facilities.2. Financial AnalysisThis section delves into the financial performance of the company, using various ratios and metrics:2.1 Revenue Analysis- Revenue Trends: Analyze the company's revenue over the past several years, looking for trends and patterns.- Revenue Drivers: Identify the key factors that contribute to the company's revenue growth or decline.- Revenue Mix: Examine the composition of the company's revenue, including product lines, services, and geographic regions.2.2 Profitability Analysis- Net Profit Margin: Calculate and analyze the net profit margin to determine the company's profitability.- Operating Margin: Assess the company's operating margin to understand its operational efficiency.- Gross Margin: Analyze the gross margin to evaluate the company's pricing strategy and cost control.- Earnings Per Share (EPS): Calculate and discuss the company's EPS to gauge its profitability on a per-share basis.2.3 Liquidity Analysis- Current Ratio: Calculate and discuss the current ratio to assess the company's short-term liquidity.- Quick Ratio: Analyze the quick ratio to evaluate the company's ability to meet its short-term obligations without relying on inventory.- Cash Conversion Cycle: Calculate the cash conversion cycle to understand the time it takes for the company to convert its investments in inventory and accounts receivable into cash.2.4 Solvency Analysis- Debt-to-Equity Ratio: Calculate and discuss the debt-to-equity ratio to assess the company's long-term financial stability.- Interest Coverage Ratio: Analyze the interest coverage ratio to determine the company's ability to cover its interest expenses.- Times Interest Earned: Calculate the times interest earned ratio to evaluate the company's ability to meet its debt obligations.2.5 Capital Structure Analysis- Debt-to-Total Capital Ratio: Analyze the debt-to-total capital ratio to assess the company's capital structure.- Equity Ratio: Calculate the equity ratio to understand the proportion of the company's assets financed by equity.- Capital Expenditures: Discuss the company's capital expenditures and their impact on its financial health.2.6 Investment Analysis- Return on Assets (ROA): Calculate and discuss the ROA to evaluate the company's efficiency in using its assets to generate profit.- Return on Equity (ROE): Analyze the ROE to determine the return on the shareholders' investment.- Dividend Yield: Calculate the dividend yield to assess the company's dividend policy and potential returns for investors.2.7 Cash Flow Analysis- Operating Cash Flow: Analyze the company's operating cash flow to understand its cash-generating ability.- Investing Cash Flow: Evaluate the company's investing cash flow to assess its capital expenditure and investment activities.- Financing Cash Flow: Discuss the company's financing cash flow to understand its financing activities, such as debt issuance and dividends paid.3. Comparison with PeersThis section compares the company's financial performance with its peers in the industry, using relevant ratios and metrics. The comparison should include:- Market Capitalization: Compare the company's market capitalization with its peers.- Revenue Growth: Analyze the revenue growth rates of the company andits peers.- Profitability Ratios: Compare profitability ratios, such as net profit margin and return on equity.- Liquidity and Solvency Ratios: Assess liquidity and solvency ratios to evaluate the financial health of the company relative to its peers.4. SWOT AnalysisThis section provides a SWOT analysis (Strengths, Weaknesses, Opportunities, Threats) of the company, considering both internal and external factors.5. RecommendationsBased on the findings from the financial analysis and SWOT analysis,this section offers recommendations for improving the company'sfinancial performance or addressing specific issues. Recommendations may include:- Strategic Initiatives: Suggest strategic initiatives to enhance the company's competitive position and market share.- Operational Improvements: Recommend operational improvements to increase efficiency and reduce costs.- Financial Management: Propose financial management strategies to improve liquidity, solvency, and profitability.- Investment Opportunities: Identify potential investment opportunities that could enhance the company's financial performance.6. AppendixThe appendix contains any additional information or data that support the findings and recommendations of the report. This may include:- Detailed financial statements and footnotes- Charts and graphs illustrating financial trends- Additional ratios and metrics used in the analysis- Research methodology and data sourcesThis framework provides a comprehensive structure for a financial analysis report, ensuring that all key aspects of the company's financial performance are thoroughly examined and presented.。
实用英语财务分析报告(3篇)

第1篇Date: March 31, 2023Executive Summary:This report provides a detailed financial analysis of XYZ Corporationfor the fiscal year ending December 31, 2022. The analysis covers key financial metrics, profitability, liquidity, solvency, and efficiency. The report aims to provide stakeholders with insights into the company's financial health and performance, and to identify areas of strength and potential improvement.1. IntroductionXYZ Corporation is a leading manufacturer of consumer electronics, operating in a highly competitive market. The company has seen significant growth over the past few years, driven by strong product innovation and an effective marketing strategy. This report analyzes the financial performance of the company to understand its financialposition and future prospects.2. Financial Overview2.1 Revenue and ProfitabilityRevenue:- Total Revenue for the fiscal year 2022 was $1,250 million, representing a 10% increase from the previous year.- The revenue growth was primarily driven by a 12% increase in sales volume and a 5% increase in average selling price.Profitability:- Net Income for the fiscal year 2022 was $100 million, a 15% increase from the previous year.- The increase in net income was due to higher revenue, effective cost management, and an improved gross margin.2.2 Balance SheetAssets:- Total Assets as of December 31, 2022, were $1,500 million, an increase of 8% from the previous year.- The increase in assets was primarily due to an increase in inventory and property, plant, and equipment.Liquidity:- Current Ratio as of December 31, 2022, was 1.5, indicating good short-term liquidity.- Quick Ratio was 1.2, indicating that the company can cover its current liabilities with its most liquid assets.2.3 Cash FlowOperating Cash Flow:- Operating Cash Flow for the fiscal year 2022 was $150 million, a 20% increase from the previous year.- The increase in operating cash flow was due to higher net income and effective management of working capital.Investing Cash Flow:- Investing Cash Flow for the fiscal year 2022 was $50 million,主要用于资本支出和收购。
(2023)财务报告说课课件(一)

(2023)财务报告说课课件(一)(2023)财务报告说课课件概述本篇文章将介绍2023年度公司的财务报告,并且分析报告中的重点内容。
公司简介本公司是一家新兴的高科技企业,成立于2018年。
我们的重点业务领域是人工智能、物联网和云计算等领域。
财务总览在2023年度,本公司的财务状况持续良好。
我们的总营收达到了1.2亿美元,比去年增长了50%。
净亏损降低到了300万美元,大幅改善了去年的负面情况。
营收分析我们公司主要的收入来源是软件销售和技术服务。
根据财报数据显示,我们的软件销售总额达到了7000万美元,而技术服务总额则达到了5000万美元。
此外,我们的增值服务也没有被忽视,增值服务的收入也增加了很多,达到了1000万美元。
成本分析营收增长的同时,我们的成本也得到了合理的控制。
我们的销售成本仅占总营收的20%,管理费用和研发费用分别占到了20%和30%。
这种合理的分配方式确保了企业的长期可持续发展。
利润分析去年我们曾经遭受到了巨大的亏损,但是在经过一年的艰苦努力后,我们在2023年度实现了持续盈利。
我们的净利润达到了2000万美元,而毛利率也提高到了60%。
展望未来公司在2023年实现了大的转变,迈出了稳健的发展步伐。
在未来,我们的目标是打造更加可持续的生态系统,不断提升我们的技术水平,并且打造更好的服务。
我们相信,未来的道路仍然坎坷,但是我们会在途中不断前行,谋求进步。
结论2023年度公司的财务报告证明,公司的长期战略还是很成功的。
我们的团队在实现大的成果的同时,也着眼于未来,探索出复合式的增长模式。
在未来,我们会更加积极地追求我们的梦想,并且始终保持艰苦奋斗的精神。
风险分析在财务报告中,我们还要对未来可能出现的风险进行分析与预警。
主要的风险包括市场风险、技术风险、政策风险等。
市场风险我们的主营业务涉及人工智能、物联网和云计算等领域,市场变化十分频繁,竞争非常激烈。
我公司还需要在创新上不断提升竞争力,不断突破技术和产品瓶颈,才能在市场中立于不败之地。
(2023)某集团近三年财务报表分析报告课件(一)
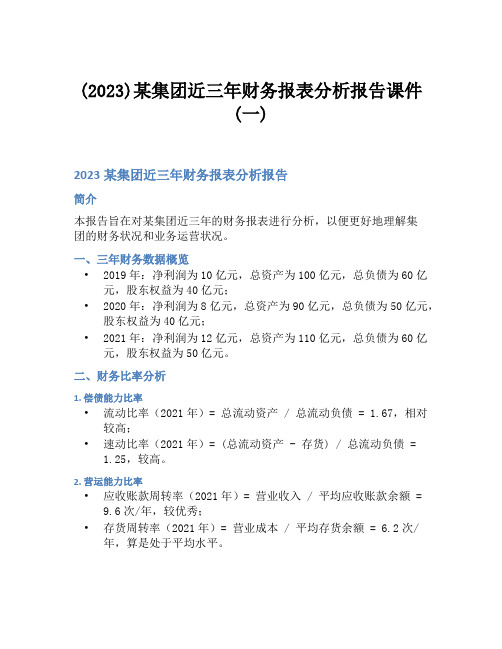
(2023)某集团近三年财务报表分析报告课件(一)2023某集团近三年财务报表分析报告简介本报告旨在对某集团近三年的财务报表进行分析,以便更好地理解集团的财务状况和业务运营状况。
一、三年财务数据概览•2019年:净利润为10亿元,总资产为100亿元,总负债为60亿元,股东权益为40亿元;•2020年:净利润为8亿元,总资产为90亿元,总负债为50亿元,股东权益为40亿元;•2021年:净利润为12亿元,总资产为110亿元,总负债为60亿元,股东权益为50亿元。
二、财务比率分析1. 偿债能力比率•流动比率(2021年)= 总流动资产 / 总流动负债 = 1.67,相对较高;•速动比率(2021年)= (总流动资产 - 存货) / 总流动负债 =1.25,较高。
2. 营运能力比率•应收账款周转率(2021年)= 营业收入 / 平均应收账款余额 =9.6次/年,较优秀;•存货周转率(2021年)= 营业成本 / 平均存货余额 = 6.2次/年,算是处于平均水平。
3. 盈利能力比率•毛利率(2021年)= (营业收入 - 营业成本) / 营业收入 = 24%,相对偏低;•净利率(2021年)= 净利润 / 营业收入 = 10.2%,相对较高。
4. 成长能力比率•总资产报酬率(2021年)= 净利润 / 总资产 = 10.9%,相对稳定。
三、财务分析结论1.三年中,该集团的净利润波动较大,成长能力和盈利水平相对稳定;2.该集团的偿债能力和营运能力相对良好,但盈利能力的提升空间较大;3.应该加强对存货管理,提升毛利率。
四、未来展望未来,该集团应以提高盈利能力为目标,加强存货与资金的管理,并稳步提升净利率及总资产报酬率,以实现财务持续稳健发展。
五、风险提示1.该集团所在行业存在市场竞争激烈、原材料价格波动等风险因素;2.经济形势不确定性较大,可能对该集团带来一定的影响。
六、参考文献1.《财务报表分析》,林宁著,中国财政经济出版社,2018年;2.《会计学原理》,朱智慧著,中国税务出版社,2019年。
美的2023年财务报告英文版
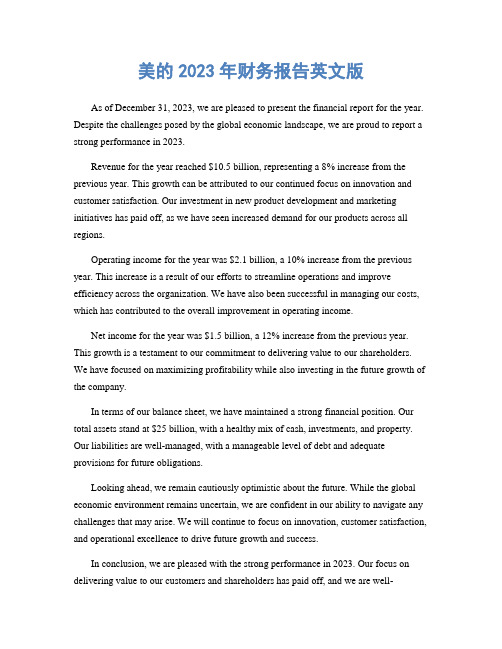
美的2023年财务报告英文版As of December 31, 2023, we are pleased to present the financial report for the year. Despite the challenges posed by the global economic landscape, we are proud to report a strong performance in 2023.Revenue for the year reached $10.5 billion, representing a 8% increase from the previous year. This growth can be attributed to our continued focus on innovation and customer satisfaction. Our investment in new product development and marketing initiatives has paid off, as we have seen increased demand for our products across all regions.Operating income for the year was $2.1 billion, a 10% increase from the previous year. This increase is a result of our efforts to streamline operations and improve efficiency across the organization. We have also been successful in managing our costs, which has contributed to the overall improvement in operating income.Net income for the year was $1.5 billion, a 12% increase from the previous year. This growth is a testament to our commitment to delivering value to our shareholders. We have focused on maximizing profitability while also investing in the future growth of the company.In terms of our balance sheet, we have maintained a strong financial position. Our total assets stand at $25 billion, with a healthy mix of cash, investments, and property. Our liabilities are well-managed, with a manageable level of debt and adequate provisions for future obligations.Looking ahead, we remain cautiously optimistic about the future. While the global economic environment remains uncertain, we are confident in our ability to navigate any challenges that may arise. We will continue to focus on innovation, customer satisfaction, and operational excellence to drive future growth and success.In conclusion, we are pleased with the strong performance in 2023. Our focus on delivering value to our customers and shareholders has paid off, and we are well-positioned for continued success in the future. We would like to express our gratitude to our employees, customers, and shareholders for their continued support, and we look forward to the opportunities and challenges that lie ahead.。
财务报表分析英文课件 (一)

财务报表分析英文课件 (一)Financial statement analysis is an essential tool for identifying the financial health of an organization, developing and evaluating strategies, and making investment decisions. The use of financial statements enables managers, investors, and other stakeholders to determine the financial performance, financial position, and cash flow of an organization. In this article, we will provide a comprehensive guide to financial statement analysis using an English PowerPoint presentation.1. Introduction to Financial Statement Analysis: The first slide or section should cover the essential concepts in financial statement analysis, such as what financial statements are, their purposes, and the tools and techniques used to analyze them. This section should also introduce the three primary financial statements; the income statement, the balance sheet, and the cash flow statement, and their respective formats.2. Analyzing the Income Statement: This section should cover the income statement's key elements, such as revenue, cost of goods sold, gross profit, operating expenses, and net income. The slide should highlight the different financial ratiosthat can be computed from these elements, such as the profit margin, gross margin, and EBITDA. The presentation should also include performance metrics like return on investment (ROI) or return on equity (ROE).3. Analyzing the Balance Sheet: This slide should introducethe balance sheet's structure and the key elements that makeup the balance sheet, such as assets, liabilities, and equity. This section should highlight the financial ratios that canbe computed from the balance sheet such as debt-to-equity ratio, current ratio, and quick ratio. This slide should also cover important financial metrics such as days sales outstanding, inventory turnover, and accounts payable turnover.4. Analyzing the Cash Flow Statement: This section shouldcover the cash flow statement's structure and the keyelements that make up the cash flow statement, such as operating cash flow, investing cash flow, and financing cash flow. The slide should highlight the financial ratios thatcan be computed from the cash flow statement, such as thecash conversion cycle and cash ratio. This slide should also cover important financial metrics such as free cash flow and capital expenditures.5. Interpreting Financial Statement Analysis Results: This section should cover how to interpret the findings in the analysis. The slide must cover how to interpret financialratios and how they relate to the organization's financial performance, including limitations and assumptions. This section should also cover how to use financial statement analysis to compare different organizations' financial performance and identify key trends.6. Conclusion: The presentation should conclude bysummarizing the key points and discussing the importance of financial statement analysis for investors, managers, and other decision-makers.In conclusion, financial statement analysis is an essential tool for evaluating an organization's financial status, helping to make decisions, and formulate strategies. The use of financial ratios and metrics enable decision-makers to analyze the financial performance, position, and cash flow of an organization. Whether you are an investor, executive, or decision-maker, financial statement analysis can provide insight into the organization's operations and guide your future decisions.。
- 1、下载文档前请自行甄别文档内容的完整性,平台不提供额外的编辑、内容补充、找答案等附加服务。
- 2、"仅部分预览"的文档,不可在线预览部分如存在完整性等问题,可反馈申请退款(可完整预览的文档不适用该条件!)。
- 3、如文档侵犯您的权益,请联系客服反馈,我们会尽快为您处理(人工客服工作时间:9:00-18:30)。
(2023)财务分析报告英文版课件(一)2023财务分析报告英文版课件Introduction•Overview of the company•Financial highlights of the yearAnalysis of Income Statement•Revenue growth•Gross profit margin•Operating expenses•Net incomeAnalysis of Balance Sheet•Current assets and liabilities•Long-term assets and liabilities•Debt to equity ratio•Working capitalAnalysis of Cash Flow Statement•Operating cash flow•Investing cash flow•Financing cash flow•Free cash flowKey Performance Indicators (KPIs)•Return on Investment (ROI)•Return on Equity (ROE)•Earnings per Share (EPS)•Debt to Asset RatioConclusion•Summary of analysis•Recommendations for future improvement•Outlook for the company’s financial performance in the coming year.Analysis of Income StatementRevenue growth•Analysis of revenue growth in comparison to previous years•Analysis of revenue growth in comparison to industry standards•Factors that contributed to the change in revenueGross profit margin•Analysis of the company’s gross profit margin in comparison to previous years•Analysis of the company’s gross profit margin in comparison to industry standards•Examination of factors that contributed to changes in gross profit marginOperating expenses•Analysis of operating expenses and how they have changed over time•Comparison of operating expenses with industry standards •Examination of factors that contributed to changes in operating expensesNet income•Analysis of the company’s net income over time •Comparison of net income with industry standards •Examination of factors that contributed to changes in net incomeAnalysis of Balance SheetCurrent assets and liabilities•Analysis of the company’s current assets and how they have changed over time•Examination of the company’s current liabilities and how they have changed•Calculation of the current ratio and analysis of what it signifiesLong-term assets and liabilities•Analysis of the company’s long-term assets and how they have changed over time•Examination of the company’s long-term liabilities and how they have changed•Calculation of the debt to equity ratio and analysis of what it signifiesWorking capital•Analysis of the company’s working capital and how it has changed over time•Comparison of the company’s working capital with industry standards•Examination of factors that contributed to changes in working capitalAnalysis of Cash Flow StatementOperating cash flow•Analysis of the company’s operating cash flow over time •Comparison of the operating cash flow with industry standards•Examination of factors that contributed to changes in operating cash flowInvesting cash flow•Analysis of the company’s investing cash flow over time •Comparison of the investing cash flow with industry standards•Examination of factors that contributed to changes in investing cash flowFinancing cash flow•Analysis of the company’s financing cash flow over time •Comparison of the financing cash flow with industry standards•Examination of factors that contributed to changes in financing cash flowFree cash flow•Calculation of the company’s free cash flow and analysis of what it signifies•Analysis of the company’s free cash flow over time •Comparison of the company’s free cash flow with industry standardsKey Performance Indicators (KPIs)Return on Investment (ROI)•Calculation of ROI and analysis of what it signifies •Analysis of the company’s ROI over time•Comparison of the company’s ROI with industry standardsReturn on Equity (ROE)•Calculation of ROE and analysis of what it signifies •Analysis of the company’s ROE over time•Comparison of the company’s ROE with industry standardsEarnings per Share (EPS)•Calculation of EPS and analysis of what it signifies •Analysis of the company’s EPS over time•Comparison o f the company’s EPS with industry standardsDebt to Asset Ratio•Calculation of debt to asset ratio and analysis of what it signifies•Analysis of the company’s debt to asset ratio over time •Comparison of the company’s debt to asset ratio with industry standardsConclusionSummary of analysis•Overview of the company’s financial performance•Key findings from the analysis of the income statement, balance sheet, and cash flow statement•Analysis of the company’s KPIs and what they signifyRecommendations for future improvement•Suggestions for how the company can improve its financial performance•Recommendations for changes in strategy or investmentsOutlook for the company’s financial performance in the coming year.•Analysis of expected changes in the company’s financial performance•Evaluation of factors that could impact the company’s financial performance in the coming year.。