1015_010 Interferometric monitoring of spindle and workpiece on an ultra-precision single-point diam
村田热敏电阻

7
!Note • Please read rating and !CAUTION (for storage, operating, rating, soldering, mounting and handling) in this catalog to prevent smoking and/or burning, etc.
1
2
3
Temperature Sensor and Compensation Chip Type Standard Land Pattern Dimensions Temperature Sensor and Compensation Chip Type Temperature Characteristics (Center Value) Temperature Sensor and Compensation Chip Type !Caution/Notice Temperature Sensor and Compensation Chip Type Package 5 Temperature Sensor Thermo String Type
R44E.pdf
Dec.17,2012
NTC Thermistor for Temperature Sensor Thermo String Type
(Part Number) qProduct ID Product ID NXF NTC Thermistors Sensor Thermo String Type NXF q T w 15 e XH r 103 t F A 2 B 025 !0 uLead Wire Type Code A Lead Wire Type ø0.3 Copper Lead Wire with Polyurethane Coat
Step-Down Switching Regulators
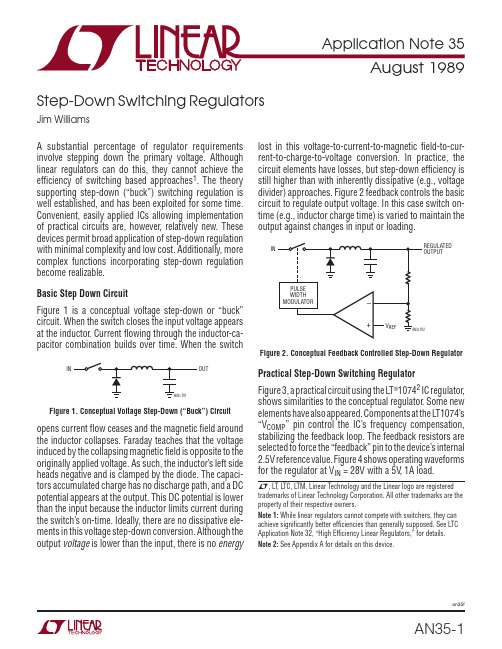
Step-Down Switching RegulatorsJim WilliamsA substantial percentage of regulator requirements involve stepping down the primary voltage. Although linear regulators can do this, they cannot achieve the effi ciency of switching based approaches 1. The theory supporting step-down (“buck”) switching regulation is well established, and has been exploited for some time. Convenient, easily applied ICs allowing implementation of practical circuits are, however , relatively new. These devices permit broad application of step-down regulation with minimal complexity and low cost. Additionally, more complex functions incorporating step-down regulation become realizable.Basic Step Down CircuitF igure 1 is a conceptual voltage step-down or “buck” circuit. When the switch closes the input voltage appears at the inductor . Current fl owing through the inductor-ca-pacitor combination builds over time. When the switchINFigure 1. Conceptual Voltage Step-Down (“Buck”) Circuitopens current fl ow ceases and the magnetic fi eld around the inductor collapses. Faraday teaches that the voltage induced by the collapsing magnetic fi eld is opposite to the originally applied voltage. As such, the inductor’s left side heads negative and is clamped by the diode. The capaci-tors accumulated charge has no discharge path, and a DC potential appears at the output. This DC potential is lower than the input because the inductor limits current during the switch’s on-time. Ideally, there are no dissipative ele-ments in this voltage step-down conversion. Although the output voltage is lower than the input, there is no energylost in this voltage-to-current-to-magnetic fi eld-to-cur-rent-to-charge-to-voltage conversion. In practice, thecircuit elements have losses, but step-down effi ciency is still higher than with inherently dissipative (e.g., voltage divider) approaches. Figure 2 feedback controls the basic circuit to regulate output voltage. In this case switch on-time (e.g., inductor charge time) is varied to maintain the output against changes in input or loading.INFigure 2. Conceptual Feedback Controlled Step-Down RegulatorPractical Step-Down Switching RegulatorFigure 3, a practical circuit using the L T ®10742 IC regulator , shows similarities to the conceptual regulator . Some new elements have also appeared. Components at the L T1074’s “V COMP ” pin control the IC’s frequency compensation, stabilizing the feedback loop. The feedback resistors are selected to force the “feedback” pin to the device’s internal 2.5V reference value. F igure 4 shows operating waveforms for the regulator at V IN = 28V with a 5V , 1A load.L , L T , L TC, L TM, Linear Technology and the Linear logo are registered trademarks of Linear Technology Corporation. All other trademarks are the property of their respective owners.Note 1: While linear regulators cannot compete with switchers, they can achieve signifi cantly better effi ciencies than generally supposed. See L TC Application Note 32, “High Effi ciency Linear Regulators,” for details.Note 2: See Appendix A for details on this device.T race A is the V SW pin voltage and T race B is its current. Inductor current 3 appears in T race C and diode current is T race D. Examination of the current waveforms allows determination of the V SW and diode path contributions to inductor current. Note that the inductor current’s waveform occurs on top of a 1A DC level. Figure 5 shows signifi cant duty cycle changes when V IN is reduced to 12V . The lower input voltage requires longer inductor charge times to maintain the output. The L T1074 controls inductor charge characteristics (see Appendix A for operating details), with resulting waveform shape and time proportioning changes.F igure 6 compares this circuit’s effi ciency with linear regulators in a common and important situation. Effi cient regulation under varying AC line conditions is a frequent requirement. The fi gure assumes the AC line has been transformed down to acceptable input voltages. The input voltages shown correspond to the AC line voltages given on the horizontal axis. Effi ciency for the LM317 and L T1086 linear regulators suffers over the wide input range.Note 3: Methods for selecting appropriate inductors are discussed in Appendix B.L1V INFigure 3. A Practical Step-Down Regulator Using the L T1074Figure 4. Waveforms for the Step-Down Regulator at V IN = 28V and V OUT = 5V at 1AAC LINE VOLTAGE800E F F I C I E N C Y (%)20406090100110120AN35 F06130801001030507090140Figure 6. Efficiency vs AC Line Voltage for the LT1074. LT1086 and LM317 Linear Regulators are Shown for ComparisonFigure 5. Waveforms for the Step-Down Regulator at V IN = 12V and V OUT = 5V at 1AA = 20V/DIVB = 1A/DIV D = 1A/DIVHORIZ = 5μs/DIVAN35 F04C = 0.2A/DIV ON 1A DC LEVELA = 20V/DIVB = 1A/DIV D = 1A/DIVHORIZ = 5μs/DIVAN35 F05C = 0.2A/DIV ON 1A DC LEVELThe L T1086 is notably better because its lower dropout voltage cuts dissipation over the range. Switching pre-regulation 4 can reduce these losses, but cannot equal the L T1074’s performance. The plot shows minimum effi ciency of 83%, with some improvement over the full AC line excursion. Figure 7 details performance. Effi ciency approaches 90% as input voltage rises. This is due to minimization of the effects of fi xed diode and L T1074 junc-tion losses as input increases. At low inputs these losses are a higher percentage of available supply, degrading effi ciency. Higher inputs make the fi xed losses a smaller percentage, improving effi ciency. Appendix D presents detail on optimizing circuitry for effi ciency.Note 4: See Reference 1.Dual Output Step-Down RegulatorFigure 8, a logical extension of the basic step-down con-verter , provides positive and negative outputs. The circuit is essentially identical to Figure 3’s basic converter with the addition of a coupled winding to L1. This fl oating winding’s output is rectifi ed, fi ltered and regulated to a –5V output. The fl oating bias to the L T1086 positive voltage regulator permits negative outputs by assigning the regulator’s output terminal to ground. Negative output power is set by fl ux pick-up from L1’s driven winding. With a 2A load at the +15 output the –5V output can supply over 500mA. Because L1’s secondary winding is fl oating its output may be referred to any point within the breakdown capability of the device. Hence, the secondary output could be 5V or , if stacked on the +15 output, 20V .Negative Output RegulatorsNegative outputs can also be obtained with a simple 2-ter-minal inductor . Figure 9 demonstrates this by essentially grounding the inductor and steering the catch diodes negative current to the output. A1 facilitates loop closure by providing a scaled inversion of the negative output to the L T1074’s feedback pin. The 1% resistors set the scale factor (e.g., output voltage) and the RC network around A1 gives frequency compensation. Waveforms for this circuit are reminiscent of Figure 5, with the exception that diodeINPUT VOL TAGEE F F I C I E N C Y (%)608010024AN35 F0740205070903010012101614202226183028Figure 7. Efficiency Plot for Figure 3. Higher Input Voltages Minimize Effects of Saturation Losses, Resulting in Increased EfficiencyL1: PULSE ENGINEERING, INC. #PE-6505028VINPUTAN35 F08Figure 8. Coupled Inductor Provides Positive and Negative Outputscurrent (T race D) is negative. T races A, B and C are V SW voltage, inductor current and V SW current respectively.Figure 11, commonly referred to as “Nelson’s Circuit,” provides the same function as the previous circuit, but eliminates the level-shifting op amp. This design accom-plishes the level shift by connecting the L T1074’s “ground” pin to the negative output. Feedback is sensed from circuit ground, and the regulator forces its feedback pin 2.5V above its “ground” pin. Circuit ground is common to input and output, making system use easy. Operating waveforms are essentially identical to Figure 10. Advantages of the previous circuit compared to this one are that the L T1074 package can directly contact a grounded heat sink and that control signals may be directly interfaced to the ground referred pins.The inductor values in both negative output designs are notably lower than in the positive case. This is necessitatedby the reduced loop phase margin of these circuits. Higher inductance values, while preferable for limiting peak cur-rent, will cause loop instability or outright oscillation.Current-Boosted Step-Down RegulatorF igure 12 shows a way to obtain signifi cantly higher output currents by utilizing effi cient energy storage in the L T1074 output inductor . This technique increases the duty cycle over the standard step-down regulator allowing more energy to be stored in the inductor . The increased output current is achieved at the expense of higher output voltage ripple.The operating waveforms for this circuit are shown in Figure 13. The circuit operating characteristics are similar to that of the step-down regulator (Figure 3). During the V SW (T race A) “on” time the input voltage is applied to one end of the coupled inductor . Current through the V SW pin (T race B) ramps up almost instantaneously (since inductor current (T race F) is present) and then slows as energy is stored in the core. The current proceeds into the inductor (T race D) and fi nally is delivered to the load. When the V SW pin goes off, current is no longer available to charge the inductor . The magnetic fi eld collapses, causing the V SW pin voltage to go negative. At this point similarity with the basic regulator vanishes. In this modifi ed version the output current (T race F) receives a boost as the magnetic fi eld collapses. This results when the energy stored in12V INPUT–5V OUTPUTFigure 9. A Negative Output Step-Down RegulatorFigure 10. Figure 9’s WaveformsA = 20V/DIVB = 1A/DIV D = 4A/DIVHORIZ = 5μs/DIVAN35 F10C = 4A/DIVthe core is transferred to the output. This current step circulates through C1 and D2 (T race E), somewhat increas-ing output voltage ripple. Not all the energy is transferred to the “1” winding. Current (T race C) will continue to fl ow in the “N” winding due to leakage inductance. A snubber network suppresses the effects of this leakage inductance. For lowest snubber losses the specifi ed tapped inductor is bifi lar wound for maximum coupling.Post Regulation-Fixed CaseIn most instances the L T1074 output will be applied directly to the load. Those cases requiring faster transient responseor reduced noise will benefi t from linear post regulation. In F igure 14 a 3-terminal regulator follows the L T1074 output. The L T1074 output is set to provide just enough voltage to the L T1084 to maintain regulation. The L T1084’s low dropout characteristics combined with a high circuit input voltage minimizes the overall effi ciency penalty.OUT VFigure 11. Nelson’s Circuit...A (Better) Negative Output Step-Down Regulator5V OUT10AVFigure 12. “Current Boosted” Step-Down Regulator. Boost Current is Supplied By Energy Stored in the Tapped InductorFigure 13. AC Current Flow for the Boosted RegulatorA = 50V/DIVB = 5A/DIVD = 10A/DIVE = 10A/DIVF = 10A/DIVHORIZ = 2μs/DIV AN35 F10C = 10A/DIVPost Regulation-Variable CaseSome situations require variable linear post regulation. F igure 15 does this with little effi ciency sacrifi ce. The L T1085 operates in normal fashion, supplying a variable 1.2V to 28V output. The remainder of the circuit forms a switched mode pre-regulator which maintains a small, fi xed voltage across the L T1085 regardless of its output voltage. A1 biases the L T1074 to produce whatever voltage is necessary to maintain the “E diodes” potential across the L T1085. A1’s inputs are balanced when the L T1085 output is “E diodes” above its input. A1 maintains this condition regardless of line, load or output voltage conditions. Thus, good effi ciency is maintained over the full range of output voltages. The RC network at A1 compensates the loop. Loop start-up is assured by deliberately introduc-ing a positive offset to A1. This is done by grounding A1’s appropriate balance pin (5), resulting in a positive 6mV offset. This increases amplifi er drift, and is normally considered poor practice, but causes no measurable error in this application.As shown, the circuit cannot produce outputs below the L T1085’s 1.2V reference. Applications requiring output adjustability down to 0V will benefi t from option “A” shown on the schematic. This arrangement replaces L1 with L2. L2’s primary performs the same function as L1 and its coupled secondary winding produces a negative bias output (–V). The full-wave bridge rectifi cation is necessitated by widely varying duty cycles. A2 and its at-tendant circuitry replace all components associated withthe L T1085 V ADJ pin. The L T1004 reference terminates the 10k to 250k feedback string at –1.2V with A2 provid-ing buffered drive to the L T1085 V ADJ pin. The negative bias allows regulated L T1085 outputs down to 0V . The –V potential derived from L2’s secondary varies consider-ably with operating conditions. The high feedback string values and A2’s buffering ensure stable circuit operation for “starved” values of –V .Low Quiescent Current RegulatorsMany applications require very wide ranges of power sup-ply output current. Normal conditions require currents in the ampere range, while standby or “sleep” modes draw only microamperes. A typical laptop computer may draw 1 to 2 amperes running while needing only a few hundred microamps for memory when turned off. In theory, any regulator designed for loop stability under no-load condi-tions will work. In practice, a converter’s relatively large quiescent current may cause unacceptable battery drain during low output current intervals. Figure 16’s simple loop effectively reduces circuit quiescent current from 6mA to only 150μA. It does this by utilizing the L T1074’s shutdown pin. When this pin is pulled within 350mV of ground the IC shuts down, pulling only 100μA. Comparator C1 combines with the L T1004 reference and Q1 to form a “bang-bang” control loop around the L T1074. The L T1074’s internal feedback amplifi er and voltage reference are by-passed by this loop’s operation. When the circuit output (T race C, Figure 17) falls slightly below 5V C1’s output (T race A) switches low, turning off Q1 and enabling theL1V IN5V OUTFigure 14. Linear Post-Reglator Improves Noise and T ransient ResponseL1: PULSE ENGINEERING, INC. #PE-51516L2: PULSE ENGINEERING, INC. #PE-6505035V INPUTOUTAN35 F15OPTION “A”(FOR OUTPUT DOWN TO 0V)SEE TEXT FOR DISCUSSIONL112V INPUT5V OUTFigure 15. Adjustable Linear Post-Regulator Maintains Efficiency Over Widely Varying Operating ConditionsFigure 16. A Simple Loop Reduces Quiescent Current to 150μAL T1074. The V SW pin (T race B) pulses at full duty cycle, forcing the output back above 5V . C1 then biases Q1 again, the L T1074 goes into shutdown, and loop action repeats.The frequency of this on-off control action is directly load dependent, with typical repetition rates of 0.2Hz at no load. Short on-times keep duty cycle low, resulting in the small effective quiescent current noted. The on-off operation combines with the LC fi ltering action in the regulator’s V SW line to generate an output hysteresis of about 50mV (again, see Figure 17, T race C).The loop performs well, but has two potential drawbacks. At higher output currents the loop oscillates in the 1kHz to 10kHz range, causing audible noise which may be objec-tionable. This is characteristic of this type of loop, and is the reason that ICs employing gated oscillators invariably produce such noise. Additionally, the control loops opera-tion causes about 50mV of ripple on the output. Ripple frequency ranges from 0.2Hz to 10kHz depending upon input voltage and output current.Figure 18’s more sophisticated circuit eliminates these problems with some increase in complexity. Quiescent current is maintained at 150μA. The technique shown is particularly signifi cant, with broad implication in battery powered systems. It is easily applied to a wide variety of regulator requirements, meeting an acknowledged need across a wide spectrum of applications.Figure 18’s signal fl ow is similar to Figure 16, but ad-ditional circuitry appears between the feedback divider and the L T1074. The L T1074’s internal feedback amplifi er and reference are not used. Figure 19 shows operatingFigure 17. The Low Quiescent Current Loop’s WaveformsV IN–+12VFigure 18. A More Sophisticated Loop Gives Better Regulation While Maintaining 150μA Quiescent CurrentA = 10V/DIVB = 10V/DIV HORIZ = 100μs/DIVAN35 F17C = 0.1V/DIV AC-COUPLED ON 5V DC LEVELwaveforms under no-load conditions. The output (T race A) ramps down over a period of seconds. During this time comparator A1’s output (T race B) is low, as are the 74C04 paralleled inverters. This pulls the V C pin (T race D) low, forcing the regulator to zero duty cycle. Simultaneously, A2 (T race C) is low, putting the L T1074 in its 100μA shutdown mode. The V SW pin (T race E) is off, and no inductor current fl ows. When the output drops about 60mV , A1 triggers and the inverters go high, pulling the V C pin up and biasing the regulator . The Zener diode prevents V C pin overdrive. A2 also rises, taking the IC out of shutdown mode. The V SW pin pulses the inductor at the 100kHz clock rate, causing the output to abruptly rise. This action trips A1 low, forcing the V C pin back low and shutting off V SW pulsing. A2 also goes low, putting the L T1074 into shutdown.This “bang-bang” control loop keeps the 5V output within the 60mV ramp hysteresis window set by the loop. Note that the loop oscillation period of seconds means the R1-C1time constant at V C is not a significant term. Because the L T1074 spends almost all of the time in shutdown, very little quiescent current (150μA) is drawn.Figure 20 shows the same waveforms with the load in-creased to 2mA. Loop oscillation frequency increases to keep up with the load’s sink current demand. Now, the V C pin waveform (T race D) begins to take on a fi ltered ap-pearance. This is due to R1-C1’s 10ms time constant. If the load continues to increase, loop oscillation frequency will also increase. The R1-C1 time constant, however , is fi xed. Beyond some frequency, R1-C1 must average loop oscillations to DC. At 7mA loading (Figure 21) loop fre-quency further increases, and the V C waveform (T race D) appears heavily fi ltered.Figure 22 shows the same circuit points at 2A loading. Note that the V C pin is at DC, as is the shutdown pin. Repetition rate has increased to the L T1074’s 100kHzFigure 19. Low Quiescent Current Regulator’s Waveforms with No Load (T races B, C and E Retouched for Clarity)Figure 20. Low Quiescent Current Regulator’s Waveforms at 2mA LoadingFigure 21. Low Quiescent Current Regulator’s Waveforms at 7mA Loading Figure 22. Low Quiescent Current Regulator’s Waveforms at 2A LoadingA = 0.1V/DIV AC-COUPLEDB = 20V/DIV HORIZ = 0.5 SECOND/DIVAN35 F19C = 20V/DIVD = 2V/DIVE = 10V/DIVA = 0.1V/DIV AC-COUPLEDB = 20V/DIV HORIZ = 20ms/DIVAN35 F20C = 20V/DIVD = 2V/DIVE = 10V/DIVA = 0.1V/DIV AC-COUPLEDB = 20V/DIV HORIZ = 10ms/DIVAN35 F21C = 20V/DIVD = 2V/DIVE = 10V/DIVA = 0.2V/DIV AC-COUPLEDB = 20V/DIV HORIZ—TRACES A AND E = 10μs/DIV TRACES B, C, D = 5ms/DIVAN35 F22C = 20V/DIVD = 2V/DIVE = 20V/DIVclock frequency. Figure 23 plots what is occurring, with a pleasant surprise. As output current rises, loop oscilla-tion frequency also rises until about 23Hz. At this point the R1-C1 time constant fi lters the V C pin to DC and the L T1074 transitions into “normal” PWM operation. With the V C pin at DC it is convenient to think of A1 and the inverters as a linear error amplifi er with a closed-loop gain set by the R2-R3 feedback divider . In fact, A1 is still duty cycle modulating, but at a rate far above R1-C1’s break frequency. The phase error contributed by C2 (which was selected for low loop frequency at low output currents) is dominated by the R1-C1 roll off and the C3 lead into A1. The loop is stable and responds linearly for all loads beyond 10mA. In this high current region the L T1074 is desirably “fooled” into behaving like a conventional step-down regulator .A formal stability analysis for this circuit is quite complex, but some simplifi cations lend insight into loop operation. At 250μA loading (20kΩ) C2 and the load form a decay time constant exceeding 30 seconds. This is orders of magnitude larger than R2-C3, R1-C1, or the L T1074’s 100kHz commutation rate. As a result, C2 dominates the loop. Wideband A1 sees phase shifted feedback, and very low frequency oscillations similar to Figure 19’s occur 5. Although C2’s decay time constant is long, its charge time constant is short because the circuit has low sourc-ing impedance. This accounts for the ramp nature of the oscillations.Increased loading reduces the C2-load decay time con-stant. Figure 23’s plot refl ects this. As loading increases,the loop oscillates at a higher frequency due to C2’s de-creased decay time. When the load impedance becomes low enough C2’s decay time constant ceases to dominate the loop. This point is almost entirely determined by R1 and C1. Once R1 and C1 “take over” as the dominant time constant the loop begins to behave like a linear system. In this region (e.g., above about 10mA, per Figure 23) the L T1074 runs continuously at its 100kHz rate. Now, C3 becomes signifi cant, performing as a simple feedback lead 6 to smooth output response. There is a fundamental trade-off in the selection of the C3 lead value. When the converter is running in its linear region it must dominate the loops time lag generated hysteretic characteristic. As such, it has been chosen for the best compromise between output ripple at high load and loop transient response.Despite the complex dynamics transient response is quite good. Figure 24 shows performance for a step from no load to 1A. When T race A goes high a 1A load appears across the output (T race C). Initially, the output sags al-most 200mV due to slow loop response time (the R1-C1 pair delay V C pin (T race B) response). When the L T1074 comes on response is reasonably quick and surprisingly well behaved considering circuit dynamics. The multi-time constant recovery 7 (“rattling” is perhaps more appropriate) is visible in T race C’s response.Note 5: Some layouts may require substantial trace area to A1’s inputs. In such cases the optional RC network around A1 ensures clean transitions at A1’s output.Note 6: “Zero Compensation” for all you technosnobs out there.Note 7: Once again, “multi-pole settling” for those who adore jargon.OUTPUT (mA)L O O P F R E Q U E N C Y (H z )4812162468AN35 F23101220Figure 23. Figure 18’s Loop Frequency vs Output Current. Note Linear Loop Operation Above 10mAFigure 24. Load T ransient Response for Figure 18A = 10V/DIVB = 2V/DIVHORIZ = 5ms/DIVAN35 F24C = 0.2V/DIV ON 5V DC LEVELF igure 25 plots effi ciency versus output current. High power effi ciency is similar to standard converters. Low power effi ciency is somewhat better , although poor in the lowest ranges. This is not particularly bothersome, as power loss is very small.The loop provides a controlled, conditional instability instead of the usually more desirable (and often elusive) unconditional stability. This deliberately introduced char-acteristic dramatically lowers converter quiescent current without sacrifi cing high power performance.a toroidal DC/DC converter comprised of L1, Q1 and Q2. Q1 and Q2 receive out of phase square wave drive from the 74C74 ÷ 4 fl ip-fl op stage and the L T1010 buffers. The fl ip-fl op is clocked from the L T1074 V SW output via the Q3 level shifter . The L T1086 provides 12V power for A1 and the 74C74. A1 biases the L T1074 regulator to produce the DC input at the DC/DC converter required to balance to loop. The converter has a voltage gain of about 20, resulting in high voltage output. This output is resistively divided down, closing the loop at A1’s negative input. Frequency compensation for this loop must accommodate the signifi -cant phase errors generated by the L T1074 confi guration, the DC/DC converter and the output LC fi lter . The 0.47μF roll-off term at A1 and the 100Ω-0.15μF RC lead network provide the compensation, which is stable for all loads.Figure 27 gives circuit waveforms at 500V output into a 100W load. T race A is the L T1074 V SW pin while T race B is its current. T races C and D are Q1 and Q2’s drain waveforms. The disturbance at the leading edges is due to cross-current conduction, which lasts about 300ns—a small percent-age of the cycle. T ransistor currents during this interval remain within reasonable values, and no overstress or dissipation problems occur . This effect could be eliminated with non-overlapping drive to Q1 and Q28, although there would be no reliability or signifi cant effi ciency gain. The 500kHz ringing on the same waveforms is due to excita-tion of transformer resonances. These phenomena are not deleterious, although L1’s primary RC damper is included to minimize them.All waveforms are synchronous because the fl ip-fl op drive stage is clocked from the L T1074 V SW output. The L T1074’s maximum 95% duty cycle means that the Q1-Q2 switches can never see destructive DC drive. The only condition allowing DC drive occurs when the L T1074 is at zero duty cycle. This case is clearly non-destructive, because L1 receives no power .Figure 28 shows the same circuit points as Figure 27, but at only 5mV output. Here, the loop restricts drive to the DC/DC converter to small levels. Q1 and Q2 chop just 70mV into L1. At this level L1’s output diode drops look large, but loop action forces the desired 0.005V output.OUTPUT CURRENTE F F I C I E N C Y (%)6080100 2.0AN35 F254020507090301000.51.01.52.5Figure 25. Efficiency vs Output Current for Figure 18. Standby Efficiency is Poor , But Power Loss Approaches Battery Self-DischargeWide Range, High Power , High Voltage Regulator BEFORE PROCEEDING ANY FURTHER, THE READER IS WARNED THAT CAUTION MUST BE USED IN THE CONSTRUCTION, TESTING AND USE OF THIS CIRCUIT . HIGH VOL TAGE, LETHAL POTENTIALS ARE PRESENT IN THIS CIRCUIT . EXTREME CAUTION MUST BE USED IN WORKING WITH AND MAKING CONNECTIONS TO THIS CIRCUIT . REPEAT : THIS CIRCUIT CONTAINS DANGER-OUS, HIGH VOL TAGE POTENTIALS. USE CAUTION.Figure 26 is an example of the L T1074 making a complex function practical. This regulator provides outputs from mil-livolts to 500V at 100W with 80% effi ciency. A1 compares a variable reference voltage with a resistively scaled version of the circuit’s output and biases the L T1074 switching regulator confi guration. The switcher’s DC output drivesNote 8: For an example of this technique see L TC Application Note 29, Figure 1.T 28V I N100μS O L I T A N T A L U F i g u r e 26. L T 1074 P e r m i t s H i g h V o l t a g e O u t p u t O v e r 100d B R a n g e w i t h P o w e r a n d E f f i c i e n c y .D A N G E R ! L e t h a l P o t e n t i a l s P r e s e n t —S e e T e x tThe L T1074’s switched mode drive to L1 maintains high effi ciency at high power , despite the circuits wide output range 9.Figure 29 shows output noise at 500V into a 100W load. Q1-Q2 chopping artifacts and transformer related ringing are clearly visible, although limited to about 80mV . The coherent noise characteristic is traceable to the synchro-nous clocking of Q1 and Q2 by the L T1074.A 50V to 500V step command into a 100W load produces the response of Figure 30. Loop response on both edgesis clean, with the falling edge slightly underdamped. This slew asymmetry is typical of switching confi gurations, because the load and output capacitor determine negative slew rate. The wide range of possible loads mandates a compromise when setting frequency compensation. The falling edge could be made critically or even over damped, but response time for other conditions would suffer . The compensation used seems a reasonable compromise.Note 9: A circuit related to the one presented here appears in the L TC Application Note 18 (Figure 13). Its linear drive to the step-up DC/DC converter forces dissipation, limiting output power to about 15W . Similar restrictions apply to Figure 7 in Application Note 6.Figure 27. Figure 26’s Operating Waveforms at 500V Output into a 100W LoadFigure 28. Figure 26’s Operating Waveforms at 0.005V OutputFigure 29. Figure 26’s Output Noise at 500V into a 100W Load. Residue is Composed of Q1-Q2 Chopping Artifacts and T ransformer Related Ringing. DANGER! Lethal Potentials Present—See TextFigure 30. 500V Step Response with 100W Load (Photo Retouched for Clarity). DANGER! Lethal Potentials Present—See TextA = 50V/DIVB = 5A/DIVHORIZ = 10μs/DIVAN35 F27C = 50V/DIVD = 50V/DIVA = 5V/DIVB = 50mA/DIVHORIZ = 10μs/DIVAN35 F28C = 0.1V/DIVD = 0.1V/DIVA = 0.05V/DIV AC-COUPLED ON 500V LEVELHORIZ = 20μs/DIVAN35 F29A = 100V/DIVHORIZ = 50ms/DIVAN35 F30。
FDA无菌加工生产的无菌药品指南中英文对照版

监控程序
VI. COMPONENTS AND CONTAINER/CLOSURES .................................................... 27
药品成分和容器 /密封 A. Components..................................................................................................................................27
法规架构 B. Technical Framework .......................................................................................................iologics Evaluation and Research Food and Drug Administration
1401 Rockville Pike, Rockville, MD 20852-1448 /cber/guidelines.htm.
辅助洁净区域 C. Clean Area Separation ................................................................................................................ 11
净化区的隔离 D. Air Filtration ................................................................................................................................ 12
CCNA第二学期第二章考试答案
以下是针对您未获得满分的试题给出的反馈。
某些交互式试题可能不显示您的答案。
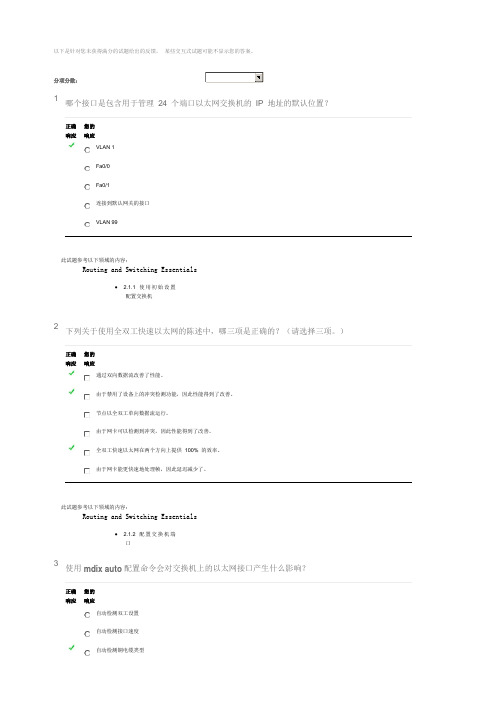
分项分数:1哪个接口是包含用于管理24 个端口以太网交换机的IP 地址的默认位置?正确响应您的响应VLAN 1Fa0/0Fa0/1连接到默认网关的接口VLAN 99此试题参考以下领域的内容:Routing and Switching Essentials• 2.1.1 使用初始设置配置交换机2下列关于使用全双工快速以太网的陈述中,哪三项是正确的?(请选择三项。
)正确响应您的响应通过双向数据流改善了性能。
由于禁用了设备上的冲突检测功能,因此性能得到了改善。
节点以全双工单向数据流运行。
由于网卡可以检测到冲突,因此性能得到了改善。
全双工快速以太网在两个方向上提供100% 的效率。
由于网卡能更快速地处理帧,因此延迟减少了。
此试题参考以下领域的内容:Routing and Switching Essentials• 2.1.2 配置交换机端口3使用mdix auto 配置命令会对交换机上的以太网接口产生什么影响?正确响应您的响应自动检测双工设置自动检测接口速度自动检测铜电缆类型自动将第一个检测到的MAC 地址分配给接口此试题参考以下领域的内容:Routing and Switching Essentials• 2.1.2 配置交换机端口4在Cisco IOS 软件无法加载的情况下,网络管理员需要哪种类型的电缆将PC 与交换机连接才能恢复它?正确响应您的响应同轴电缆控制台电缆交叉电缆直通电缆因为交换机上没有运行Cisco IOS 软件,所以管理员需要使用控制台电缆将PC 连接到交换机控制台端口,比便将来自PC 的软件转移到交换机。
此试题参考以下领域的内容:Routing and Switching Essentials• 2.1.1 使用初始设置配置交换机5在对连接问题进行故障排除时,网络管理员发现交换机端口状态LED 在绿色和琥珀色之间跳转。
基于流式细胞术快速定量分析小鼠角膜组织中嗜中性粒细胞方法的建立

-实验研究-基于流式细胞术快速定量分析小鼠角膜组织中嗜中性粒细胞方法的建立薛芸霞刘俊李志杰暨南大学眼表疾病国际协同创新研究中心再生医学教育部重点实验室,广州510632通信作者:李志杰,Email:zhijielee@yyhov.dm【摘要】目的建立一种基于流式细胞术快速定量分析小鼠角膜组织中嗜中性粒细胞的技术和方法'方法选取6〜8周龄SPF级雌性C57BL/6小鼠15只,使用高尔夫样刀机械性刮除小鼠角膜上皮细胞层,生成直径2mm的创面,在创伤后18h切除带有完整角膜缘的小鼠角膜,采用胶原酶I和DNA酶联合消化法获得单细胞悬液,采用FACSCato流式细胞分析仪画门技术分选角膜细胞中嗜中性粒细胞的数量0另取6只小鼠,应用随机数字表法分为创伤组和正常组,每组3只,使用抗CD45、Ly6G和CD11b荧光抗体进行角膜细胞染色,计数并比较未创伤和创伤角膜中嗜中性粒细胞的数量变化'结果建立流式细胞仪检测角膜组织中嗜中性粒细胞的分析流程0CD45+细胞占角膜组织所有细胞的比例为(20.93±1.72) %,在角膜CD45+细胞群中可分选出Ly6G m CD11b+双阳性嗜中性粒细胞群,Ly6G m和CD11b+细胞在CD45+细胞中所占比例分别为(75.50±3.25) %和(93.40±4,53) %,Ly6G+和CD11b+共阳性细胞占角膜组织CD45+细胞的比例为(67.33±2.80) %。
创伤后18h,角膜中角膜缘募集嗜中性粒细胞数量为(151.47±10,82) %,多于正常角膜的(15.36土1.02)%,差异有统计学意义(e21.689,R<0.01)o结论流式细胞检测方法可快速、准确地定量分析创伤角膜中嗜中性粒细胞群,为进一步评价不同原因造成角膜炎症反应中嗜中性粒细胞的数量变化提供了一种快速定量分析方法0【关键词】角膜;流式细胞术;嗜中性粒细胞基金项目:国家自然科学基金项目(81770962、81700808);广东省自然科学基金项目(2018A030310605);广东省医学科研基金项目(A2020318)DOI:10.3760/115989-20200429-00297Protocol for the rapid quantitative analysit of neuhophilt ic mouse cornea by flow cytometryXue Yunxia,Lit Jun, Li ZhijiiOcular Surface Diseass Research Center,Jinan Universpy School o Medine,Guangzhou510632,ChinaCorrespooding author:Li Zhijii, Emait:e0ijiele e@y ahoo,com[Abstract]Objective To provide a standard protocol for the rapid quantitative analysis of neutrophils ininfamed ccrnees with Oow cytomety.Methods The ccrneet epithelium layer of15C57BL/6micc(6-8weeksold)was mechaniccl l y scraped off using a golf-like knife to generate a2mm wound region.The mouse ccrneas withintact liebus were cut out at18hour after abrasion.After mechanical shredding,the single ccl l suspension wasobtained by ccnaaenase I and DNase dieestion.Then,the number of neutrophils in the ccrneet co H s was sorted under theFACSCantofeow cetometeeu)ingthegatetechnique.Anothee6miceweeetaken and eandomized intowoundedgeoup and noemaegeoup accoedingtoaeandom numbeetabeemethod,with3micein each g eoup.Co en ea ec e e stainingwas performed using nuoresccnt-ccnjugated anti-mouse CD45,Ly6G,and CD11b antibodies.The number ofneutophiesin theconeasofthetwogoupsweeenumeated and compaed.Theuseand caeoftheanimaescompeiedwith the Statement of the Association for Reseerch in Vision and Ophthalmolocy(ARVO).The study protoccl wasapproved by the Animal Ethicc Committee of Medical Colleee of Jinan University( No.JN-A-2002-01).Reselts Astandard proccdure for detecting neutrophils in the ccrnee by fow cctomety was established.The ratio of CD45+ccllsin th etota eco en ea etissu ec e e popu eation was(20.93±1.72) %.TheLe6G+and CD11b+doub eepositi een eut eophi epopulation was sorted in the wounded ccrneet cel l population.The ratios of Ly6G+and CD116+cclls in the CD45+ce e s weee( 75.50±3.25) %and( 93.40±4.53) %,eespectieeee,and th e eatio oSth eL e6G+and CD11b+doubee positieeneuteophiesin thetotaenumbeeo CD45+ce e s was(67.33±2.80) %.In addition,thenumbeeo neuteophiesrecruited to the cornea at18hourr after ccrneet abrasion was(151.47±10.82) %,which was higher than(15.36±1.02) %in the normal cornea( h21.689,P<0.01).Conclusions Flow cctomety can quickly and accurately quantitatieeeeanaeezetheneuteophiepopueation in thewounded coenea.Itpeoeidesaeapid quantitatieeanaeesismethodto further evaluate the changes of neumophns in corneal in—ammation caused by different reesont.[Key words]Cornea;Flow cytometra;NeutrophiisFund program:National Natural Science Foundation of China(81770962,81700808);NaturaS Science Foundation of Guangdong Province of China(2018A030310605);The Medicai Sciencc and Technology Research Fund of Guangdong Grant(A2020318)DOI:10.3760/115989-20200429-00297角膜约占整个视觉系统屈光力的1/3,其正常结构和透明状态的维持是正常视觉功能的重要保障+一3」。
MSH错误信息代码表

MSH错误信息一览表错误代码显示信息原因处理方法EQ0001 Head inclination measurement impossible 进行取消设定测量时,吸嘴1设定成NGEQ0025 Y--axis origin 通过副操作盘旋转主轴时,Y轴在原点①按亮副操作盘键②用MANUAL JOG 功能,将Y轴移出原点EQ0031 Cam axis origin detection error A ①凸轮轴皮带坏①更换皮带②凸轮轴原点检测器失效或②更换或清洗检测器有脏物附着③调整槽盘位置③原点检测用槽盘错位EQ0032 Cam axis origin detection error B ①凸轮轴皮带坏①更换皮带②凸轮轴原点检测器失效或②更换或清洗检测器有脏物附着③调整槽盘位置③原点检测用槽盘错位EQ0046 Nozzle origin check sensor error 吸嘴原点没有到位①检查原点传感器位置②检查接口③调整传感器灵敏度④用手将吸嘴转至原点EQ0053 S nozzle suction bad warning 小吸嘴吸着不良报警并被自动跳跃①清洗吸嘴更换过滤②检查吸嘴安装情况③重新测定吸嘴高度和中心④更换吸嘴⑤检查部品库参数设置⑥检查厚度传感器是否被异物遮盖⑦检查真空泵是否开启⑧检查料架供料情况EQ0054 M nozzle suction bad warning 中号吸嘴吸着不良报警并被自动跳跃①清洗吸嘴更换②检查吸嘴安装情况③重新测定吸嘴高度和中心④更换吸嘴⑤检查部品库参数设置⑥检查厚度传感器是否被异物遮盖⑦检查真空泵是否开启⑧检查料架供料情况EQ0055 L nozzle suction bad warning 大号吸嘴吸着不良报警并被自动跳跃①清洗吸嘴更换过②检查吸嘴安装情况③重新测定吸嘴高度和中心④更换吸嘴⑤检查部品库参数设置⑥检查厚度传感器是否被异物遮盖⑦检查真空泵是否开启⑧检查料架供料情况EQ0056 S nozzle recognition bad warning 小号吸嘴识别不良报警并被自动跳跃①清洗吸嘴③重新测定吸嘴高度和中心④更换吸嘴⑤检查部品库参数设置⑥检查厚度传感器是否被异物遮盖⑦检查真空泵是否开启⑧检查料架供料情况EQ0057 M nozzle recognition bad warning 中号吸嘴识别不良报警并被自动跳跃①清洗吸嘴②检查吸嘴安装情况③重新测定吸嘴高度和中心④更换吸嘴⑤检查部品库参数设置⑥检查厚度传感器是否被异物遮盖⑦检查真空泵是否开启⑧检查料架供料情况EQ0058 L nozzle recognition bad warning 大号吸嘴识别不良报警并被自动跳跃①清洗吸嘴②检查吸嘴安装情况③重新测定吸嘴高度和中心④更换吸嘴⑤检查部品库参数设置⑥检查厚度传感器是否被异物遮盖⑦检查真空泵是否开启⑧检查料架供料情况EQ0059 S nozzle switch bad warning 小号吸嘴切换不良报警并被自动跳跃①清洗吸嘴更换过②检查吸嘴安装情况③重新测定吸嘴高度和中心④更换吸嘴⑤检查部品库参数设置⑥检查厚度传感器是否被异物遮盖⑦检查真空泵是否开启⑧检查料架供料情况EQ0060 M nozzle switch bad warning 中号吸嘴切换不良报警并被自动跳跃①清洗吸嘴更换过②检查吸嘴安装情况③重新测定吸嘴高度和中心④更换吸嘴⑤检查部品库参数设置⑥检查厚度传感器是否被异物遮盖⑦检查真空泵是否开启⑧检查料架供料情况EQ0061 L nozzle switch bad warning 大号吸嘴切换不良报警并被自动跳跃①清洗吸嘴更换过②检查吸嘴安装情况③重新测定吸嘴高度和中心④更换吸嘴⑤检查部品库参数设置⑥检查厚度传感器是否被异物遮盖⑧检查料架供料情况EQ0062 No s nozzle ready for suction 所有小吸嘴因吸着、识别或切换不良而全部跳跃①清洗②检查吸嘴安装情况③重新测定吸嘴高度和中心④更换吸嘴⑤检查部品库参数设置⑥检查厚度传感器是否被异物遮盖⑦检查真空泵是否开启⑧检查料架供料情况EQ0063 No m nozzle ready for suction 所有中吸嘴因吸着、识别或切换不良而全部跳跃①清②检查吸嘴安装情况③重新测定吸嘴高度和中心④更换吸嘴⑤检查部品库参数设置⑥检查厚度传感器是否被异物遮盖⑦检查真空泵是否开启⑧检查料架供料情况EQ0064 No l nozzle ready for suction 所有大吸嘴因吸着、识别或切换不良而全部跳跃①清洗②检查吸嘴安装情况③重新测定吸嘴高度和中心④更换吸嘴⑤检查部品库参数设置⑥检查厚度传感器是否被异物遮盖⑦检查真空泵是否开启⑧检查料架供料情况EQ0112 Parts exchange incompleteness 未换料按开始键将后部按亮HC0001 Handle interlock ①主轴摇动手轮没有拔出来①拔出手轮②手轮位置传感器失效或需②更换或重新调整传感器要调整③检查传感器与P-922M的连接情况HC0015 Head axis brake ON 主轴旋转时,break开关仍在ON位置置于OFFHC0016 Head axis servo motor OFF 主轴servo开关处于OFF位置置于ONHC0017 Head-axis origin OFF ①cycle timer ch1 信号没有的①手动将主轴回到原点100-200情况下,操作者试图移动某轴②检查cycle timer 设置情况② cycle timer 设置错误HC0024 Feed return detection error ① cycle timer 3350-1600时检①检查传感器检测设定情测复位时, ②重新调整系统传感器灯并没有亮③更换或调整复位②系统坏传感器③复位传感④检查传感器与光模块的连接情况器损坏或需要调整HC0028 Head number detection error ①传感器检测内容与先前设①调整或更换吸嘴单元号码定内容不一致传感器②传感器检测值不在1-16范②检查传感器与光模块连接情况围内③吸嘴单元头号码检测传感器失效、调整不良或连接不好HC0029 Nozzle number detection error ①传感器检测内容不正常①交换或调整第一个传感器②传感器检测内容不是1-3 ②检查大、中、小吸嘴安装情况是③不良元件检测位置前面的否滑动顺畅大中小号吸嘴检测传感器③检查第一个 sensor (传感器)与坏了、调整不良或接线不 P-922M 的连接情况良HC0033 Nozzle return detection error 传感器坏了或调整不当更换或调整 se HC0036 Safety detection error 安全传感器1或2开始生效HC0037 activated at θ axis starting θ轴起动过程不正常检查 cycle timer 角度HC0041 Sc movement impossible ①Sc程序Rom控制器坏①关机开机一次②Sc基板坏②更换Sc电路板HC0042 Suction miss ( no suction ) ①在修正值之内元件仍吸着①重新设定次数不良,最后一次不良为未 (最多5次)吸着②将料架安放准确②料架搁放位置不对③清洗、更换 nozzle③吸嘴坏或被堵塞④检查部品厚度值设定④部品数据库厚度值设定不对⑤厚度传感器测量错误HC0043 Suction miss standing ①在修正值之内元件仍吸着①重新设定次数不良,最后一次不良为立 (最多5次)起②将料架安放准确②料架搁放位置不对③清洗、更换 nozzle③吸嘴坏或被堵塞④检查部品厚度值设定④部品数据库厚度值设定不对⑤厚度传感器测量错误HC0051 Thickness sensor error ①厚度传感器不在自动状态①打开②输入/输出光电模块坏或连接②更换光电模块不好③检查传感器与控制部分接线情况③电源未开④开机、关机一次④厚度传感器控制部分坏⑤更换厚度传感器⑤未进行设置HC0052 Thickness sensor time up ①厚度传感器在极限角度3370 ① ON 仍未完成测量②更换光电模块②传感器在手动状态③检查厚度传感器与控制部分接线③传感器坏④检查传感器与光电模块的接线⑤更换 SENSOR⑥检查是否灯已亮HC0054 Thickness sensor data abnormal 厚度传感器数据不正常①检查接线情况②检查部品厚度数据HC0056 Cassette seating detection error ①料架安放不平检查料架安放情况②料架压板传感器坏HC0058 Cassette setting mistake 1 miss (1) ①料架安放错误①安放正确料架②料架设定传感器坏或调整不②更换或调整 sensor良③检查传感器与光电模块连接情况③料架 shutter 不平HC0059 Cassette setting mistake 2 miss (2) ①料架安放错误①安放正确料架②料架设定传感器坏或调整不②更换或调整 sensor良③检查传感器与光电模块连接情况③料架 shutter 不平HC0061 Left safety detection error 左侧安全门有人HC0062 Right safety detection error ①右边Z轴料未换完,右边安全①调整或更换传感器传感器熄灭②检查安全传感器与光电模块的连②右边安全传感器坏或需要调接情况整③检查后部Z轴是有人进入或有异③有人或东西进入安全门轨道物阻隔区域内HC0063 Center safety detection error ①中间Z轴料未换完,中间安全①调整或更换传感器传感器熄灭②检查安全传感器与光电模块的连②中间安全传感器坏或需要调接情况整③检查后部Z轴是有人进入或有异③有人或东西进入安全门轨道物阻隔区域内HC0064 Right cassette floating detection error 右边Z轴料架浮起①检查料架安放情况②检查传感器是否已坏HC0065 Left cassette floating detection error 左边Z轴料架浮起①检查料架安放情况②检查传感器是否已坏HC0066 Laser radiatior ①开关ON②开关坏③开关与光电模块连接不当HC0069 Left laser detection error 左侧料架压紧、传感器坏更换 sensorHC0070 Right laser detection error 右侧料架压紧、传感器坏更换 sensorHC0073 Zl - axis standby detection error ①Zl换料时等待传感器灭①检查是否 OFF移②Zl换料时,Zl被移动 Z轴③Zl等待传感器坏或需要调整②确认换料时Zl移到等待位置时,④ OFF后移动Zl轴等待 sensor 灯亮③调整或更换Zl待机传感器④检查传感器与光电模块的连接情况⑤ RESETHC0074 ZR - axis standby detection error ①ZR换料时等待传感器灭①检查是否 OFF②ZR换料时,Zl被移动 Z轴③ZR等待传感器坏或需要调整②确认换料时ZR移到等待位置时,④ OFF后移动ZR轴等待 sensor 灯亮③调整或更换ZR待机传感器④检查传感器与光电模块的连接情况⑤ RESETHC0077 Zl - axis other error ZL轴其它错误mmc unit errorHC0078 ZR - axis other error ZR轴其它错误mmc unit errorHC0079 ZL - axis ready error ZL处于准备状态时操作者试图开始 OFF绿灯亮后HC0080 ZR - axis ready error ZR处于准备状态时操作者试图开始 OFF绿灯亮后HC0082 ZL - ZR table ready ZL ZR 因无料而全部处于准备状态 OFF绿灯亮后HC0083 Large component pickup error 大元件吸嘴未吸起来将元件从料带中拿出来HC0084 Waste box setting error ①纸屑箱安放不良①将纸屑箱安装好②纸屑箱检测传感器坏②更换传感器HC0085 Nozzle error 部品厚度检测值为0 吸嘴折MC0001 air down ①未供气调整气压②气压低于4kg/cm2MC0002 Thermal trip ①热保护信号断①将主控制板热保护开关置于ON②200V电压突然切断②将纸屑箱热保护复位③真空泵或料屑箱热保护继电③检查真空泵转动方向器跳闸④检查纸屑箱泵转动方向④料屑箱4P接口断⑤检查纸屑箱是否已被堵塞⑥检查保险丝⑦检查4P接口连接情况MC0003 All axes servo motor OFF OFF ONMC0004 Emergency stop 开关被压下①开关松开②检查接线MC0005 Safety stop 开后自然出现一次或n次MC0006 1 block stop ①前盖开 OFF②前盖关 ON③轨道宽度调节手柄用完后未放回原位MC0007 cycle timer sequence error 手柄反向转动 H axis 回原点100-200MC0008 cycle timer abnormal 失效关机检查及接线情况MC0100 Planned production number fineshed 生产计划已完又重新设定或选择MC0101 Planned production number finished 半自动吸着已完又MC0203 ZL parts exhaust ①连续吸着错误数超过设定值①更换新料②Z轴无料②重新设置部品数据③料架位置不对③清洗更换 nozzle④吸嘴脏或坏⑤部品数据设置不对⑥厚度传感器测量错误MC0204 ZR parts exhanst ①连续吸着错误数超过设定值①更换新料②Z轴无料②重新设置部品数据③料架位置不对③清洗更换 nozzle④吸嘴脏或坏⑤部品数据设置不对⑥厚度传感器测量错误MC0305 Recognition error 识别错误①检查部品库元件长宽尺寸②检查发光管发光情况MC0400 Parts exhaust warning 某料快用完备料MC0500 Operation error 操作失误①开始时跳过半自动②检测吸嘴中心照相机初期设定元件进行部品库识别时未回原点③大中小吸嘴设定不对④吸嘴全部NG时 StartMC0502 Operation mode switch interlock error 操作者切换运转状态(Auto semi manual)时机不对MC0503 Stop mode switch interlock error 操作者非法未设定就StopMC0504 On-line mode switch interlock error 操作者非法MC0508 Origin return interlock error 操作者非法退出状态MC0510 Mount start interlock error 操作者非法下列情况不能开始①数据编辑②部品识别③输入起始步画面④X-Y teaching 功能⑤半自动吸着MC0511 Origin return incompleness error 开机后未回原点MC0513 Head-axis restart impossible 控制器内一个NC线路板坏更换NC线路板MC0514 No P.C.B on the XY table XY工作上没有基板试图全自动开始①装载基板②调整基板存在传感器③检查基板存在传感器与光电模块联接情况MC0522 Unmounted block 由于机器故障、关掉电源等原因基板尚未贴完的步数①START 继②停止吸着,将按灭③吸着后检查一下基板吸着是否正确MC0523 Mounting side block no cassette NC程序与配列程序搭配不当①重新选择NC程序、②更改数据MC0600 No mounting command ①未选程序①选择程序②所选程序步骤为0 ②更改程序③执行程序不存在③检查程序跳步是否正确④执行步数在NC程序不存在MC0603 No Z alteration component ①Z轴数值不对①重新设置 multi--origin 补偿值②主Z轴设置不对②重新设置 Z alteration③主Z轴设置跨越ZL、ZR ③重新设置 master ZMC0604 Start block designation error 起始步设定不对不能开始于第一步因第一步为基板识别MC0605 No program setting error ①NC程序不对①Z轴联接使用时Z轴数不超过150②步重复命令和块重复命令混②Z轴交换或准备状态时Z轴数不超合使用过75MC0607 M000 command in NC data abnormal NC data 不对MC0608 M100 command in NC data abnormal NC data 不对MC0610 M200 command in NC data abnormal NC data 不对MC0611 M command in NC data abnormal NC data 不对MC0613 NC program Pcb recognition command setting error 基板识别放在了吸着步数中间MC0614 Bad mark command in NC data abnormal 不良基板识别放在了吸着步数中间MC0615 Recognition command in NC data abnormal MMC或MMI电路电池用完后重MC0616 Array program edit error 配列程序中有些数值没有输入MC0617 Array program setting error 配列程序数据不对重新编辑MC0620 Parts data abnormal ①部品库某些数值不对重新编辑②部品库某些数值未输MC0621 Parts data setting error ①某些数值在MSHⅡ上不能重新编辑使用②速度超过8,吸嘴超过3.③压料次数部品厚度识别数据设定为0MC0624 Mark data setting error ①未做Mark识别②Mark库代码为0MC0628 Multi orgin data error Z轴起始原点超过范围①Z轴联接超过150②Z轴交换或准备超过75③Z轴超过程序Z数MC0631 S&R block number over 步重复或块重复步数超过200 REEDITMC0900 Parts camera scale not set 照相机像素未设定SCALE 重新设定MC0908 Parts replacement warning (light for board) 发光管使用时间超过设定值更换发光管MC1000 X-axis plus soft limit 下列数值设定不对使机床超过X方向正极限①检查机床初期设定点是否正确●机器原点②进入程序编辑状态,检查X方向程●程序原点序原点是否正确●照相机相素③进入机床初期设定识别数据基础●照相机位置补偿值值,检查照相机像素和位置补偿值是否正确MC1001 X-axis minus soft limit 下列数值设定不对使机床超过X方向负极限①检查机床初期设点是否正确●机器原点②进入程序编辑状态,检查X方向程●程序原点序原点是否正确●照相机相素③进入机床初期设定识别数据基础●照相机位置补偿值值,检查照相机像素和位置补偿值是否正确MC1002 Y-axis plus soft limit 下列数值设定不对使机床超过Y方向正极限①检查机床初期设定点是否正确●机器原点②进入程序编辑状态,检查Y方向程●程序原点序原点是否正确●照相机相素③进入机床初期设定识别数据基础●照相机位置补偿值值,检查照相机像素和位置补偿值是否正确MC1003 Y-axis minus soft limit 下列数值设定不对使机床超过Y方向负极限①检查机床初期设点是否正确●机器原点②进入程序编辑状态,检查Y方向程●程序原点序原点是否正确●照相机相素③进入机床初期设定识别数据基础●照相机位置补偿值值,检查照相机像素和位置补偿值是否正确MC1004 ZL-axis plus soft limit ZL轴设定值不对超过正极限检查初期设定值ZL数据是否正确MC1005 ZL-axis minus soft limit ZL轴设定值不对超过负极限检查初期设定值ZL数据是否正确MC1006 ZR-axis plus soft limit 下列数值设定不对造成ZR超过正极限检查机床初期设定Z轴原 ●Z轴原点补偿值●Z轴间距MC1007 ZR-axis minus soft limit 下列数值设定不对造成ZR超过负极限检查机床初期设定Z轴 ●Z轴原点补偿值●Z轴间距MC1102 ZL-axis interlock error at start ① 3120-1580 Z轴移动时Z互锁信号关闭①检查②调整辅助进给单元上极限传感器②辅助进给单元上极限传感器需要调整或未联接③检查辅助进给单元上极限传感器与光电模块③辅助进给马达原点传感器需要调整或连线已断④调整辅助进给马达原点传感器⑤检查辅助进给马达与江电模块联接情况④Z轴处于准备状态时,伺服锁定被打开.⑥重新操作MC1103 ZR-axis interlock error at start ① 3200-1600 Z轴移动时Z互锁信号关闭①检查②调整辅助进给单元上极限传感器②辅助进给单元上极限传感器需要调整或未联接③检查辅助进给单元上极限传感器与光电模块③辅助进给马达原点传感器需要调整或连线已断④调整辅助进给马达原点传感器⑤检查辅助进给马达与江电模块联接情况④Z轴处于准备状态时,伺服锁定被打开.⑥重新操作MC9000 P783 fan motor alarm P783控制器冷却风扇坏或风扇电线断MC9001 P783 overheat P783控制器内温度超过500 更换冷却风扇MC9010 NC card error (1) ①NC板被接通后没反应关掉电源检查控制器内NC板②电源打开或后出现一个初期错误MC9011 NC card error (2) 信号传输不可能时命令从MMC板到达NC1板或NC2板关掉电源检查MC9012 NC card error (3) 控制器内NC板接触不良或已坏关掉电源检查控制器内NC板MC9015 PM card error (1) 信号传输不可能时命令从MMC板到达PM板关掉电源检查控制器内MC9016 PM card error (2) 控制器内PM板接触不良或已坏关掉电源检查控制器内PM板MC9020 SC card error (1) 控制器内SC板失效或已坏关掉电源检查控制器内SC板MC9021 SC card error (2) 信号传输不可能时命令从MMC板到达SC板关掉电源检查控制器内MC9022 SC card error (3) 控制器内SC板失效或已坏关掉电源检查控制器内SC板MC9023 SC card error (4) 控制器内SC板接触不良或坏关掉电源检查控制器内SC板MC9025 RE card error (1) 控制器内RC板失效或已坏关掉电源检查控制器内RC板MC9026 RE card error (2) 信号传输不可能时命令从MMC板到达RC板关掉电源检查控制器内MC9027 RE card error (3) 控制器内RC板接触不良或坏关掉电源检查控制器内RC板MC9030 MMI card error (1) 控制器内MMI板失效或已坏关掉电源检查控制器内MMI板MC9031 MMI card error (2) 信号传输不可能时命令从MMC板到达MMI板关掉电源检查控制器MC9032 MMI card error (3) 控制器内MMI板接触不良或坏关掉电源检查控制器内MMI板NC0100 X-axis plus limit ①X轴移动超过X轴正极限①调整X轴正极限传感器灵敏度及位②X轴正极限传感器位置设置置不对②检查X轴正极限传感器与光电模块③正极限传感器坏联接情况NC0101 X-axis minus limit ①X轴移动超过X轴负极限①调整X轴负极限传感器灵敏度及位②X轴负极限传感器位置设置置不对②检查X轴负极限传感器与光电模块③负极限传感器坏联接情况NC0102 X-axis deviation counter overflow ①伺服马达开关处于OFF 关掉电源调整马达驱动器②X轴方向过载(加速过快)③X轴驱动器(GAIN STB)需要调整④X轴移动过程中马达脱离啮合⑤X轴丝杠脏造成X轴移动不了NC0103 X-axis driver alarm ①X轴马达过流(OC) ①关掉电源调整X轴马达驱动器②X轴马达电源被关②检查X轴驱动器电源③移动中驱动器信号断③检查X轴安全极限传感器是否0FF④回原点时互锁信号断NC0104 X-axis time up ①X轴定位超过5秒关掉电源调整X轴驱动器②X轴速度设定错误③原点回归超过20秒④H轴或其它轴需要调整⑤控制器内有错误NC0105 X-axis interlock during moverment ①X轴运转过程中 33频道互锁信号断①关掉②H轴或其它轴需要调整②调整X轴驱动器③X轴驱动器需要调整④设定不良⑤XY开始信号被切断NC0106 X-axis movement impossible ①X轴驱动器电源未开①检查X轴驱动器电源②X轴驱动器与控制器接线不良②关掉总电源检查X轴驱动器与控制③X轴移动时马达准备信号断器的接线情况NC0107 X-axis origin detection error ①X轴原点传感器已坏①调整X轴原点传感器②由于接线不良致使传感器检②检查X轴原点传感受器与光电模块测不到原点的联接情况③检查X轴原点减速传感器与光电模块的接线情况NC0112 X-axis error (others) X轴由于任意错误而突然停止通常屏幕上会显示一些其它错误根NC0200 Y-axis plus limit ①Y轴移动超过Y轴正极限①调整Y轴正极限传感器灵敏度及位②Y轴正极限传感器位置设置置不对②检查Y轴正极限传感器与光电模块③正极限传感器坏联接情况NC0201 Y-axis minus limit ①Y轴移动超过Y轴负极限①调整Y轴负极限传感器灵敏度及位②Y轴负极限传感器位置设置置不对②检查Y轴负极限传感器与光电模块③负极限传感器坏联接情况NC0202 Y-axis deviation counter overflow ①伺服马达开关处于OFF 关掉电源调整马达驱动器②Y轴方向过载(加速过快)③Y轴驱动器(GAIN STB)需要调整④Y轴移动过程中马达脱离啮合⑤Y轴丝杠脏造成Y轴移动不了NC0203 Y-axis driver alarm ①Y轴马达过流(OC) ①关掉电源调整Y轴马达驱动器②Y轴马达电源被关②检查Y轴驱动器电源③移动中驱动器信号断③检查Y轴安全极限传感器是否0FF④回原点时互锁信号断NC0204 Y-axis time up ①Y轴定位超过5秒关掉电源调整Y轴驱动器②Y轴速度设定错误③原点回归超过20秒④H轴或其它轴需要调整⑤控制器内有错误NC0205 Y-axis interlock during moverment ①Y轴运转过程中 33频道互锁信号断①关掉②H轴或其它轴需要调整②调整Y轴驱动器③Y轴驱动器需要调整④设定不良⑤XY开始信号被切断NC0206 Y-axis movement impossible ①Y轴驱动器电源未开①检查Y轴驱动器电源②Y轴驱动器与控制器接线不良②关掉总电源检查Y轴驱动器与控制③Y轴移动时马达准备信号断器的接线情况NC0207 Y-axis origin detection error ①Y轴原点传感器已坏①调整Y轴原点传感器②由于接线不良致使传感器检②检查Y轴原点传感受器与光电模块测不到原点的联接情况③检查Y轴原点减速传感器与光电模块的接线情况NC0212 Y-axis error (others) Y轴由于任意错误而突然停止通常屏幕上会显示一些其它错误根NC0300 Z-axis plus limit ①Z轴移动超过Z轴正极限①调整Z轴正极限传感器灵敏度及位②Z轴正极限传感器位置设置置不对②检查Z轴正极限传感器与光电模块③正极限传感器坏联接情况NC0301 Z-axis minus limit ①Z轴移动超过Z轴负极限①调整Z轴负极限传感器灵敏度及位②Z轴负极限传感器位置设置置不对②检查Z轴负极限传感器与光电模块③负极限传感器坏联接情况NC0302 Z-axis deviation counter overflow ①伺服马达开关处于OFF 关掉电源调整马达驱动器②Z轴方向过载(加速过快)③Z轴驱动器(GAIN STB)需要调整④Z轴移动过程中马达脱离啮合⑤Z轴丝杠脏造成Z轴移动不了NC0303 Z-axis driver alarm ①Z轴马达过流(OC) ①关掉电源调整Z轴马达驱动器②Z轴马达电源被关②检查Z轴驱动器电源③移动中驱动器信号断③检查Z轴安全极限传感器是否0FF④回原点时互锁信号断NC0304 Z-axis time up ①Z轴定位超过5秒关掉电源调整Z轴驱动器②Z轴速度设定错误③原点回归超过20秒④H轴或其它轴需要调整⑤控制器内有错误NC0305 Z-axis interlock during moverment ①Z轴运转过程中 33频道互锁信号断①关掉②H轴或其它轴需要调整②调整Z轴驱动器③Z轴驱动器需要调整④设定不良⑤XY开始信号被切断NC0306 Z-axis movement impossible ①Z轴驱动器电源未开①检查Z轴驱动器电源②Z轴驱动器与控制器接线不良②关掉总电源检查Z轴驱动器与控制③Z轴移动时马达准备信号断器的接线情况NC0307 Z-axis origin detection error ①Z轴原点传感器已坏①调整Z轴原点传感器②由于接线不良致使传感器检②检查Z轴原点传感受器与光电模块测不到原点的联接情况③调整Z轴缝隙传感器④检查Z轴原点减速传感器与光电模块的接线情况NC0312 Z-axis error (others) Z轴由于任意错误而突然停止通常屏幕上会显示一些其它错误根NC0402 θ1-axis deviation counter overflow ①伺服马达开关处于OFF 关掉电源调整马达驱动②θ1轴方向过载(加速过快)③θ1轴驱动器(GAIN STB)需要调整④θ1轴移动过程中马达脱离啮合⑤θ1轴丝杠脏造成其不能移动NC0403 θ1-axis driver alarm ①θ1轴马达过流(OC) ①关掉电源调整θ1轴马达驱动器②θ1轴马达电源被关②检查θ1轴驱动器电源③移动中驱动器信号断③检查θ1轴安全极限传感器是否0FF④回原点时互锁信号断NC0404 θ1-axis time up ①θ1轴定位超过5秒关掉电源调整θ1轴驱动器②θ1轴速度设定错误③原点回归超过20秒④H轴或其它轴需要调整⑤控制器内有错误NC0405 θ1-axis interlock during moverment ①θ1轴运转过程中 33频道互锁信号断①关掉②H轴或其它轴需要调整②调整θ1轴驱动器③θ1轴驱动器需要调整④设定不良⑤XY开始信号被切断NC0406 θ1-axis movement impossible ①θ1轴驱动器电源未开①检查θ1轴驱动器电源②θ1轴驱动器与控制器接线不良②关掉总电源检查θ1轴驱动器与控③θ1轴移动时马达准备信号断制器的接线情况NC0502 θ3-axis deviation counter overflow ①伺服马达开关处于OFF 关掉电源调整马达驱动②θ3轴方向过载(加速过快)③θ3轴驱动器(GAIN STB)需要调整④θ3轴移动过程中马达脱离啮合⑤θ3轴丝杠脏造成θ3轴移动不了NC0503 θ3-axis driver alarm ①θ3轴马达过流(OC) ①关掉电源调整θ3轴马达驱动器②θ3轴马达电源被关②检查θ3轴驱动器电源③移动中驱动器信号断③检查θ3轴安全极限传感器是否0FF④回原点时互锁信号断NC0504 θ3-axis time up ①θ3轴定位超过5秒关掉电源调整θ3轴驱动器②θ3轴速度设定错误③原点回归超过20秒④H轴或其它轴需要调整⑤控制器内有错误NC0505 θ3-axis interlock during moverment ①θ3轴运转过程中 33频道互锁信号断①关掉。
LYP1050轮转胶印机控制系统设计
第28卷第1期2021年2月工程设计学报Chinese Journal of Engineering DesignVol.28No.1Feb.2021 LYP1050轮转胶印机控制系统设计王奔1,朱龙彪1,沈祖军2,陈小林2(1.南通大学机械工程学院,江苏南通226019;2.如皋中罗印刷机械有限公司,江苏如皋226553)摘要:为满足印刷市场对高速、高质量及高效率胶印机的需求,设计了一种LYP1050轮转胶印机控制系统。
首先,采用汇川AC810运动控制器作为主控制器,以汇川IT6000系列触摸屏作为人机交互界面,结合伺服驱动单元,搭建了LYP1050轮转胶印机控制系统的硬件平台。
然后,提出了LYP1050轮转胶印机的多轴同步控制、闭环速度和收卷锥度张力控制以及自动套色控制方法,同时,对LYP1050轮转胶印机控制系统的下位机程序和人机交互界面进行设计。
最后,通过采集LYP1050轮转胶印机样机实际运行时的套色误差来验证所设计的控制系统的可靠性。
试验结果表明:该轮转胶印机的套色精度可控制在±0.05mm内,符合套色要求。
所设计的控制系统安全可靠,同步性较好,套色精度高,故障率低,具有广泛的通用性,可为同类型轮转胶印机控制系统的设计提供参考。
关键词:轮转胶印机;多轴同步;张力控制;自动套色中图分类号:TH-39;TP273文献标志码:A文章编号:1006-754X(2021)01-0112-09Design of control system of LYP1050rotary offset pressWANG Ben1,ZHU Long-biao1,SHEN Zu-jun2,CHEN Xiao-lin2(1.School of Mechanical Engineering,Nantong University,Nantong226019,China;2.Rugao Zhongluo Printing Machinery Co.,Ltd.,Rugao226553,China)Abstract:In order to meet the demand of printing market for high-speed,high-quality and high-efficiency offset presses,a LYP1050rotary offset press control system is designed.Firstly,taking the Inovance AC810motion controller as the main controller and the Inovance IT6000series touch screen as the human-computer interaction interface,the hardware platform of the LYP1050rotary offset press control system was built by combining the servo drive unit.Then,the methods including the multi-axis synchronization control,the tension control of closed-loop speed and winding taper and the automatic registration control for the LYP1050rotary offset press were proposed;at the same time,the lower computer program and human-computer interaction interface of the LYP1050rotary offset press control system were designed.Finally,the reliability of the designed control system was verified by collecting the registration error of the LYP1050rotary offset press prototype during actual operation.The test results showed that the registration accuracy of this rotary offset press could be controlled within±0.05 mm,which met the registration requirements.The designed control system is safe and reliable,with good synchronization,high color registration accuracy,low failure rate,and wide versatility,which can provide references for the design of the similar rotary offset press control system.Key words:rotary offset press;multi-axis synchronization;tension control;automatic registration印刷业是我国国民经济的重要组成部分,印刷产品广泛应用于生产、生活领域[1]。
Reassessing PCR primers targeting nirS, nirK and nosZ genes
Reassessing PCR primers targeting nirS ,nirK and nosZ genes for community surveys of denitrifying bacteria with DGGEIngela Noredal Throb €a ck *,Karin Enwall, AsaJarvis,Sara Hallin Department of Microbiology,Swedish University of Agricultural Sciences,Box 7025,SE-75007Uppsala,SwedenReceived 1October 2003;received in revised form 8April 2004;accepted 19April 2004First published online 18May 2004AbstractWe re-evaluated PCR primers targeting nirS ,nirK and nosZ genes for denaturing gradient gel electrophoresis as a tool to surveydenitrifying community composition in environmental samples.New primers for both nirS and nosZ were combined with existing primers,while for nirK the previously published F1aCu:R3Cu set was chosen for denaturing electrophoresis.All three sets yielded amplicons smaller than 500bp and amplified the correct fragment in all environmental samples.The denaturing gradient gel electrophoresis worked satisfactorily for nirK and nosZ ,but not for nirS .This was probably due to the multiple melting domains in this particular nirS fragment.From the excised and sequenced bands,only sequences related to the target genes were detected and tree analysis showed that the selected primers acted as broad range primers for each of the three genes.By use of the new nirS primers it was demonstrated that agricultural soil harbours a substantial diversity of nirS denitrifiers.Ó2004Published by Elsevier B.V.on behalf of the Federation of European Microbiological Societies.Keywords:Diversity;Denitrification;Soil;Peat;Activated sludge;Functional genes;Environmental clones;Nitrite reductase;Nitrous oxide reductase;Uncultured bacteria1.IntroductionCommunity and diversity surveys of bacteria have for nearly 10years focused on the phylogenetic diversity of bacteria in the environment.However,species compo-sition based on 16S rRNA analysis only provides mar-ginal information on communities and certain metabolic groups.An exciting direction in molecular ecology is the analysis of genes encoding important functions for the ecosystems.The analysis of functional diversity and its physiological dynamics is essential for improved un-derstanding of the microbial ecology and biogeochem-istry of different environments.Generally,functional genes have more sequence variation than the relatively conserved 16S rRNA genes.They can therefore be ex-ploited as biomarkers to discriminate between closely related but ecologically different populations [1].Moreover,some important functions are not associatedwith a specific taxonomic group.One example is deni-trification,which is a functional trait found within more than 50genera [2].Denitrification is the stepwise reduction of nitrate (NO À3)to dinitrogen (N 2),associated with oxidative phosphorylation and release of nitric oxide (NO)and nitrous oxide (N 2O)gases.This process is of global concern since it leads to nitrogen losses from agricul-tural soils and because nitrous oxide contributes to ozone depletion in the stratosphere and is a potent greenhouse gas [3].Denitrifying bacteria can also be used to remove excess nitrogen in wastewater treatment plants and to degrade organic pollutants.Most bacteria with this functional trait belong to a wide range of various subclasses of Proteobacteria .However,the ability to denitrify has also been found in some Archaea ,in the halophilic and hyperthermophilic branches,and in mitochondria of certain fungi [2].Lateral gene transfer is the most likely explanation for this wide-spread ability to denitrify [4].*Corresponding author.Tel.:+46-18-67-33-80;fax:+46-18-67-33-92.E-mail address:Ingela.Throback@mikrob.slu.se (I.N.Throb €a ck).0168-6496/$22.00Ó2004Published by Elsevier B.V.on behalf of the Federation of European Microbiological Societies.doi:10.1016/j.femsec.2004.04.011FEMS Microbiology Ecology 49(2004)401–417Functional genes that encode for the enzymes in-volved in the denitrification pathway,such as nitrite, nitric oxide and nitrous oxide reductases,can be ex-ploited by targeting conserved regions.The reduction ofnitrite(NOÀ2)to nitric oxide distinguishes denitrifiersfrom other nitrate-respiring bacteria[2].This reaction is central to denitrification and is catalysed by two differ-ent types of nitrite reductases(Nir),either a cytochrome cd1enzyme encoded by nirS or a Cu-containing enzyme encoded by nirK.The reduction of nitrous oxide is the last step in the denitrification pathway and is catalysed by nitrous oxide reductase encoded by the nosZ gene. However,some denitrifiers lack this enzyme.The nosZ gene can be used as a target for the different populations of the denitrifying bacteria capable of nitrous oxide re-duction.Most work on molecular ecology of denitrify-ing bacteria has been based on nirK and nirS,as well as nosZ,e.g.[5,6].Recently,the gene,norB,encoding nitric oxide reductase was used as a marker for denitrifying bacteria in freshwater and marine sediments[7].Surveys of bacterial community composition in en-vironmental samples are often based on the polymerase chain reaction(PCR).Reliable PCR primers are a pre-requisite for microbial community surveys since they ultimately determine what is detected in the environ-mental sample.Ward[8]made thefirst attempt to design PCR primers targeting the nirS gene and they were based on only three sequences from two different spe-cies.A better attempt to amplify nirK and nirS was published in1998[9],and alternatives or modifications followed[10–15].Primers for detection of the nosZ gene werefirst published in1998[16]and these were later made more degenerate[17].Kloos et al.[18]developed more pertinent broad range primers for nosZ.The dif-ferent nir and nosZ primers have mainly been used to study community composition of denitrifying bacteria in marine sediments[5,6,16,19–22]but also in estuarine sediments[17],cyanobacterial bloom[23],soil[13,24–29],wastewater treatment reactors[30,31]and ground-water[15].The oldest and most frequently used primers to detect denitrifying bacteria target nirS and nirK[9] and were designed based on a limited number of se-quences,mainly from laboratory strains.Since then the number of partial nir and nosZ sequences deposited in the GenBank have increased almost a100-fold and it has become apparent that the primer sites are more variable than previously shown.The aim of our study was to re-evaluate primers for amplification of nirS,nirK and nosZ gene fragments in silico and in vitro,and to introduce denaturing gradient gel electrophoresis(DGGE)[32]as a tool to survey the denitrifying community composition in environmental samples.A limiting factor when designing primers for DGGE is that the fragments should not be much longer than500bp for successful analysis[33].Nevertheless, the most commonly used primers for the denitrifying genes are not suitable for DGGE since they amplify fragments that are approximately600–1100bp.DGGE of partial16S rDNA has been successfully employed for analysis of community DNA even in such com-plex environments as soil(e.g.[34]).However,the use of DGGE with functional genes is still in its beginnings.2.Materials and methods2.1.Bacterial strains,growth conditions and environmen-tal samplesTwenty one of the28denitrifying strains used in this study(Table1)were cultivated aerobically in nutrient broth(Oxoid,Basingstoke,UK)at30°C.Bradyrhizo-bium japonicum526and Rhizobium meliloti50were grown at30°C in yeast extract mannitol medium[35]. Blastobacter denitrificans DSM1113was grown in pep-tone yeast extract glucose medium(DSM medium621) at40°C and Hyphomicrobium denitrificans DSM1869in methylamine hydrochloride medium(DSM medium166) at30°C.Rhodobacter sphaeroides DSM158was grown anaerobically in the presence of light in a medium con-taining yeast extract and ethanol(DSM medium27)at 25°C.Both Pseudomonas aeruginosa CCUG241and P.aeruginosa Mi11were cultivated in nutrient broth at 37°C.The cells were harvested by centrifugation(14,000 rpm,10min,22°C),washed twice in sodium phosphate (4.5mM K2HPO4and1.2mM KH2PO4,pH7.3)buffer and stored in15%glycerol at)70°C.As controls,DNA from the three non-denitrifying strains Escherichia coli TG1[36],Lactobacillus reuteri DSM20016and Staph-ylococcus aureus8325-4[37],was kindly provided by colleagues at the Department of Microbiology,SLU, Sweden.Six environmental samples were used to evaluate the primers and the DGGE analysis.Samples of arable soil were collected from the upper20cm layer at three dif-ferent sites(Alunda[A],Brunnby,[B]and Uller aker[U]) in the M€a lar region in Sweden(Table2).Each soil was sieved(<4mm)and thoroughly mixed.One peat sample (P)was collected from the true peat layer of a small fen (ca.1ha)in a forested area close to Uppsala,Sweden. The vegetation was dominated by Sphagnum mosses, and Vaccinium oxycoccus,Eriophorum vaginatum and Potentilla palustris were the most common vascular plants.The sample was collected from just below the level of the water table at a depth of20–30cm below the moss surface.Activated sludge samples were collected from full-scale nitrogen removal processes at the Ku-ngs€a ngen(K)and Henriksdal(H)municipal wastewater treatment plants in Uppsala and Stockholm,respec-tively.One-millilitre portions of the fresh sludge samples were centrifuged at14,000rpm for10min and the su-402I.N.Throb€a ck et al./FEMS Microbiology Ecology49(2004)401–417pernatant was discarded prior to storage.All the envi-ronmental samples were stored at)20°C.2.2.DNA extractionChromosomal DNA was isolated from the pure cul-tures using the DNeasy Tissue Kit TM(Qiagen,Valencia, CA,USA)as specified by the manufacturer.Total DNA from the environmental samples was extracted using the FastDNAÒSpin Kit for soil(Qbiogene,Carlsbad,CA, USA)according to the manufacturer’s protocol with a few modifications in the pre-treatment step.The soil and peat samples(300mg)were mixed with978l l of the phosphate buffer in the kit using a blender and trans-ferred to a multimix-tube,and122l l MT buffer from the kit was then added.The sludge pellets were dissolved in978l l phosphate buffer and transferred to multimix-tubes to which122l l MT buffer was added.The isolated DNA was stored at)20°C.2.3.PCR amplification of nirS,nirK and nosZ genesThe nirS,nirK and nosZ sequences presently available from the GenBank database were aligned,and con-served regions that could provide suitable primer target sites were re-assessed.For the nirS gene,11forward and five reverse primers were tested.For the nirK gene,three forward and three reverse primers were evaluated for PCR amplification of gene fragments,whilefive forward and six reverse primers were tested for nosZ(Table3, Fig.1).All possible primer combinations for nirK and nosZ,except those including nosLb and nosRb,were evaluated against the denitrifying strains,the non-deni-trifying strains and the environmental samples.For nirS merely combinations yielding amplicons>400bp were tested.The reason for this was to reduce the number of combinations and to only work with primers that am-plify fragments with enough information to be useful in environmental studies.In the case of minor variations in the primer sequence,e.g.,modifications of F1acd(Table 3),only the result from the best combination is shown in Table1.The oligonucleotides were purchased from In-vitrogen(Carlsbad,CA,USA).The criteria to evaluate the different primer sets for nirK,nirS and nosZ were:(i)the number of strains that the gene was amplified from,(ii)the number of genera that the gene was amplified from,(iii)the number of environmental samples that the gene was amplified from and(iv)the size of the amplicon.In the case of criteria (i)–(iii),the higher the better.For community surveys, larger amplicons is beneficial and in order to be suc-cessful also in DGGE analysis the size should not exceed 500bp.All primer pairs amplifying gene fragments of nirS and nirK were run with an initial denaturation of the DNA at94°C for2min,followed by35cycles of30s at 94°C,1min at51°C and1min at72°C.The reaction was completed after10min at72°C.The reaction mixtures were placed in a minicycler(MJ Research, Waltham,M,USA).Due to inadequate amplification, primer pair Cunir3:nirk5R(also named Cunir4)was also run according to Casciotti and Ward[12].The PCR for primer pairs,cd3aF:R3cd and F1aCu:R3Cu,was further optimised and the annealing temperature was increased to57°C for both primer pairs.The annealing temperature for the primers encoding nosZ differed de-pending on the specific pair,but the PCR program was otherwise as described above.Primer combinations Nos661F:Nos1527R,Nos661F:Nos1773R,Nos1527F:-Nos1773R,nosZ-F:Nos1773R and nosZ661b:-nosZ1773b were run at an annealing temperature of55°C,combination nosZ-F:nosZ-R at50°C and combi-nation nosZ-F:nosZ1622R at53°C.Primers nosLb and nosRb were run according to Ch e neby et al.[24]but also with a lower annealing temperature(56°C)due to in-adequate amplification.The detection and the size of the amplicons were determined by agarose(0.9%)gel elec-trophoresis and UV translumination after ethidium bromide staining.PCR amplification was performed in a total volume of25l l containing2.5l l of10ÂPCR buffer(500mM KCl,15mM MgCl2and100mM Tris–HCl,pH9.0,at room temperature),200l M of each deoxynucleotide triphosphate, 1.25U of Taq polymerase(Amersham Biosciences,NY,USA),1.0mM of each primer and10–100ng DNA.In accordance with Braker et al.[9],an additional1.0mM MgCl2,400ng l lÀ1BSA and0.1% Triton X-100were added for amplification with primers nirK1F,nirK3R,nirK5R,nirS1F,nirS3F,nirS3Fa, nirS4R and nirS6R.An additional1.0mM MgCl2was added for the primer pair Cunir3:nirK5R[12].For amplification of the environmental samples,BSA was added in the PCRs with all other primer combinations. For nirS reactions,1000ng l lÀ1was added,for nirK400 and for nosZ600.The relative amounts of PCR products obtained for nirS,nirK and nosZ in the environmental samples were estimated by comparing band intensities on agarose gels.Table2General soil characteristicsSite Soil type pH Clay content(%)Organic C(%)Total N(%) Alunda(A)Silty clay loam7.839 4.950.49 Brunnby(B)Clay loam 5.641 1.230.13Uller aker(U)Sandy loam 5.814 1.820.13406I.N.Throb€a ck et al./FEMS Microbiology Ecology49(2004)401–417In order to get approximately the same amount from each sample,the amplicons were concentrated through freeze-drying (3Â10À1mbar and )40to )50°C;Edwards Modulyo Freeze Dryer,BOC Edwards,Crawley,UK)to approximately 1/5of the original vol-ume before DGGE analysis.2.4.DGGEThe melting profiles of the nirS ,nirK and nosZ frag-ments from the best primer combinations were analysed with the computer program WinMelt (Bio-Rad Labo-ratories Inc.,Hercules,CA).To modify the melting profile and avoid complete denaturing of the amplified fragments,a 33-bp GC-clamp (50GGC GGC GCG CCG CCC GCC CCG CCC CCG TCG CCC 30)was attached to the 50end of the R3cd,R3Cu and nosZ1622R primer,respectively.The PCR conditions for reactions with the GC-clamped primers were the same as those for the or-dinary primers,as described above.Following PCR of four independent reactions,the amplified products were pooled and resolved on DGGE gels using a Dcode sys-Table 3Primer sequences and positions used to amplify fragments from nirS ,nirK and nosZ genes in the denitrification pathway Primer a Position b Primer sequence (50-30)Reference nirS1F 763–780CCT A(C/T)T GGC CGC C(A/G)C A(A/G)T [9]F1acd 856–871TA(C/T)CAC CC(C/G)GA(A/G)CCG C [10]F1bcd856–872TA(C/T)CAC CC(C/G)GA(A/G)CCG CGThis study Heme 832F 856–875TA(C/T)CAC CC(C/G)GA(A/G)CCG CGC GT [15]F1dcd 859–875CAC CC(C/G)GA(A/G)CCG CGC GTThis studycd3aF 916–935GT(C/G)AAC GT(C/G)AAG GA(A/G)AC(C/G)GG [11]cd3bF 916–935GTG AAC GT(C/G)AAG GA(A/G)AC(C/G)GG [11]nirS3F 1002–1019TTC CT(T/C/G)CA(C/T)GAC GGC GGC [9]nirS3Fa 1002–1018TTC CT(T/C/G)CA(C/T)GAC GG(C/T)GG This study F3nirS 1132–1148CCG CAC CCG GG(T/C/G)CG(C/T)GGThis studynirS4F 1317–1336TTC (A/G)TC AAG AC(C/G)CA(C/T)CCG AA [9]nirS4R 1317–1336TTC GG(G/A)TG(C/G)GTC TTG A(T/C)G AA [9]R3cd 1322–1341GA(C/G)TTC GG(A/G)TG(C/G)GTC TTG A This study R4cd 1636–1654CGT TGA ACT T(G/A)C CGG T(C/G)G G[10]R4bcd 1636–1654CGT TGA A(C/T)T T(G/A)C CGG T(C/G)G G This studynirS6R 1638–1653CGT TGA ACT T(A/G)C CGG T[9]Cunir3504–521CGT CTA (C/T)CA (C/T)TG CGC (A/C/G)CC [12]nirK1F 526–542GG(A/C)ATG GT(G/T)CC(C/G)TGG CA [9]F1aCu 568–584ATC ATG GT(C/G)CTG CCG CG[10]nirK3R 898–918GAA CTT GCC GGT (A/C/G)G(C/T)CCA GAC [9]R3Cu 1021–1040GCC TCG ATC AG(A/G)TTG TGG TT [10]nirK5R 1023–1040GCC TCG ATC AG(A/G)TT(A/G)TGG [9]Nos661F 303–320CGG CTG GGG GCT GAC CAA[16]nosZ661b 303–320CGG (C/T)TG GGG (C/G)(A/C)(A/T)(T/G)AC CAA [17]nosLb 1124–1144CCC GCT GCA CAC C(A/G)C CTT CGA[24]Nos1527F 1169–1187CGC TGT TC(A/C/T)TCG ACA G(C/T)C A [16]nosZ-F 1169–1188CG(C/T)TGT TC(A/C)TCG ACA GCC AG [18]Nos1527R 1171–1188CTG TTC (A/C/T)TC GAC AG(T/C)CAG[16]Nos1773R 1396–1415AAC GA(A/C/G)CAG (T/C)TG ATC GA(T/C)AT[16]nosZ1773b 1396–1415AA(C/T)GA(A/G/C/T)CA(G/A)(T/C)TG ATC CG(T/C)AT [17]nosRb1405–1425CGT CGC C(C/G)G AGA TGT CGA TCA[24]nosZ1622R 1603–1622CGC (G/A)A(C/G)GGC AA(G/C)AAG GT(G/C)CG This studynosZ-R1849–1869CAT GTG CAG (A/C/G/T)GC (A/G)TG GCA GAA[18]a Primers are indicated Cu or nirK for the nirK gene,cd or nirS for the nirS gene and nosZ or nos for nosZ .bPositions in the nirS gene of Pseudomonas stutzeri ZoBell ATCC 14405(X56813),in the nirK gene of Alcaligenes faecalis S-6(D13155),and in the nosZ gene of Pseudomonas aeruginosa DSM 50071(X65277).I.N.Throb €a ck et al./FEMS Microbiology Ecology 49(2004)401–417407tem(Bio-Rad Laboratories Inc.).PCR products from three denitrifying strains were applied two times to each DGGE gel as markers to check the electrophoresis run and to compare fragment migration between gels.For nirS the strains were(in the order of increasing migration distance):Pseudomonasfluorescens Mi32,Paracoccus denitrificans CCUG13798and P.denitrificans Pd1222; for nirK:Alcaligenes faecalis ATCC8750,Achromobac-ter cycloclastes ATCC21921and Alcaligenes sp.DSM 30128;and for nosZ:Ralstonia eutropha CCUG13724, B.denitrificans DSM1113and P.denitrificans Pd1222.One-mm thick,16by16cm polyacrylamide gels (7.0%[v/v]acrylamide-bisacrylamide[37.5:1];denatur-ant[urea and formamide])were poured using a gradient maker(Bio-Rad Laboratories Inc.).A mixture of7M urea and40%formamide was defined as100%dena-turant[32].Fifteen microlitres of the PCR products that had been amplified with the cd3aF:R3cd-GC, F1aCu:R3Cu-GC and nosZ-F:nosZ1622R-GC primer pairs were run on denaturing gradients of60–80%for17 h,50–70%for13h and40–70%for17h,respectively. The gels were run in1ÂTAE(40mM Tris-acetate and1 mM EDTA)at130V and60°C.Migration patterns were visualised by staining with1:10000(v/v)SYBR Gold(Molecular probes,Eugene,Canada)for30min followed by UV translumination.Images were docu-mented with the Gel Doc2000System from Bio-Rad (Bio-Rad Laboratories Inc.),and digital pictures were analysed with the Quantity One software from Bio-Rad (Bio-Rad Laboratories Inc.).2.5.Cloning,sequencing and computer analysisThe middle portion of each selected DGGE band was excised for sequence analysis and placed in160l l dis-tilled H2O.The DNA was eluted through freezing and thawing(12h at)70°C,1h at room temperature and1 h at)70°C)followed by thawing at8°C overnight.The eluted fragments were PCR-amplified with primers without a GC-clamp using4l l DNA in a total reaction volume of50l l but otherwise as described above.Prior to sequencing,45l l of each PCR product was purified with Microspin S-400HR columns(Amersham Bio-sciences,NY,USA).To test the resolution on the DGGE gels,the bands were further cloned using the TOPO TA CloningÒKit for Sequencing(Invitrogen, Carlsbad,CA).Cells from randomly picked clones were collected with a toothpick and re-suspended in25l l pre-prepared PCR mixtures,and the inserts were amplified as described above.From each excised DGGE band,10 clones with the correct insert were chosen for sequenc-ing.The plasmids containing nirS,nirK or nosZ gene fragments were isolated using the QIAprep Spin Mini-prep Kit Protocol from Qiagen(Valencia,CA).Both strands of the insert were sequenced with the DYEnamic ET Terminator Cycle Sequencing Kit(Amersham Bio-sciences)with4l l of the eluted plasmids using the plasmid-specific primers M13F and M13R.Twelve bands from each gel were randomly chosen for direct sequencing.The original PCR primers(cd3aF and R3cd;F1aCu and R3Cu;and nosZ-F and nosZ1622R) were then used as sequencing primers.An ABI PRISM 377(Perkin–Elmer,Wellesley,MA)automated DNA sequencer was used for sequencing.Derived nucleotide sequences of nirS,nirK and nosZ were aligned with nucleotide sequences of equivalent length from the GenBank(NCBI)database using the CLUSTAL W software(/clustalw/).A selection of environmental nir clones from marine sediment samples[5,22],estuarine sediments[17],cy-anobacterial bloom[23],forested upland and wetland soils[28],agricultural soil[25],temperate forest soil[13] and contaminated groundwater[15]were included as well as nosZ clones from marine sediments[6],arable soil[26,27]meadow soil[29],coastal seawater(unpub-lished,Accession Nos.AB089825,AB089829and AB089832)and forest soils[13].The environmental clones from each study were chosen to cover the greatest possible sequence variation.The tree analysis was per-formed with the software TREECON[38].Distance matrix analyses were performed with the Jukes and Cantor correction[39].The trees were reconstructed using the neighbor-joining method by Saitou and Nei [40]and tree topology was evaluated by bootstrap analysis using100replicates.2.6.Nucleotide sequence accession numbersThe partial nirS gene sequences that were generated in this study have been deposited in the GenBank da-tabase under Accession Nos.AY4245134–AY425145 and AY583405–AY583455.The nirK sequences are available under AY425146–AY425157and AY583380–AY583404,while the nosZ sequences are found under AY425158,AY425160–AY425169and AY577558–AY577577.3.Results and discussion3.1.Evaluation of PCR-primers for nirS detectionSeveral new options for possible primers were found when the nirS sequences were aligned(Table3;Fig.1a). They are all located in the second half of the gene,where the majority of the sequences have been derived.Un-fortunately,there are only nine complete nirS gene se-quences in the databases.For several nirS primers,small modifications were tested,but in Table1only the results from the best primer targeting each primer site is shown. The best result was obtained with the modified version of primer cd3F[11]cd3aF in combination with the nirS408I.N.Throb€a ck et al./FEMS Microbiology Ecology49(2004)401–417primer R3cd,which partly overlaps with primer nirS4R [9].The pair managed to amplify the correct fragment in 13out of14strains as well as in all environmental samples.No other bands were detected,which elimi-nates the need to purify the correct fragment from agarose gels before downstream analysis.When apply-ing this primer pair to a known nirK-denitrifier(A. faecalis ATCC8750)or to non-denitrifiers,no PCR products were obtained.Primer combinations F1acd:R4bcd,nirS1F:R4bcd and F3nirS:nirS6R man-aged to amplify a fragment of the correct size in the nirK denitrifier A.faecalis ATCC8750.Moreover,a fragment was also amplified from L.reuteri DSM20016with the nirS4F:R4bcd set.In all these cases,the region for the reverse primer is the same,which indicates that this re-gion is less specific than previously believed.Primer cd3F was originally designed for quantifica-tion of cd1-denitrifiers in marine sediments[11].Two additional primer sites were used in this earlier study. Forward primer cd8F is located approximately200bp upstream of the nirS1F site[9],but only seven sequences are known in this region.Moreover,only a few bases seem to be conserved.Primer cd4R corresponds to primers nirS6R[9]and R4cd[10].The most commonly used primers,nirS1F and nirS6R,were less successful in our study and amplified the correct fragment in only eight organisms within four genera.Other potential primers have also been used to survey denitrifying communities.Yan et al.[15]modified the two nirS primers F1acd(renamed to Heme832F)and R4cd (Heme1606)published by Hallin and Lindgren[10]to determine diversity of denitrifying bacteria in ground-water and these were also used for studies of denitrifi-cation genes in sediments[22].The forward primer (KA3-F)used by R€o sch et al.[13]targets a region on the nirS gene corresponding to bases183–206in Pseudo-monas stutzeri ATCC14405.The primer was not used in our evaluation since there are only seven sequences available for this region and they do not appear to be very conserved.Their reverse primer is similar to the one developed by Braker et al.[9].A number of primer combinations targeting nirS failed to amplify the gene in several of the environ-mental samples(Table1).The nirS gene was readily amplified from the activated sludge samples with most of the primers,but we had severe problems with Alunda and Uller aker soil samples and the peat.It was only from the new primer pair cd3aF:R3cd that we obtained an amplicon of the correct size from all samples.The commonly used nirS1F:nirS6R primers did not work well on soil samples and we only obtained a product from Brunnby soil.Others have also encountered problems in detecting nirS in soils with these primers and reported a low nirS abundance and diversity in soil [28].This could likely be a consequence of the primers used,although it might also be a correct description of the samples.Based on the results from our evaluation, we conclude that the cd3aF:R3cd primer set would be the best for community analysis of nirS denitrifiers.The fragment size is also suitable for DGGE.3.2.Evaluation of PCR-primers for nirK detectionFor amplification of nirK,no better alternatives to the already published primers were found(Table3; Fig.1b).Amplification with most of the combinations resulted in fragments of the correct size in only about half of the strains that were tested.However,no PCR products were found when tested with P.stutzeri ATCC 14405or the three non-denitrifying strains for any combination.The best results were obtained with the primers F1aCu and R3Cu[10]that amplified the correct fragment in10out of14strains without extra bands.In addition,fragments of the correct size were amplified from all six environmental samples.The nirK1F and nirK5R primers[9]are the most widely used tools to survey diversity of the NirK deni-trifying bacteria in environmental samples.The nirK1F primer binds to a region of the nirK gene that has an insert of three bases in some sequences of denitrifying bacteria(Accession.Nos.AJ002516,U62291, AF339044–AF339048and AB076606).This insert may be the explanation for the poor amplification of this particular primer.R€o sch et al.[13]used a forward pri-mer that targets the same area as primer nirK1F,but is a few bases longer.This primer faces the same problem as nirK1F.Yan et al.[15]as well as Liu et al.[22]used a modified version of the F1aCu primer together with a modification of primer nirK3R[9].The nirK3R primer was unsuccessful both in the original study and in the present re-evaluation,and the small number of con-served bases within the sequences may be the explana-tion.The Cunir3primer designed by Casciotti and Ward [12]targets a highly conserved region encoding for a copper-binding site,but unfortunately there are only a few sequences available in this region.If they are not representative,this would explain the poor results from the amplification of denitrifying strains in the present study.There are only12complete nirK gene sequences in the databases.As in the case of nirS,the nirK gene was amplified from activated sludge and peat with the majority of the primer combinations(Table1).It was more difficult with the soil samples.Only primer combinations F1aCu:R3Cu and nirK1F:nirK5R amplified all envi-ronmental samples.Both of these sets generate ampli-cons of almost the right size for DGGE,but we chose to use the F1aCu:R3Cu set because it yields an amplicon that is ca.40bp shorter and less than500bp.Moreover, the results from PCR with the strains were better and the three base insert in the primer site of nirK1F is avoided.I.N.Throb€a ck et al./FEMS Microbiology Ecology49(2004)401–417409。
WINCOR 主控制错误代码及相应措施
7
0
测量站(DDU)未执行就绪
检查DDU区域是否有钞票堵塞,线缆是否连接正确。
如果故障还不能排除,那要更换DDU或V模块。
7
X
出钞信号器PSDx被弄脏或压紧传感器出现故障
1.如果钞箱能够正确插入第“X”个V模块(听到单一的哔声),则错误表明在“X”V模块上有一个出钞传感器(LAMX)很脏,需要清洁,最后复位;
注:在第一次出现这个故障时AZM可以执行操作,随着污物的增加而渐渐地不能执行。
2.如果钞箱不能插入“X”V模块(也就是说几秒钟之后仍未听到哔哔声),则接线到ZAC、压力传感器(RLX)必须检查,或V模块或控制板必须更换。
8
X
钞箱空传感器太脏(X=1-6)
清洁相应V模块上的PSEx传感器,以及相应钞箱压力传递装置上的棱镜。最后复位(将CMD-V4放在出钞位置)。用测试程序自检中的“DYK”检查所有传感器的清洁程度(即检测光传感器、光放大器的状态):如果返回的状态为“3”或以上(TKD错误)则必须进行清洁。复位之后可以查询其状态是否被改善。
注:在第一次出现错误代码“9X”时可以执行操作,随着污物的增加而渐渐地不能执行。
93
钞箱空传感器PS2
95
出钞传感器PS27
9A
SHUTTER传感器PS28
2
5
主马达(DCM1)故障
在机器启动后的一段时间内主马达的转速难以达到最小转速,选择功能测试1复位,如果运行时马达发出大的响声,检查CMD-V4的钞票传输路径是否发出严重的堵塞,检查回收箱的入口是否堵塞;
将CMD-V4推到出钞位置,后选择功能测试2,特别注意马达的声音和主马达的传送功能。如果主马达不能运转或者结束后依然返回25,则须更换STA或控制板。
干涉仪成像畸变引起测量误差的校正方法
干涉仪成像畸变引起测量误差的校正方法刘满林;杨旺;许伟才【摘要】Based on the wavefront aberration theory and interferometric theory, the influences of imaging distortion in an interferometer on measuring results are analyzed and calibration and correction methods for the imaging distortion are proposed. The measurement errors caused by misalignments of the test surface (tip/tilt and disfocus) are discussed mainly. An experiment is carried out to measure the same surface under different number of fringes. The test results show that the surface shapes are 30. 96 nm PV and 6. 32 nm RMS for 3 fringes, and 41. 25 nm PV and 8.22 nm RMS for 10 fringes,respectively. After the calibration, the difference of the results are declined to 1. 42 nm PV and 0. 4 nm RMS. The experiment proves that the calibration solution referred in this paper can improve the measurement accuracy.%根据光学系统的波像差理论和干涉检测原理,分析了干涉仪系统的成像畸变对测量结果的影响,提出了对干涉仪系统的成像畸变进行标定和校正的方法.重点讨论了被测面的摆放存在倾斜和离焦两种情况下产生的测量误差,并提出了误差校正方法.实验中对同一个被测面进行多次测量,结果显示,干涉图样为3个条纹时的面形测量结果为30.96nm PV,6.32 nm RMS,10个条纹时的面形测量结果为41.25 nm PV,8.22 nm RMS.校正后两次测量的PV值差降低到1.42 nm,RMS值差为0.4nm.实验结果表明:提出的畸变校正方法可以有效地降低测量误差,提高测量结果的复现性,为高精度面形测量提供参考.【期刊名称】《光学精密工程》【年(卷),期】2011(019)010【总页数】6页(P2349-2354)【关键词】干涉检测;成像畸变;测量精度;误差校正【作者】刘满林;杨旺;许伟才【作者单位】中国科学院长春光学精密机械与物理研究所应用光学国家重点实验室,吉林长春130033;中国科学院长春光学精密机械与物理研究所应用光学国家重点实验室,吉林长春130033;中国科学院长春光学精密机械与物理研究所应用光学国家重点实验室,吉林长春130033;中国科学院研究生院,北京100039【正文语种】中文【中图分类】TH744.31 引言干涉仪测量误差可以分为随机误差和系统误差两大类。