JohnHull《期货、期权和衍生证券》13章习题解答
约翰.赫尔,期权期货和其他衍生品(third edition)习题答案
12.1 一个证券组合当前价值为$1000万,β值为1.0,S&P100目前位于250,解释一个执行价格为240。
标的物为S&P100的看跌期权如何为该组合进行保险?当S&P100跌到480,这个组合的期望价值是10 ×(480/500)=$9.6million.买看跌期权10,000,000/500=20,000可以防止这个组合下跌到$9.6million下的损失。
因此总共需要200份合约12.2 “一旦我们知道了支付连续红利股票的期权的定价方法,我们便知道了股票指数期权、货币期权和期货期权的定价”。
请解释这句话。
一个股票指数类似一个连续支付红利的股票12.3 请说明日圆看涨期权与日圆期货看涨期权的不同之处一个日元的看涨期权给了持有者在未来某个时刻以确定的价格购买日圆的权利,一个日圆远期看涨期权给予持有者在未来时刻远期价格超过特定范围按原先价格购买日圆的权利。
如果远期齐权行使,持有者将获得一个日圆远期和约的多头。
12.4请说明货币期权是如何进行套期保值的?12.5 计算3个月期,处于平价状态的欧式看涨股票指数期权的价值。
指数为250。
无风险年利率为10%,指数年波动率为18%,指数的年红利收益率为3%。
一个日元的看涨期权给了持有者在未来某个时刻以确定的价格购买日圆的权利,一个日圆远期看涨期权给予持有者在未来时刻远期价格超过特定范围按原先价格购买日圆的权利。
如果远期齐权行使,持有者将获得一个日圆远期和约的多头。
12.6 有一美式看涨期货期权,期货合约和期权合约同时到期。
在任何情况下期货期权比相应的标的物资产的美式期权更值钱?当远期价格大于即期价格时,美式远期期权在远期和约到期前的价值大于相对应的美式期权/12.7 计算5个月有效期的欧式看跌期货期权的价值。
期货价格为$19,执行价格为$20,无风险年利率为12%。
期货价格的年波动率为20%。
本题中12.8 假设交易所构造了一个股票指数。
《期货市场基础》课后习题参考答案(第13章)

《期货市场基础》课后习题参考答案(第13章)1、期货市场风险的类型怎么划分?期货市场风险的成因是什么?风险类型的划分:(1)从风险是否可控的角度划分可以为不可控风险和可控风险(2)从期货交易环节划分分为代理风险、交易风险、交割风险(3)从风险产生的主体划分分为期货期货交易所、期货经纪公司、客户、政府(4)从风险成因划分可分为市场风险、信用风险、流动风险操作风险、法律风险风险的成因:(1)价格波动(2)杠杆效应(3)非理性投机(4)市场机制不健全2、期货市场风险应从哪几个方面进行管理?我国期货市场监管体系基本与美国相同,形成了中国证监会、中国期货业协会、期货交易所三级监管体系。
通过立法管理、行政管理与行业自律管理三个方面对期货市场进行风险监管。
3、从政府角度来讲,应如何进行期货市场风险管理?国际期货市场的风险监管体系有美国、英国、中国香港等几种模式。
美国的期货市场在经历了一百多年的发展后,形成了政府宏观管理、行业协会自律及期货市场主体自我管理的三级风险管理体育,具有代表性。
4、从交易所角度来讲,如何对期货市场的风险进行管理?(1)正确建立和严格执行有关风险监控制度(2)建立对交易全过程进行运态风险监控机制(3)建立和严格管理风险基金5、期货经济公司是如何控制风险的?(1)控制客户信用风险(2)严格执行保证金和追加保证金制度(3)严格经济管理(4)加强经济人员的管理,提高业务运作能力6、从客户角度来讲,应如何防范期货经济公司可能给其带来的风险?(1)充分了解和认识期货交易的基本特点(2)慎重选择经济公司(3)制定正确投资战略,将风险降至可以承受的程度(4)规范自身行为,提高风险意识和心理承受力7、期货业协会在风险监管中起什么作用、有何具体职责?协会的宗旨是贯彻执行国家法律法规和国家有关期货市场的方针政策,发挥政府与行业之间的桥梁和纽带作用,实行行业自律管理,维护会员的合法权益,维护期货市场的公开、公平、公正原则,开展对期货从业人员的职业道德教育,专业技术培训和严格管理,促进中国期货市场规范、健康、稳定地发展。
期权期货和其它衍生产品第三版约翰赫尔答案精编

期权期货和其它衍生产品第三版约翰赫尔答案精编Document number:WTT-LKK-GBB-08921-EIGG-22986第一章请解释远期多头与远期空头的区别。
答:远期多头指交易者协定将来以某一确定价格购入某种资产;远期空头指交易者协定将来以某一确定价格售出某种资产。
请详细解释套期保值、投机与套利的区别。
答:套期保值指交易者采取一定的措施补偿资产的风险暴露;投机不对风险暴露进行补偿,是一种“赌博行为”;套利是采取两种或更多方式锁定利润。
请解释签订购买远期价格为$50的远期合同与持有执行价格为$50的看涨期权的区别。
答:第一种情况下交易者有义务以50$购买某项资产(交易者没有选择),第二种情况下有权利以50$购买某项资产(交易者可以不执行该权利)。
一位投资者出售了一个棉花期货合约,期货价格为每磅50美分,每个合约交易量为50,000磅。
请问期货合约结束时,当合约到期时棉花价格分别为(a)每磅美分;(b)每磅美分时,这位投资者的收益或损失为多少答:(a)合约到期时棉花价格为每磅$时,交易者收入:($$)×50,000=$900;(b)合约到期时棉花价格为每磅$时,交易者损失:($$ ×50,000=$650假设你出售了一个看跌期权,以$120执行价格出售100股IBM的股票,有效期为3个月。
IBM股票的当前价格为$121。
你是怎么考虑的你的收益或损失如何答:当股票价格低于$120时,该期权将不被执行。
当股票价格高于$120美元时,该期权买主执行该期权,我将损失100(st-x)。
你认为某种股票的价格将要上升。
现在该股票价格为$29,3个月期的执行价格为$30的看跌期权的价格为$.你有$5,800资金可以投资。
现有两种策略:直接购买股票或投资于期权,请问各自潜在的收益或损失为多少答:股票价格低于$29时,购买股票和期权都将损失,前者损失为$5,800$29×(29-p),后者损失为$5,800;当股票价格为(29,30),购买股票收益为$5,800$29×(p-29),购买期权损失为$5,800;当股票价格高于$30时,购买股票收益为$5,800$29×(p-29),购买期权收益为$$5,800$29×(p-30)-5,800。
JohnHull《期货期权和衍生证券》章习题解答

CHAPTER 13Wiener P rocesses and Itô’s LemmaPractice QuestionsProblem 13.1.What would it mean to assert that the temperature at a certain place follows a Markov process? Do you think that temperatures do, in fact, follow a Markov process?Imagine that you have to forecast the future temperature from a) the current temperature, b) the history of the temperature in the last week, and c) a knowledge ofseasonal averages and seasonal trends. If temperature followed a Markov process, the history of the temperature in the last week would be irrelevant.To answer the second part of the question you might like to consider the following scenario for the first week in May:(i) Monday to Thursday are warm days; today, Friday, is a very cold day. (ii) Monday to Friday are all very cold days.What is your forecast for the weekend? If you are more pessimistic in the case of the second scenario, temperatures do not follow a Markov process.Problem 13.2.Can a trading rule based on the past history of a stock’s price ever produce returns that are consistently above average? Discuss.The first point to make is that any trading strategy can, just because of good luck, produce above average returns. The key question is whether a trading strategy consistently outperforms the market when adjustments are made for risk. It is certainly possible that a trading strategy could do this. However, when enough investors know about the strategy and trade on the basis of the strategy, the profit will disappear.As an illustration of this, consider a phenomenon known as the small firm effect. Portfolios of stocks in small firms appear to have outperformed portfolios of stocks in large firms when appropriate adjustments are made for risk. Research was published about this in the early 1980s and mutual funds were set up to take advantage of the phenomenon. There is some evidence that this has resulted in the phenomenon disappearing.Problem 13.3.A company’s cash position, measured in millions of dollars, follows a generalized Wiener process with a drift rate of 0.5 per quarter and a variance rate of 4.0 per quarter. How high does the company’s initial cash position have to be for the company to have a less than 5% chance of a negative cash position by the end of one year?Supp ose that the company’s initial cash position is x . The probability distribution of the cash position at the end of one year is (40544)(2016)x x ϕϕ+⨯.,⨯=+.,where ()m v ϕ, is a normal probability distribution with mean m and variance v . The probability of a negative cash position at the end of one year is204x N +.⎛⎫- ⎪⎝⎭where ()N x is the cumulative probability that a standardized normal variable (with mean zero and standard deviation 1.0) is less than x . From normal distribution tables200054x N +.⎛⎫-=. ⎪⎝⎭when:20164494x +.-=-.i.e., when 45796x =.. The initial cash position must therefore be $4.58 million.Problem 13.4.Variables 1X and 2X follow generalized Wiener processes with drift rates 1μ and2μ and variances 21σ and 22σ. What process does 12X X + follow if:(a) The changes in 1X and 2X in any short interval of time are uncorrelated?(b) There is a correlation ρ between the changes in 1X and 2X in any short interval of time?(a) Suppose that X 1 and X 2 equal a 1 and a 2 initially. After a time period of length T , X 1 has the probability distribution2111()a T T ϕμσ+,and 2X has a probability distribution2222()a T T ϕμσ+,From the property of sums of independent normally distributed variables, 12X X + has the probability distribution()22112212a T a T T T ϕμμσσ+++,+i.e.,22121212()()a a T T ϕμμσσ⎡⎤+++,+⎣⎦This shows that 12X X + follows a generalized Wiener process with drift rate 12μμ+and variance rate 2212σσ+.(b) In this case the change in the value of 12X X + in a short interval of time t ∆ has the probability distribution:22121212()(2)t t ϕμμσσρσσ⎡⎤+∆,++∆⎣⎦If 1μ, 2μ, 1σ, 2σ and ρ are all constant, arguments similar to those in Section 13.2 show that the change in a longer period of time T is22121212()(2)T T ϕμμσσρσσ⎡⎤+,++⎣⎦The variable,12X X +, therefore follows a generalized Wiener process with drift rate12μμ+ and variance rate 2212122σσρσσ++.Problem 13.5.Consider a variable,S , that follows the process dS dt dz μσ=+For the first three years, 2μ= and 3σ=; for the next three years, 3μ= and 4σ=. If the initial value of the variable is 5, what is the probability distribution of the value of the variable at the end of year six?The change in S during the first three years has the probability distribution (2393)(627)ϕϕ⨯,⨯=,The change during the next three years has the probability distribution (33163)(948)ϕϕ⨯,⨯=,The change during the six years is the sum of a variable with probability distribution(627)ϕ, and a variable with probability distribution (948)ϕ,. The probability distribution of the change is therefore (692748)ϕ+,+ (1575)ϕ=,Since the initial value of the variable is 5, the probability distribution of the value of the variable at the end of year six is (2075)ϕ,Problem 13.6.Suppose that G is a function of a stock price, S and time. Suppose that S σ and G σ are the volatilities of S and G . Show that when the expected return of S increases by S λσ, the growth rate of G increases by G λσ, where λ is a constant.From Itô’s lemmaG S GG S Sσσ∂=∂Also the drift of G is222212G G G S S S t S μσ∂∂∂++∂∂∂where μ is the expected return on the stock. When μ increases by S λσ, the drift of Gincreases byS GS Sλσ∂∂ orG G λσThe growth rate of G , therefore, increases by G λσ.Problem 13.7.Stock A and stock B both follow geometric Brownian motion. Changes in any short interval of time are uncorrelated with each other. Does the value of a portfolio consisting of one of stock A and one of stock B follow geometric Brownian motion? Explain your answer.Define A S , A μ and A σ as the stock price, expected return and volatility for stock A. Define B S , B μ and B σ as the stock price, expected return and volatility for stock B. Define A S ∆ and B S ∆ as the change in A S and B S in time t ∆. Since each of the two stocks follows geometric Brownian motion,A A A A A S S t S μσε∆=∆+B B B B B S S t S μσε∆=∆+where A ε and B ε are independent random samples from a normal distribution.()(A B A A B B A A A B B B S S S S t S S μμσεσε∆+∆=+∆++This cannot be written as()()A B A B A B S S S S t S S μσ∆+∆=+∆++for any constants μ and σ. (Neither the drift term nor the stochastic term correspond.) Hence the value of the portfolio does not follow geometric Brownian motion.Problem 13.8.S S t S μσε∆=∆+ where μ and σ are constant. Explain carefully the difference between this model andeach of the following:S t S S t S t S μσεμσεμσε∆=∆+∆=∆+∆=∆+Why is the model in equation (13.8) a more appropriate model of stock price behavior than any of these three alternatives?In:S S t S μσε∆=∆+ the expected increase in the stock price and the variability of the stock price are constant when both are expressed as a proportion (or as a percentage) of the stock price In:S t μ∆=∆+the expected increase in the stock price and the variability of the stock price are constant in absolute terms. For example, if the expected growth rate is $5 per annum when the stockprice is $25, it is also $5 per annum when it is $100. If the standard deviation of weekly stock price movements is $1 when the price is $25, it is also $1 when the price is $100. In:S S t μ∆=∆+the expected increase in the stock price is a constant proportion of the stock price while the variability is constant in absolute terms. In:S t S μσ∆=∆+the expected increase in the stock price is constant in absolute terms while the variability of the proportional stock price change is constant. The model:S S t S μσ∆=∆+ is the most appropriate one since it is most realistic to assume that the expected percentage return and the variability of the percentage return in a short interval are constant.Problem 13.9.It has been suggested that the short-term interest rate,r , follows the stochastic process()dr a b r dt rc dz =-+where a , b , and c are positive constants and dz is a Wiener process. Describe the nature of this process.The drift rate is ()a b r -. Thus, when the interest rate is above b the drift rate is negative and, when the interest rate is below b , the drift rate is positive. The interest rate is therefore continually pulled towards the level b . The rate at which it is pulled toward this level is a . A volatility equal to c is superimposed upon the “pull” or the drift.Suppose 04a =., 01b =. and 015c =. and the current interest rate is 20% per annum. The interest rate is pulled towards the level of 10% per annum. This can be regarded as a long run average. The current drift is 4-% per annum so that the expected rate at the end of one year is about 16% per annum. (In fact it is slightly greater than this, because as the interest rate decreases, the “pull” decreases.) Superimposed upon the drift is a volatility of 15% per annum.Problem 13.10.Suppose that a stock price, S , follows geometric Brownian motion with expected return μ and volatility σ: dS S dt S dz μσ=+What is the process followed by the variable n S ? Show that n S also follows geometric Brownian motion.If ()n G S t S ,= then 0G t ∂/∂=, 1n G S nS -∂/∂=, and 222(1)n G S n n S -∂/∂=-. Using Itô’s lemma:21[(1)]2dG nG n n G dt nG dz μσσ=+-+This shows that n G S = follows geometric Brownian motion where the expected return is21(1)2n n n μσ+-and the volatility is n σ. The stock price S has an expected return of μ and the expected value of T S is 0T S e μ. The expected value of n T S is212[(1)]0n n n T n S eμσ+-Problem 13.11.Suppose that x is the yield to maturity with continuous compounding on a zero-coupon bond that pays off $1 at time T . Assume that x follows the process0()dx a x x dt sx dz =-+where a , 0x , and s are positive constants and dz is a Wiener process. What is the process followed by the bond price?The process followed by B , the bond price, is from Itô’s lemma:222021()2B B B B dB a x x s x dt sxdz x t x x ⎡⎤⎢⎥⎢⎥⎢⎥⎣⎦∂∂∂∂=-+++∂∂∂∂Since: ()x T t B e --=the required partial derivatives are()()22()22()()()()x T t x T t x T t Bxe xB t BT t e T t B x B T t e T t B x------∂==∂∂=--=--∂∂=-=-∂ Hence:22201()()()()2dB a x x T t x s x T t Bdt sx T t Bdz⎡⎤⎢⎥⎢⎥⎢⎥⎣⎦=---++---Problem 13.12 (Excel Spreadsheet)A stock whose price is $30 has an expected return of 9% and a volatility of 20%. In Excel simulate the stock price path over 5 years using monthly time steps and random samples from a normal distribution. Chart the simulated stock price path. By hitting F9 observe how the path changes as the random sample change.The process ist S t S S ∆⨯ε⨯⨯+∆⨯⨯=∆20.009.0Where ∆t is the length of the time step (=1/12) and ε is a random sample from a standard normal distribution.Further QuestionsProblem 13.13.Suppose that a stock price has an expected return of 16% per annum and a volatility of 30% per annum. When the stock price at the end of a certain day is $50, calculate the following:(a) The expected stock price at the end of the next day.(b) The standard deviation of the stock price at the end of the next day. (c) The 95% confidence limits for the stock price at the end of the next day.With the notation in the text2()St t S ϕμσ∆∆,∆In this case 50S =, 016μ=., 030σ=. and 1365000274t ∆=/=.. Hence(016000274009000274)50(0000440000247)Sϕϕ∆.⨯.,.⨯.=.,.and2(50000044500000247)S ϕ∆⨯.,⨯.that is, (002206164)S ϕ∆.,.(a)(b) The standard deviation of the stock price at the end of the next day is 0785=. (c) 95% confidence limits for the stock price at the end of the next day are 500221960785and 500221960785.-.⨯..+.⨯. i.e.,4848and 5156..Note that some students may consider one trading day rather than one calendar day. Then 1252000397t ∆=/=.. The answer to (a) is then 50.032. The answer to (b) is 0.945. The answers to part (c) are 48.18 and 51.88.Problem 13.14.A company’s cash position, measured in millions of dollars, follows a generalized Wiener process with a drift rate of 0.1 per month and a variance rate of 0.16 per month. The initial cash position is 2.0.(a) What are the probability distributions of the cash position after one month, six months, and one year?(b) What are the probabilities of a negative cash position at the end of six months and one year?(c) At what time in the future is the probability of a negative cash position greatest?(a) The probability distributions are:(2001016)(21016)ϕϕ.+.,.=.,.(20060166)(26096)ϕϕ.+.,.⨯=.,.(201201612)(32196)ϕϕ.+.,.⨯=.,.(b) The chance of a random sample from (26096)ϕ.,. being negative is(265)N N ⎛=-. ⎝where ()N x is the cumulative probability that a standardized normal variable [i.e., avariable with probability distribution (01)ϕ,] is less than x . From normaldistribution tables (265)00040N -.=.. Hence the probability of a negative cash position at the end of six months is 0.40%.Similarly the probability of a negative cash position at the end of one year is(230)00107N N ⎛=-.=. ⎝or 1.07%.(c) In general the probability distribution of the cash position at the end of x months is(2001016)x x ϕ.+.,.The probability of the cash position being negative is maximized when:is minimized. Define11223122325025250125(250125)y x xdy x xdxx x----==+.=-.+.=-.+.This is zero when 20x=and it is easy to verify that 220d y dx/>for this value of x. It therefore gives a minimum value for y. Hence the probability of a negative cash position is greatest after 20 months.Problem 13.15.Suppose that x is the yield on a perpetual government bond that pays interest at the rate of $1 per annum. Assume that x is expressed with continuous compounding, that interest is paid continuously on the bond, and that x follows the process()dx a x x dt sx dz=-+where a,x, and s are positive constants and dz is a Wiener process. What is the process followed by the bond price? What is the expected instantaneous return (including interest and capital gains) to the holder of the bond?The process followed by B, the bond price, is from Itô’s lemma:222021()2B B B BdB a x x s x dt sxdzx t x x⎡⎤⎢⎥⎢⎥⎢⎥⎣⎦∂∂∂∂=-+++∂∂∂∂In this case1Bx=so that:222312B B Bt x x x x∂∂∂=;=-;=∂∂∂Hence2202322021121()21()dB a x x s x dt sxdzx x xs sa x x dt dzx x x⎡⎤=--+-⎢⎥⎣⎦⎡⎤=--+-⎢⎥⎣⎦The expected instantaneous rate at which capital gains are earned from the bond is therefore:2021()sa x xx x--+The expected interest per unit time is 1. The total expected instantaneous return is therefore:20211()sa x xx x--+When expressed as a proportion of the bond price this is:202111()sa x xx x x⎛⎫⎛⎫--+ ⎪⎪⎝⎭⎝⎭20()ax x x s x=--+Problem 13.16.If S follows the geometric Brownian motion process in equation (13.6), what is the process followed by (a) y = 2S, (b) y=S 2 , (c) y=e S , and (d) y=e r(T-t)/S. In each case express the coefficients of dt and dz in terms of y rather than S.(a) In this case 2y S ∂/∂=, 220y S ∂/∂=, and 0y t ∂/∂= so that Itô’s lemma gives 22dy S dt S dz μσ=+or dy y dt y dz μσ=+(b) In this case 2y S S ∂/∂=, 222y S ∂/∂=, and 0y t ∂/∂= so that Itô’s lemma gives2222(2)2dy S S dt S dz μσσ=++ or2(2)2dy y dt y dz μσσ=++ (c) In this case S y S e ∂/∂=, 22S y S e ∂/∂=, and 0y t ∂/∂= so that Itô’s lemma gives22(2)S S S dy Se S e dt Se dz μσσ=+/+ or22[ln (ln )2]ln dy y y y y dt y y dz μσσ=+/+(d) In this case ()2r T t y S e S y S -∂/∂=-/=-/, 22()3222r T t y S e S y S -∂/∂=/=/, and()r T t y t re S ry -∂/∂=-/=- so that Itô’s lemma gives2()dy ry y y dt y dz μσσ=--+- or2()dy r y dt y dz μσσ=-+--Problem 13.17.A stock price is currently 50. Its expected return and volatility are 12% and 30%,respectively. What is the probability that the stock price will be greater than 80 in two years? (Hint 80T S > when ln ln 80T S >.)The variable ln T S is normally distributed with mean 20ln (2)S T μσ+-/ and standarddeviation σ050S =, 012μ=., 2T =, and 030σ=. so that the meanand standard deviation of ln T S are 2ln 50(012032)24062+.-./=. and 00424.=., respectively. Also, ln804382=.. The probability that 80T S > is the same as the probability that ln 4382T S >.. This is4382406211(0754)0424N N .-.⎛⎫-=-. ⎪.⎝⎭where ()N x is the probability that a normally distributed variable with mean zero and standard deviation 1 is less than x . From the tables at the back of the book (0754)0775N .=. so that the required probability is 0.225.Problem 13.18 (See Excel Worksheet)Stock A, whose price is $30, has an expected return of 11% and a volatility of 25%. Stock B, whose price is $40, has an expected return of 15% and a volatility of 30%. The processes driving the returns are correlated with correlation parameter ρ. In Excel, simulate the two stock price paths over three months using daily time steps and random samples from normal distributions. Chart the results and by hitting F9 observe how the paths change as the random samples change. Consider values of ρ equal to 0.50, 0.75, and 0.95.The processes aret S t S S A A A A ∆⨯ε⨯⨯+∆⨯⨯=∆25.011.0t S t S S B B B B ∆⨯ε⨯⨯+∆⨯⨯=∆30.015.0Where ∆t is the length of the time step (=1/252) and the ε’s are correlated samples from standard normal distributions.。
约翰.赫尔,期权期货和其他衍生品(third edition)习题答案
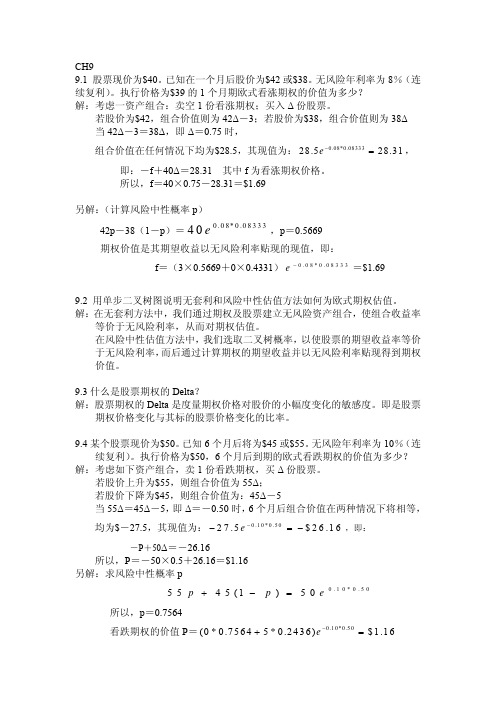
CH99.1 股票现价为$40。
已知在一个月后股价为$42或$38。
无风险年利率为8%(连续复利)。
执行价格为$39的1个月期欧式看涨期权的价值为多少? 解:考虑一资产组合:卖空1份看涨期权;买入Δ份股票。
若股价为$42,组合价值则为42Δ-3;若股价为$38,组合价值则为38Δ 当42Δ-3=38Δ,即Δ=0.75时,组合价值在任何情况下均为$28.5,其现值为:,0.08*0.0833328.528.31e −=即:-f +40Δ=28.31 其中f 为看涨期权价格。
所以,f =40×0.75-28.31=$1.69另解:(计算风险中性概率p ) 42p -38(1-p )=,p =0.56690.08*0.0833340e期权价值是其期望收益以无风险利率贴现的现值,即: f =(3×0.5669+0×0.4331)=$1.690.08*0.08333e−9.2 用单步二叉树图说明无套利和风险中性估值方法如何为欧式期权估值。
解:在无套利方法中,我们通过期权及股票建立无风险资产组合,使组合收益率等价于无风险利率,从而对期权估值。
在风险中性估值方法中,我们选取二叉树概率,以使股票的期望收益率等价于无风险利率,而后通过计算期权的期望收益并以无风险利率贴现得到期权价值。
9.3什么是股票期权的Delta ?解:股票期权的Delta 是度量期权价格对股价的小幅度变化的敏感度。
即是股票期权价格变化与其标的股票价格变化的比率。
9.4某个股票现价为$50。
已知6个月后将为$45或$55。
无风险年利率为10%(连续复利)。
执行价格为$50,6个月后到期的欧式看跌期权的价值为多少? 解:考虑如下资产组合,卖1份看跌期权,买Δ份股票。
若股价上升为$55,则组合价值为55Δ;若股价下降为$45,则组合价值为:45Δ-5 当55Δ=45Δ-5,即Δ=-0.50时,6个月后组合价值在两种情况下将相等,均为$-27.5,其现值为:,即:0.10*0.5027.5$26.16e −−=− -P +50Δ=-26.16所以,P =-50×0.5+26.16=$1.16 另解:求风险中性概率p0.10*0.505545(1)50p p e+−= 所以,p =0.7564看跌期权的价值P =0.10*0.50(0*0.75645*0.2436)$1.16e −+=9.5 某个股票现价为$100。
期权期货和其它衍生产品第三版约翰赫尔答案

第一章1.1请解释远期多头与远期空头的区别。
答:远期多头指交易者协定将来以某一确定价格购入某种资产;远期空头指交易者协定将来以某一确定价格售出某种资产。
1.2请详细解释套期保值、投机与套利的区别。
答:套期保值指交易者采取一定的措施补偿资产的风险暴露;投机不对风险暴露进行补偿,是一种“赌博行为”;套利是采取两种或更多方式锁定利润。
1.3请解释签订购买远期价格为$50的远期合同与持有执行价格为$50的看涨期权的区别。
答:第一种情况下交易者有义务以50$购买某项资产(交易者没有选择),第二种情况下有权利以50$购买某项资产(交易者可以不执行该权利)。
1.4一位投资者出售了一个棉花期货合约,期货价格为每磅50美分,每个合约交易量为50,000磅。
请问期货合约结束时,当合约到期时棉花价格分别为(a)每磅48.20美分;(b)每磅51.30美分时,这位投资者的收益或损失为多少?答:(a)合约到期时棉花价格为每磅$0.4820时,交易者收入:($0.5000-$0.4820)×50,000=$900;(b)合约到期时棉花价格为每磅$0.5130时,交易者损失:($0.5130-$0.5000) ×50,000=$6501.5假设你出售了一个看跌期权,以$120执行价格出售100股IBM的股票,有效期为3个月。
IBM股票的当前价格为$121。
你是怎么考虑的?你的收益或损失如何?答:当股票价格低于$120时,该期权将不被执行。
当股票价格高于$120美元时,该期权买主执行该期权,我将损失100(st-x)。
1.6你认为某种股票的价格将要上升。
现在该股票价格为$29,3个月期的执行价格为$30的看跌期权的价格为$2.90.你有$5,800资金可以投资。
现有两种策略:直接购买股票或投资于期权,请问各自潜在的收益或损失为多少?答:股票价格低于$29时,购买股票和期权都将损失,前者损失为$5,800$29×(29-p),后者损失为$5,800;当股票价格为(29,30),购买股票收益为$5,800$29×(p-29),购买期权损失为$5,800;当股票价格高于$30时,购买股票收益为$5,800$29×(p-29),购买期权收益为$$5,800$29×(p-30)-5,800。
赫尔期权、期货及其他衍生产品(第9版)笔记和课后习题详解
赫尔《期权、期货及其他衍生产品》(第9版)笔记和课后习题详解目录第1章引言1.1复习笔记1.2课后习题详解第2章期货市场的运作机制2.1复习笔记2.2课后习题详解第3章利用期货的对冲策略3.1复习笔记3.2课后习题详解第4章利率4.1复习笔记4.2课后习题详解第5章如何确定远期和期货价格5.1复习笔记5.2课后习题详解第6章利率期货6.1复习笔记6.2课后习题详解第7章互换7.1复习笔记7.2课后习题详解第8章证券化与2007年信用危机8.1复习笔记8.2课后习题详解第9章OIS贴现、信用以及资金费用9.1复习笔记9.2课后习题详解第10章期权市场机制10.1复习笔记10.2课后习题详解第11章股票期权的性质11.1复习笔记11.2课后习题详解第12章期权交易策略12.1复习笔记12.2课后习题详解第13章二叉树13.1复习笔记13.2课后习题详解第14章维纳过程和伊藤引理14.1复习笔记14.2课后习题详解第15章布莱克-斯科尔斯-默顿模型15.1复习笔记15.2课后习题详解第16章雇员股票期权16.1复习笔记16.2课后习题详解第17章股指期权与货币期权17.1复习笔记17.2课后习题详解第18章期货期权18.1复习笔记18.2课后习题详解第19章希腊值19.1复习笔记19.2课后习题详解第20章波动率微笑20.1复习笔记20.2课后习题详解第21章基本数值方法21.1复习笔记21.2课后习题详解第22章风险价值度22.1复习笔记22.2课后习题详解第23章估计波动率和相关系数23.1复习笔记23.2课后习题详解第24章信用风险24.1复习笔记24.2课后习题详解第25章信用衍生产品25.1复习笔记25.2课后习题详解第26章特种期权26.1复习笔记26.2课后习题详解第27章再谈模型和数值算法27.1复习笔记27.2课后习题详解第28章鞅与测度28.1复习笔记28.2课后习题详解第29章利率衍生产品:标准市场模型29.1复习笔记29.2课后习题详解第30章曲率、时间与Quanto调整30.1复习笔记30.2课后习题详解第31章利率衍生产品:短期利率模型31.1复习笔记31.2课后习题详解第32章HJM,LMM模型以及多种零息曲线32.1复习笔记32.2课后习题详解第33章再谈互换33.1复习笔记33.2课后习题详解第34章能源与商品衍生产品34.1复习笔记34.2课后习题详解第35章章实物期权35.1复习笔记35.2课后习题详解第36章重大金融损失与借鉴36.1复习笔记36.2课后习题详解赫尔的《期权、期货及其他衍生产品》是世界上流行的证券学教材之一。
约翰.赫尔,期权期货和其他衍生品(third edition)习题答案
8.14 执行价格为$60 的看涨期权成本为$6,相同执行价格和到期日的看跌期权成
本为$4,制表说明跨式期权损益状况。请问:股票价格在什么范围内时,
跨式期权将导致损失呢?
解:可通过同时购买看涨看跌期权构造跨式期权:max( ST -60,0)+max(60
- ST )-(6+4),其损益状况为:
股价 ST
解:(a)该组合等价于一份固定收益债券多头,其损益V = C ,不随股票价格变化。 (V 为组合损益,C 为期权费,下同)如图 8.2: (b)该组合等价于一份股票多头与一份固定收益债券多头,其损益V = ST + C , 与股价同向同幅度变动。( ST 为最终股票价格,下同)如图 8.3 (c)该组合等价于一份固定收益债券多头与一份看涨期权空头,其损益为
8.18 盒式价差期权是执行价格为 X 1 和 X 2 的牛市价差期权和相同执行价格的熊 市看跌价差期权的组合。所有期权的到期日相同。盒式价差期权有什么样的 特征?
解:牛市价差期权由 1 份执行价格为 X 1 欧式看涨期权多头与 1 份执行价格为 X 2 的欧式看涨期权空头构成( X 1 < X 2 ),熊市价差期权由 1 份执行价格为 X 2 的 欧式看跌期权多头与 1 份执行价格为 X 1 的看跌期权空头构成,则盒式价差
8.17 运用期权如何构造出具有确定交割价格和交割日期的股票远期合约? 解:假定交割价格为 K,交割日期为 T。远期合约可由买入 1 份欧式看涨期权,
同时卖空 1 份欧式看跌期权,要求两份期权有相同执行价格 K 及到期日 T。 可见,该组合的损益为 ST -K,在任何情形下,其中 ST 为 T 时股票价格。 假定 F 为远期合约价格,若 K=F,则远期合约价值为 0。这表明,当执行价 格为 K 时,看涨期权与看跌期权价格相等。
期权期货和其它衍生产品第三版约翰赫尔答案
第一章1.1请解释远期多头与远期空头的区别。
答:远期多头指交易者协定将来以某一确定价格购入某种资产;远期空头指交易者协定将来以某一确定价格售出某种资产。
1.2请详细解释套期保值、投机与套利的区别。
答:套期保值指交易者采取一定的措施补偿资产的风险暴露;投机不对风险暴露进行补偿,是一种“赌博行为”;套利是采取两种或更多方式锁定利润。
1.3请解释签订购买远期价格为$50的远期合同与持有执行价格为$50的看涨期权的区别。
答:第一种情况下交易者有义务以50$购买某项资产(交易者没有选择),第二种情况下有权利以50$购买某项资产(交易者可以不执行该权利)。
1.4一位投资者出售了一个棉花期货合约,期货价格为每磅50美分,每个合约交易量为50,000磅。
请问期货合约结束时,当合约到期时棉花价格分别为(a)每磅48.20美分;(b)每磅51.30美分时,这位投资者的收益或损失为多少?答:(a)合约到期时棉花价格为每磅$0.4820时,交易者收入:($0.5000-$0.4820)×50,000=$900;(b)合约到期时棉花价格为每磅$0.5130时,交易者损失:($0.5130-$0.5000) ×50,000=$6501.5假设你出售了一个看跌期权,以$120执行价格出售100股IBM的股票,有效期为3个月。
IBM股票的当前价格为$121。
你是怎么考虑的?你的收益或损失如何?答:当股票价格低于$120时,该期权将不被执行。
当股票价格高于$120美元时,该期权买主执行该期权,我将损失100(st-x)。
1.6你认为某种股票的价格将要上升。
现在该股票价格为$29,3个月期的执行价格为$30的看跌期权的价格为$2.90.你有$5,800资金可以投资。
现有两种策略:直接购买股票或投资于期权,请问各自潜在的收益或损失为多少?答:股票价格低于$29时,购买股票和期权都将损失,前者损失为$5,800$29×(29-p),后者损失为$5,800;当股票价格为(29,30),购买股票收益为$5,800$29×(p-29),购买期权损失为$5,800;当股票价格高于$30时,购买股票收益为$5,800$29×(p-29),购买期权收益为$$5,800$29×(p-30)-5,800。
约翰.赫尔_期权期货和其他衍生品第八版部分课后思考题
思考题1.1 远期合约长头寸与短期头寸之间的区别1)长头寸是买入,短头寸是卖出2)长头寸的收益是S-K 短头寸的收益是K-S1.2 期货合约与远期合约的区别1.3 卖出一个看涨期权与买入一个看跌期权的区别1)卖出看涨期权是一种义务,买入看跌期权是一种权利2)期初现金流不同3)收益公式不同卖出看涨期权买入看跌期权靠期权费赚利润1.4 期权与期货/远期合约的区别期货/远期合约,赋予它的持有者一个义务:以某个约定的价格买入或卖出标的资产。
期权合约,赋予它的持有者一个权利:以某个约定的价格买入或卖出标的资产。
1.5对冲、投机和套利之间的区别共同点:都是通过低买高卖或者高卖低买获利,都基于对未来市场预期的判断不同点:投机风险大,看涨看跌均没有保护性套期具有保护性对冲,如果货币市场流动性没问题,风险较低2.1 什么是逐日盯市逐日盯市制度,是指结算部门在每日闭市后计算、检查保证金账户余额,通过适时发出追加保证金通知,使保证金余额维持在一定水平之上,防止负债现象发生的结算制度。
2.2 保证金制度如何可以保证投资者免受违约风险?为了保证投资者保证金账户的资金余额在任何情况下都不为负值,设置了维持保证金,若保证金账户的余额低于维持保证金,投资者就会收到保证金催付,这部分资金称为变动保证金。
如果投资者未提供变动保证金,经纪人将出售该合约来平仓。
2.3一个交易的完成,会对未平仓合约数量产生什么样的影响?若交易是开仓,数量增加,若交易是平仓,则是减少2.4一天内发生的交易数量可以超过交易结束时未平仓合约的数量吗?交易数量包括开仓数量和平仓数量,若开仓=平仓,就会使未平仓数量为02.5设计一个新的期货合约时需要考虑哪几个重要方面?选择期货合约的标的资产、合约规模、交割月份3.1对冲的本质是什么?定义:为了减低另一项投资的风险而进行的投资。
目的:选择期货头寸,从而使得自身整体的投资风险尽量呈中性。
方法:用于对冲的期货交易,与需对冲的资产交易相比,头寸相等,在将来确定的时刻,操作方向相反。
- 1、下载文档前请自行甄别文档内容的完整性,平台不提供额外的编辑、内容补充、找答案等附加服务。
- 2、"仅部分预览"的文档,不可在线预览部分如存在完整性等问题,可反馈申请退款(可完整预览的文档不适用该条件!)。
- 3、如文档侵犯您的权益,请联系客服反馈,我们会尽快为您处理(人工客服工作时间:9:00-18:30)。
CHAPTER 13Wiener P rocesses and It’s LemmaPractice QuestionsProblem .What would it mean to assert that the temperature at a certain place follows a Markov process Do you think that temperatures do, in fact, follow a Markov processImagine that you have to forecast the future temperature from a) the current temperature, b) the history of the temperature in the last week, and c) a knowledge of seasonal averages and seasonal trends. If temperature followed a Markov process, the history of the temperature in the last week would be irrelevant.To answer the second part of the question you might like to consider the following scenario for the first week in May:(i) Monday to Thursday are warm days; today, Friday, is a very cold day. (ii) Monday to Friday are all very cold days.What is your forecast for the weekend If you are more pessimistic in the case of the second scenario, temperatures do not follow a Markov process.Problem .Can a trading rule based on the past history of a stock’s price ever produce returns that are consistently above average Discuss.The first point to make is that any trading strategy can, just because of good luck, produce above average returns. The key question is whether a trading strategy consistently outperforms the market when adjustments are made for risk. It is certainly possible that a trading strategy could do this. However, when enough investors know about the strategy and trade on the basis of the strategy, the profit will disappear.As an illustration of this, consider a phenomenon known as the small firm effect. Portfolios of stocks in small firms appear to have outperformed portfolios of stocks in large firms when appropriate adjustments are made for risk. Research was published about this in the early 1980s and mutual funds were set up to take advantage of the phenomenon. There is some evidence that this has resulted in the phenomenon disappearing.Problem .A company’s cash position, measured in millions of dollars, follows a generalized Wiener process with a drift rate of per quarter and a variance rate of per quarter. How high does the company’s initial cash position have to be for the company to have a less than 5% chance of a negative cash position by the end of one yearSuppose that the company’s i nitial cash position is x . The probability distribution of the cash position at the end of one year is (40544)(2016)x x ϕϕ+⨯.,⨯=+.,where ()m v ϕ, is a normal probability distribution with mean m and variance v . The probability of a negative cash position at the end of one year is204x N +.⎛⎫- ⎪⎝⎭where ()N x is the cumulative probability that a standardized normal variable (with mean zero and standard deviation is less than x . From normal distribution tables200054x N +.⎛⎫-=. ⎪⎝⎭when:20164494x +.-=-.., when 45796x =.. The initial cash position must therefore be $ million.Problem .Variables 1X and 2X follow generalized Wiener processes with drift rates 1μ and2μ and variances 21σ and 22σ. What process does 12X X + follow if:(a) The changes in 1X and 2X in any short interval of time are uncorrelated (b) There is a correlation ρ between the changes in 1X and 2X in any short interval of time(a) Suppose that X 1 and X 2 equal a 1 and a 2 initially. After a time period of length T , X 1 has the probability distribution2111()a T T ϕμσ+,and 2X has a probability distribution2222()a T T ϕμσ+,From the property of sums of independent normally distributed variables, 12X X + has the probability distribution()22112212a T a T T T ϕμμσσ+++,+.,22121212()()a a T T ϕμμσσ⎡⎤+++,+⎣⎦This shows that 12X X + follows a generalized Wiener process with drift rate 12μμ+and variance rate 2212σσ+.(b) In this case the change in the value of 12X X + in a short interval of time t ∆ has the probability distribution:22121212()(2)t t ϕμμσσρσσ⎡⎤+∆,++∆⎣⎦If 1μ, 2μ, 1σ, 2σ and ρ are all constant, arguments similar to those in Section show that the change in a longer period of time T is22121212()(2)T T ϕμμσσρσσ⎡⎤+,++⎣⎦The variable,12X X +, therefore follows a generalized Wiener process with drift rate12μμ+ and variance rate 2212122σσρσσ++.Problem .Consider a variable,S , that follows the process dS dt dz μσ=+For the first three years, 2μ= and 3σ=; for the next three years, 3μ= and 4σ=. If the initial value of the variable is 5, what is the probability distribution of the value of the variable at the end of year sixThe change in S during the first three years has the probability distribution (2393)(627)ϕϕ⨯,⨯=,The change during the next three years has the probability distribution (33163)(948)ϕϕ⨯,⨯=,The change during the six years is the sum of a variable with probability distribution(627)ϕ, and a variable with probability distribution (948)ϕ,. The probability distribution of the change is therefore (692748)ϕ+,+ (1575)ϕ=,Since the initial value of the variable is 5, the probability distribution of the value of the variable at the end of year six is (2075)ϕ,Problem .Suppose that G is a function of a stock price, S and time. Suppose that S σ and G σ are the volatilities of S and G . Show that when the expected return of S increases by S λσ, the growth rate of G increases by G λσ, where λ is a constant.From It ’s lemmaG S GG S Sσσ∂=∂Also the drift of G is222212G G G S S S t S μσ∂∂∂++∂∂∂where μ is the expected return on the stock. When μ increases by S λσ, the drift of G increases byS GS Sλσ∂∂orG G λσThe growth rate of G , therefore, increases by G λσ.Problem .Stock A and stock B both follow geometric Brownian motion. Changes in any short interval of time are uncorrelated with each other. Does the value of a portfolio consisting of one of stock A and one of stock B follow geometric Brownian motion Explain your answer.Define A S , A μ and A σ as the stock price, expected return and volatility for stock A. Define B S , B μ and B σ as the stock price, expected return and volatility for stock B. Define A S ∆ and B S ∆ as the change in A S and B S in time t ∆. Since each of the two stocks follows geometric Brownian motion,A A A A A S S t S μσε∆=∆+B B B B B S S t S μσε∆=∆+where A ε and B ε are independent random samples from a normal distribution.()(A B A A B B A A A B B B S S S S t S S μμσεσε∆+∆=+∆++This cannot be written as()()A B A B A B S S S S t S S μσ∆+∆=+∆++for any constants μ and σ. (Neither the drift term nor the stochastic term correspond.) Hence the value of the portfolio does not follow geometric Brownian motion.Problem .The process for the stock price in equation isS S t S μσε∆=∆+ where μ and σ are constant. Explain carefully the difference between this model and each of the following:S t S S t S t S μσεμσεμσε∆=∆+∆=∆+∆=∆+Why is the model in equation a more appropriate model of stock price behavior than any of these three alternatives In:S S t S μσε∆=∆+ the expected increase in the stock price and the variability of the stock price are constant when both are expressed as a proportion (or as a percentage) of the stock price In:S t μ∆=∆+the expected increase in the stock price and the variability of the stock price are constant in absolute terms. For example, if the expected growth rate is $5 per annum when the stock price is $25, it is also $5 per annum when it is $100. If the standard deviation of weekly stock price movements is $1 when the price is $25, it is also $1 when the price is $100. In:S S t μ∆=∆+the expected increase in the stock price is a constant proportion of the stock price while the variability is constant in absolute terms. In:S t S μσ∆=∆+the expected increase in the stock price is constant in absolute terms while the variability of the proportional stock price change is constant. The model:S S t S μσ∆=∆+ is the most appropriate one since it is most realistic to assume that the expected percentage return and the variability of the percentage return in a short interval are constant.Problem .It has been suggested that the short-term interest rate,r , follows the stochastic process()dr a b r dt rc dz =-+where a , b , and c are positive constants and dz is a Wiener process. Describe the nature of this process.The drift rate is ()a b r -. Thus, when the interest rate is above b the drift rate is negative and, when the interest rate is below b , the drift rate is positive. The interest rate is therefore continually pulled towards the level b . The rate at which it is pulled towardthis level is a . A volatility equal to c is superimposed upon the “pull” or the drift.Suppose 04a =., 01b =. and 015c =. and the current interest rate is 20% per annum. The interest rate is pulled towards the level of 10% per annum. This can be regarded as a long run average. The current drift is 4-% per annum so that the expected rate at the end of one year is about 16% per annum. (In fact it is slightly greater than this, because as the interest rate decreases, the “pull” decreases.) Superimposed upon the drift is a volatility of 15% per annum.Problem .Suppose that a stock price, S , follows geometric Brownian motion with expected return μ and volatility σ: dS S dt S dz μσ=+What is the process followed by the variable n S Show that n S also follows geometric Brownian motion.If ()n G S t S ,= then 0G t ∂/∂=, 1n G S nS -∂/∂=, and 222(1)n G S n n S -∂/∂=-. Using It’s lemma:21[(1)]2dG nG n n G dt nG dz μσσ=+-+This shows that n G S = follows geometric Brownian motion where the expected return is21(1)2n n n μσ+-and the volatility is n σ. The stock price S has an expected return of μ and the expected value of T S is 0T S e μ. The expected value of n T S is212[(1)]0n n n T n S eμσ+-Problem .Suppose that x is the yield to maturity with continuous compounding on a zero-coupon bond that pays off $1 at time T . Assume that x follows the process0()dx a x x dt sx dz =-+where a , 0x , and s are positive constants and dz is a Wiener process. What is the process followed by the bond priceThe process followed by B , the bond price, is from It’s lemma:222021()2B B B B dB a x x s x dt sxdz x t x x ⎡⎤⎢⎥⎢⎥⎢⎥⎣⎦∂∂∂∂=-+++∂∂∂∂Since:()x T t B e --=the required partial derivatives are()()22()22()()()()x T t x T t x T t Bxe xB t BT t e T t B x BT t e T t B x------∂==∂∂=--=--∂∂=-=-∂ Hence:22201()()()()2dB a x x T t x s x T t Bdt sx T t Bdz⎡⎤⎢⎥⎢⎥⎢⎥⎣⎦=---++---Problem (Excel Spreadsheet)A stock whose price is $30 has an expected return of 9% and a volatility of 20%. In Excel simulate the stock price path over 5 years using monthly time steps and random samples from a normal distribution. Chart the simulated stock price path. By hitting F9 observe how the path changes as the random sample change.The process ist S t S S ∆⨯ε⨯⨯+∆⨯⨯=∆20.009.0Where t is the length of the time step (=1/12) and is a random sample from a standard normal distribution.Further QuestionsProblem .Suppose that a stock price has an expected return of 16% per annum and a volatility of 30% per annum. When the stock price at the end of a certain day is $50, calculate the following:(a) The expected stock price at the end of the next day.(b) The standard deviation of the stock price at the end of the next day. (c) The 95% confidence limits for the stock price at the end of the next day. (d)(e) With the notation in the text2()St t S ϕμσ∆∆,∆:In this case 50S =, 016μ=., 030σ=. and 1365000274t ∆=/=.. Hence(016000274009000274)50(0000440000247)Sϕϕ∆.⨯.,.⨯.=.,.:and2(50000044500000247)S ϕ∆⨯.,⨯.:that is,(002206164)S ϕ∆.,.:(a) The expected stock price at the end of the next day is therefore(b) The standard deviation of the stock price at the end of the next day is 0785=. (c) 95% confidence limits for the stock price at the end of the next day are 500221960785and 500221960785.-.⨯..+.⨯. ., 4848and 5156..Note that some students may consider one trading day rather than one calendar day. Then 1252000397t ∆=/=.. The answer to (a) is then . The answer to (b) is . The answers to part (c) are and .Problem .A company’s cash position, measured in millions of dollars, follows a generalized Wiener process with a drift rate of per month and a variance rate of per month. The initial cash position is .(a) What are the probability distributions of the cash position after one month, six months, and one year(b) What are the probabilities of a negative cash position at the end of six months and one year(c) At what time in the future is the probability of a negative cash position greatest(a) The probability distributions are:(2001016)(21016)ϕϕ.+.,.=.,.(20060166)(26096)ϕϕ.+.,.⨯=.,.(201201612)(32196)ϕϕ.+.,.⨯=.,.(b) The chance of a random sample from (26096)ϕ.,. being negative is(265)N N ⎛=-. ⎝where ()N x is the cumulative probability that a standardized normal variable [., avariable with probability distribution (01)ϕ,] is less than x . From normaldistribution tables (265)00040N -.=.. Hence the probability of a negative cash position at the end of six months is %.Similarly the probability of a negative cash position at the end of one year is(230)00107N N ⎛=-.=. ⎝or %.(c)In general the probability distribution of the cash position at the end of x monthsis(2001016)x xϕ.+.,.The probability of the cash position being negative is maximized when:is minimized. Define11223122325025250125(250125)y x xdy x xdxx x----==+.=-.+.=-.+.This is zero when 20x=and it is easy to verify that 220d y dx/>for this value of x. It therefore gives a minimum value for y. Hence the probability of a negative cash position is greatest after 20 months.Problem .Suppose that x is the yield on a perpetual government bond that pays interest at the rate of $1 per annum. Assume that x is expressed with continuous compounding, that interest is paid continuously on the bond, and that x follows the process()dx a x x dt sx dz=-+where a,x, and s are positive constants and dz is a Wiener process. What is the process followed by the bond price What is the expected instantaneous return (including interest and capital gains) to the holder of the bondThe process followed by B, the bond price, is f rom It’s lemma:222021()2B B B BdB a x x s x dt sxdzx t x x⎡⎤⎢⎥⎢⎥⎢⎥⎣⎦∂∂∂∂=-+++∂∂∂∂In this case1Bx=so that:222312B B Bt x x x x∂∂∂=;=-;=∂∂∂Hence2202322021121()21()dB a x x s x dt sxdzx x x s sa x x dt dzx x x ⎡⎤=--+-⎢⎥⎣⎦⎡⎤=--+-⎢⎥⎣⎦The expected instantaneous rate at which capital gains are earned from the bond is therefore:2021()s a x x x x--+ The expected interest per unit time is 1. The total expected instantaneous return is therefore:20211()s a x x x x --+When expressed as a proportion of the bond price this is:202111()s a x x x x x ⎛⎫⎛⎫--+ ⎪ ⎪⎝⎭⎝⎭20()ax x x s x=--+Problem .If S follows the geometric Brownian motion process in equation , what is theprocess followed by (a) y = 2S, (b) y=S 2 , (c) y=e S , and (d) y=e r(T-t)/S. In each case express the coefficients of dt and dz in terms of y rather than S.(a) In this case 2y S ∂/∂=, 220y S ∂/∂=, and 0y t ∂/∂= so that It’s lemma gives 22dy S dt S dz μσ=+or dy y dt y dz μσ=+(b) In this case 2y S S ∂/∂=, 222y S ∂/∂=, and 0y t ∂/∂= so that It’s lemma gives2222(2)2dy S S dt S dz μσσ=++ or2(2)2dy y dt y dz μσσ=++ (c) In this case S y S e ∂/∂=, 22S y S e ∂/∂=, and 0y t ∂/∂= so that It’s lemma gives22(2)S S S dy Se S e dt Se dz μσσ=+/+or22[ln (ln )2]ln dy y y y y dt y y dz μσσ=+/+(d) In this case ()2r T t y S e S y S -∂/∂=-/=-/, 22()3222r T t y S e S y S -∂/∂=/=/, and()r T t y t re S ry -∂/∂=-/=- so that It’s lemma gives2()dy ry y y dt y dz μσσ=--+-or2()dy r y dt y dz μσσ=-+--Problem .A stock price is currently 50. Its expected return and volatility are 12% and 30%, respectively. What is the probability that the stock price will be greater than 80 in two years (Hint 80T S > when ln ln 80T S >.)The variable ln T S is normally distributed with mean 20ln (2)S T μσ+-/ and standarddeviation 050S =, 012μ=., 2T =, and 030σ=. so that the meanand standard deviation of ln T S are 2ln 50(012032)24062+.-./=. and 00424.=., respectively. Also, ln804382=.. The probability that 80T S > is the same as the probability that ln 4382T S >.. This is4382406211(0754)0424N N .-.⎛⎫-=-. ⎪.⎝⎭where ()N x is the probability that a normally distributed variable with mean zero and standard deviation 1 is less than x . From the tables at the back of the book(0754)0775N .=. so that the required probability is .Problem (See Excel Worksheet)Stock A, whose price is $30, has an expected return of 11% and a volatility of 25%. Stock B, whose price is $40, has an expected return of 15% and a volatility of 30%. The processes driving the returns are correlated with correlation parameter . In Excel, simulate the two stock price paths over three months using daily time steps and random samples from normal distributions. Chart the results and by hitting F9 observe how the paths change as the random samples change. Consider values of equal to , , and .The processes aret S t S S A A A A ∆⨯ε⨯⨯+∆⨯⨯=∆25.011.0 t S t S S B B B B ∆⨯ε⨯⨯+∆⨯⨯=∆30.015.0Where t is the length of the time step (=1/252) and the ’s are correlated samples from standard normal distributions.。