管理会计(双语)作业答案(第6章)
管理会计答案
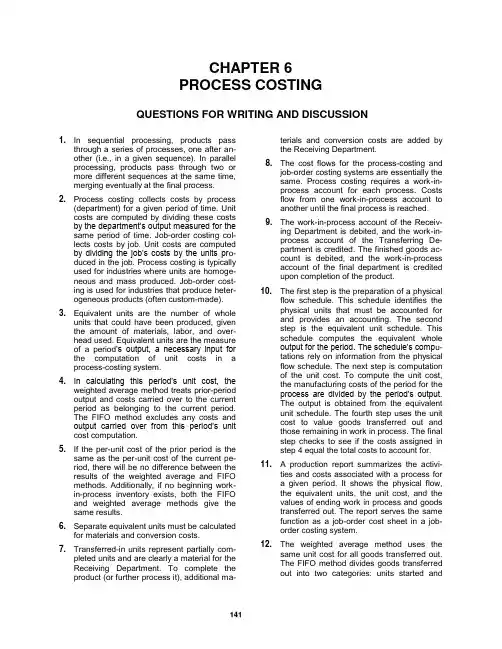
CHAPTER 6PROCESS COSTINGQUESTIONS FOR WRITING AND DISCUSSION1.In sequential processing, products passthrough a series of processes, one after another (i.e., in a given sequence). In paral-lel processing, products pass through two or more different sequences at the same time, merging eventually at the final process.2.Process costing collects costs by process(department) for a given period of time. Unit costs are computed by dividing these costs by the department’s output measured for the same period of time. Job-order costing col-lects costs by job. Unit costs are computed by dividing the job’s costs by the units pr o-duced in the job. Process costing is typically used for industries where units are homoge-neous and mass produced. Job-order cost-ing is used for industries that produce hete-rogeneous products (often custom-made). 3.Equivalent units are the number of wholeunits that could have been produced, given the amount of materials, labor, and over-head used. Equivalent units are the measure of a period’s output, a necessary input for the computation of unit costs in a process-costing system.4.In calculating this period’s unit cost, theweighted average method treats prior-period output and costs carried over to the current period as belonging to the current period.The FIFO method excludes any costs and output carried over from this period’s unit cost computation.5.If the per-unit cost of the prior period is thesame as the per-unit cost of the current pe-riod, there will be no difference between the results of the weighted average and FIFO methods. Additionally, if no beginning work-in-process inventory exists, both the FIFO and weighted average methods give the same results.6.Separate equivalent units must be calculatedfor materials and conversion costs.7.Transferred-in units represent partially com-pleted units and are clearly a material for the Receiving Department. To complete the product (or further process it), additional ma-terials and conversion costs are added bythe Receiving Department.8.The cost flows for the process-costing andjob-order costing systems are essentially thesame. Process costing requires a work-in-process account for each process. Costsflow from one work-in-process account toanother until the final process is reached.9.The work-in-process account of the Receiv-ing Department is debited, and the work-in-process account of the Transferring De-partment is credited. The finished goods ac-count is debited, and the work-in-processaccount of the final department is creditedupon completion of the product.10.The first step is the preparation of a physicalflow schedule. This schedule identifies thephysical units that must be accounted forand provides an accounting. The secondstep is the equivalent unit schedule. Thisschedule computes the equivalent wholeoutput for the period. The schedule’s comp u-tations rely on information from the physicalflow schedule. The next step is computationof the unit cost. To compute the unit cost,the manufacturing costs of the period for theprocess are divided by the period’s output.The output is obtained from the equivalentunit schedule. The fourth step uses the unitcost to value goods transferred out andthose remaining in work in process. The finalstep checks to see if the costs assigned instep 4 equal the total costs to account for. 11. A production report summarizes the activi-ties and costs associated with a process fora given period. It shows the physical flow,the equivalent units, the unit cost, and thevalues of ending work in process and goodstransferred out. The report serves the samefunction as a job-order cost sheet in a job-order costing system.12.The weighted average method uses thesame unit cost for all goods transferred out.The FIFO method divides goods transferredout into two categories: units started andcompleted and units from beginning work inprocess. The period’s unit cost is used tovalue goods started and completed. Thecost of goods transferred out from beginningwork in process is obtained by (1) assigningthem all costs carried over from the prior pe-riod and (2) using the current period’s unitcost to value the equivalent units completedthis period.13.Automation simply reduces computationsand paperwork. It also usually means moreaccurate and rapid calculations. 14.Firms adopting JIT reduce inventories toinsignificant levels. As a result, work-in-process inventories are close to zero, andequivalent units of production need not becalculated. In essence, unit cost is total costfor the period divided by output.15.Service firms generally do not have work-in-process inventories, and so equivalent unitsof production are not needed. An importantfactor in process costing for services is de-termining just what constitutes a unit of out-put.EXERCISES6–11. b2. c3. c4. e5. d6–21. C utting Sewing PackagingDepartment Department Direct materials $5,400 $ 900 $ 225 Direct labor 150 1,800 900 Applied overhead 750 3,600 900 Transferred-in cost:From cutting 6,300From sewing 12,600 Total manufacturing cost $6,300 $12,600 $14,625 2. a. Work in Process—Sewing ................. 6,300Work in Process—Cutting ........... 6,300b. Work in Process—Packaging ............ 12,600Work in Process—Sewing .......... 12,600c. Finished Goods ................................... 14,625Work in Process—Packaging ..... 14,6253. Unit cost = $14,625/600 = $24.38* per pair*Rounded1. Equivalent units of production:Ending work in process = 1,200 ⨯ 0.30 = 360Total equivalent units = 360 + 2,000 = 2,3602. Unit cost = $6,608/2,360 = $2.803. Cost of goods transferred out = $2.80 ⨯ 2,000 = $5,600Cost of ending work-in-process inventory = $2.80 ⨯ 360 = $1,0086–41. Units transferred out: 27,000 + 33,000 – 16,200 = 43,8002. Units started and completed: 43,800 – 27,000 = 16,8003. Physical flow schedule:Units in beginning work in process 27,000Units started during the period 33,000 Total units to account for 60,000 Units started and completed 16,800Units completed from beginning work in process 27,000Units in ending work in process 16,200 Total units accounted for 60,0004. Equivalent units of production:Conversion Units completed 43,800 43,800 Add: Units in ending work in process:(16,200 ⨯ 100%) 16,200(16,200 ⨯ 25%) 4,050 Equivalent units of output 60,000 47,8501. Cost of ending work in process:Materials ($1.30 ⨯ 0) $ 0Conversion ($0.50 ⨯ 12,000) 6,000Total cost $ 6,000Cost of goods transferred out: $1.80 ⨯ 30,000 = $54,0002. Physical flow schedule:Units to account for: Units accounted for:Units in beginning WIP ? Units completed 30,000 Units started ? Units in ending WIP 20,000 Total units 50,000 Total units 50,000 The schedule of equivalent units using the weighted average method does not give sufficient information to reconstruct the complete physical flow schedule. Units in beginning work in process are embedded in units com-pleted.1. Department 1:a. Units transferred to Department 2 = Total units* – Ending WIP= 6,480 – 3,600= 2,880*Total units = Beginning WIP + Units started = 0 + 6,480 = 6,480b. Materials ConversionUnits completed 2,880 2,880Add: Units in ending work in process:3,600 ⨯ 100% 3,6003,600 ⨯ 50% 1,800 Equivalent units of output 6,480 4,6802. Department 2:a. Units transferred out = Total units* – Ending WIP = 4,080 – 600 = 3,480*Total units = Beginning WIP + Units transferred in = 1,200 + 2,880 = 4,080b. Materials ConversionUnits completed 3,480 3,480Add: Units in ending work in process:600 ⨯ 0% 0600 ⨯ 40% 240 Equivalent units of output 3,480 3,7201. Physical flow schedule:Units to account for:Units in beginning work in process 80,000 Units started during the period 160,000 Total units to account for 240,000 Units accounted for:Units completed and transferred out:Started and completed 120,000From beginning work in process 80,000 200,000 Units in ending work in process 40,000 Total units accounted for 240,000 2. Units completed 200,000Add: Units in ending WIP ⨯ Fraction complete(40,000 ⨯ 20%) 8,000 Equivalent units of output 208,000 3. Unit cost = ($374,400 + $1,258,400)/208,000 = $7.854. Cost transferred out = 200,000 ⨯ $7.85 = $1,570,000Cost of ending WIP = 8,000 ⨯ $7.85 = $62,8005. Costs to account for:Beginning work in process $ 374,400Incurred during June 1,258,400Total costs to account for $ 1,632,800Costs accounted for:Goods transferred out $ 1,570,000Goods in ending work in process 62,800Total costs accounted for $ 1,632,800Mixing DepartmentProduction ReportFor the Month of June 20XX(Weighted Average Method)Unit InformationPhysical flow:Units to account for: Units accounted for:Units in beginning WIP 80,000 Units completed 200,000 Units started 160,000 Units in ending WIP 40,000 Total units to account for 240,000 Total units accounted for 240,000 Equivalent units:Units completed 200,000Units in ending work in process 8,000Total equivalent units 208,000Cost InformationCosts to account for:Beginning work in process $ 374,400Incurred during June 1,258,400Total costs to account for $ 1,632,800Cost per equivalent unit $ 7.85Costs accounted for:Transferred EndingOut Work in Process Total Goods transferred out($7.85 ⨯ 200,000) $ 1,570,000 —$ 1,570,000 Goods in ending WIP($7.85 ⨯ 8,000) —$62,800 62,800 Total costs accounted for $ 1,570,000 $62,800 $ 1,632,800Gilroy, Inc.Department 1Production Report(Weighted Average Method)Unit InformationPhysical flow:Units to account for: Units accounted for:Units in beginning WIP 0 Units completed 33,500 Units started 43,000 Units in ending WIP 9,500 Total units to account for 43,000 Total units accounted for 43,000 Equivalent Units:Materials ConversionUnits completed 33,500 33,500Units in ending WIP 9,500 7,600*Total equivalent units 43,000 41,100*9,500 ⨯ 80% = 7,600Cost InformationCosts to account for:Materials Conversion Total Beginning WIP $ 0 $ 0 $ 0 Incurred during period 16,340 90,420 106,760 Total costs to account for $ 16,340 $ 90,420 $ 106,760 Cost per equivalent unit $ 0.38 $ 2.20 $ 2.58 Costs accounted for:Goods transferred out (33,500 ⨯ $2.58) $ 86,430 Ending WIP (9,500 ⨯ $0.38) + (7,600 ⨯ $2.20) 20,330 Total costs accounted for $ 106,7601. Units to account for: Units accounted for:Units in beginning WIP 0 Started and completed 87,500 Units started 92,500 Units in ending WIP 5,000 Total units 92,500 Total units 92,500 2. a. and b. Materials ConversionUnits completed 87,500 87,500Units in ending WIP:(5,000 ⨯ 100%) 5,000(5,000 ⨯ 60%) 3,000Equivalent units 92,500 90,5003. a. Unit materials cost: $277,500/92,500 = $ 3.00b. Unit conversion cost: ($50,680 + $76,020)/90,500 = 1.40c. Total unit cost $ 4.404. Cost of units transferred out87,500 ⨯ $4.40 $ 385,000Cost of ending WIP(5,000 ⨯ $3.00) + (3,000 ⨯ $1.40) 19,200Total costs accounted for $ 404,2006–11A B C D Completed 16,200a24,000c31,000d60,000f Ending WIP 1,000b0 900e2,500g Equivalent units 17,200 24,000 31,900 62,500a(3,200 + 17,000 – 4,000) e(9,000 ⨯ 0.10)b(4,000 ⨯ 0.25) f(30,000 + 40,000 – 10,000)c(1,000 + 23,000 – 0) g(10,000 ⨯ 0.25)d(40,000 – 9,000)6–12A B C D Completed* 16,200 24,000 31,000 60,000 Add: Ending WIP* 1,000 0 900 2,500 Less: Beginning WIP** 960 400 0 22,500 Equivalent units 16,240 23,600 31,900 40,000*See solution to Exercise 6–11.**Beginning WIP for A: 3,200 ⨯ 0.30 = 960Beginning WIP for B: 1,000 ⨯ 0.40 = 400Beginning WIP for C: 0 ⨯ 0 = 0Beginning WIP for D: 30,000 ⨯ 0.75 = 22,5006–131. Physical flow schedule:Units to account for:Units in beginning work in process 10,000Units started during the period 70,000Total units to account for 80,000Units accounted for:Units completed and transferred out:Started and completed 50,000From beginning work in process 10,000 60,000Units in ending work in process (60% complete) 20,000Total units accounted for 80,0006–13 Concluded2. ConversionUnits completed 60,000 60,000 Add: Units in ending WIP ⨯Fraction complete (20,000 ⨯ 100%;20,000 ⨯ 60%) 20,000 12,000 Equivalent units of output 80,000 72,000 3. Unit materials cost ($49,000 + $351,000)/80,000 = $5.00Unit conversion cost ($2,625 + $78,735)/72,000 = 1.13Total unit cost $6.134. Cost transferred out: 60,000 ⨯ $6.13 = $367,800Cost of ending WIP:Materials: 20,000 ⨯ $5.00 = $100,000Conversion: 12,000 ⨯ $1.13 = 13,560Total ending WIP cost $113,5605. Costs to account for:Beginning WIP $ 51,625Incurred during August 429,735Total costs to account for $ 481,360Costs accounted for:Goods transferred out $ 367,800Goods in ending WIP 113,560Total costs accounted for $ 481,360Bath Linens DepartmentProduction ReportFor the Month of August 20XX(Weighted Average Method)Unit InformationPhysical flow:Units to account for: Units accounted for:Units in beginning WIP 10,000 Units completed 60,000 Units started 70,000 Units in ending WIP 20,000 Total units to account for 80,000 Total units accounted for 80,000 Equivalent units:Materials Conversion Units completed 60,000 60,000Units in ending work in process 20,000 12,000 Total equivalent units 80,000 72,000Cost InformationCosts to account for:Materials Conversion Total Beginning WIP $ 49,000 $ 2,625 $ 51,625 Incurred during August 351,000 78,735 429,735 Total costs to account for $ 400,000 $ 81,360 $ 481,360 Cost per equivalent unit $ 5.00 $ 1.13 $ 6.13 Costs accounted for:Transferred EndingOut Work in Process Total Goods transferred out($6.13 ⨯ 60,000) $367,800 —$367,800 Goods in ending WIP:Materials ($5 ⨯ 20,000) —$100,000 100,000 Conversion costs($1.13 ⨯ 12,000) —13,560 13,560 Total costs accounted for $367,800 $113,560 $481,3601. Units transferred out 120,000Units in ending WIP 30,000Less: Units in beginning WIP (40,000)Units transferred in 110,0002. Materials ConversionUnits transferred out 120,000 120,000 120,000 Units in ending WIP 30,000 30,000 18,000* Equivalent units 150,000 150,000 138,000 *(30,000 60%)3. Unit transferred-in cost: ($2,100 + $30,900)/150,000 = $0.22Unit materials cost: ($1,500 + $22,500)/150,000 = $0.16Unit conversion cost: ($3,000 + $45,300)/138,000 = $0.35Total unit cost: $0.22 + $0.16 + $0.35 = $0.736–161. Physical flow schedule:Units to account for:Units in beginning work in process (75% complete) 180,000Units started during August 360,000 Total units to account for 540,000 Units accounted for:Units completed and transferred out:Started and completed 270,000From beginning work in process 180,000 450,000 Units in ending work in process (25% complete) 90,000 Total units accounted for 540,0006–16 Concluded2. Units started and completed 270,000Add: Units to complete beginning WIP (180,000 ⨯ 25%) 45,000 Add: Units ending WIP ⨯ Fraction completed (90,000 ⨯ 25%) 22,500 Equivalent units of output 337,500 3. FIFO unit cost = $1,501,875/337,500 = $4.454. Costs transferred out:Costs from beginning WIP $ 580,500Costs to complete beginning WIP (45,000 ⨯ $4.45) 200,250Started and completed (270,000 ⨯ $4.45) 1,201,500 Total costs transferred out $ 1,982,250 Cost of ending WIP = 22,500 ⨯ $4.45 = $100,1255. Costs to account for: Costs accounted for:Beginning WIP $ 580,500 Transferred out $ 1,982,250 Added in August 1,501,875 Ending WIP 100,125 Total $ 2,082,375 Total $ 2,082,375Nogaleen CompanyBlending DepartmentProduction ReportFor the Month of August 20XX(FIFO Method)Unit InformationPhysical flow:Units to account for:Units in beginning work in process 180,000Units started during August 360,000Total units to account for 540,000Units accounted for: Physical Flow Equivalent Units Units started and completed 270,000 270,000Units completed from beginningwork in process 180,000 45,000 Units in ending work in process 90,000 22,500 Total units accounted for 540,000 337,500Cost InformationCosts to account for:Beginning work in process $ 580,500Incurred during August 1,501,875Total costs to account for $2,082,375Cost per equivalent unit $ 4.45Costs accounted for:Transferred EndingOut Work in Process Total Units in beginning workin process:From prior period $ 580,500 —$ 580,500 From current period(45,000 ⨯ $4.45) 200,250 —200,250 Units started and completed(270,000 ⨯ $4.45) 1,201,500 —1,201,500 Goods in ending workin process (22,500 ⨯ $4.45) —$100,125 100,125 Total costs accounted for $ 1,982,250 $100,125 $2,082,3751. Unit cost = Unit material cost + Unit conversion cost= [($30,000 + $25,000)/11,000] + [($5,000 + $65,000)/8,000]= $5.00 + $8.75= $13.75 per equivalent unit2. C ost of ending work in process:Materials: $5.00 ⨯ 6,000 $30,000Conversion: $8.75 ⨯ 3,000 26,250Total cost $56,250Cost of goods transferred out = $13.75 ⨯ 5,000 = $68,7506–191. Physical flow schedule:Units to account for:Units in beginning WIP 2,000Units started 12,000Total units to account for 14,000Units accounted for:Units completed:Started and completed 8,000Units in beginning WIP 2,000Units in ending WIP 4,000Total units accounted for 14,0006–19 Concluded2. Unit cost = Unit material cost + Unit conversion cost= $72,000/12,000 + $96,000/10,000= $6.00 + $9.60= $15.60 per equivalent unit3. Cost of ending work in process:Materials: 4,000 ⨯ $6.00 $ 24,000Conversion: 1,000 ⨯ $9.60 9,600 Total cost $ 33,600 Cost of goods transferred out:Units started and completed (8,000 ⨯ $15.60) $124,800Units in beginning work in process:Prior period costs 30,000Current cost to finish units (1,000 ⨯ $9.60) 9,600 Total cost $164,4006–201. Physical flow schedule:Units to account for: Units accounted for:Units in beginning WIP 6,000 Transferred out 18,000 Units started 14,000* Units in ending WIP 2,000 Total 20,000 Total 20,000 *20,000 – 6,000 = 14,0002. Equivalent UnitsConversion Transferred out 18,000 18,000Ending WIP 2,000 500 (2,000 ⨯ 25%) T otal 20,000 18,5003. Unit materials cost: ($1,800 + $3,800)/20,000 = $0.28Unit conversion cost: ($552 + $8,698)/18,500 = 0.50Total unit cost $0.784. Cost transferred out:18,000 ⨯ $0.78 = $14,040Cost of ending WIP:(2,000 ⨯ $0.28) + (500 ⨯ $0.50) = $810Cost reconciliation:Costs to account for: Costs accounted for:BWIP ($1,800 + $552) $ 2,352 Transferred out $14,040 April ($3,800 + $8,698) 12,498 EWIP 810 Total $ 14,850 Total $14,850PROBLEMS6–211. b2. d3. b4. b5. a6. c7. c8. eSupporting computations:Conversion Units completed 92,000 92,000Units in ending WIP(24,000 ⨯ 90%) 21,600(24,000 ⨯ 40%) 9,600 Equivalent units (WA) 113,600 101,600Less EU in BWIP(16,000 ⨯ 60%) (9,600)(16,000 ⨯ 20%) (3,200) Equivalent units (FIFO) 104,000 98,400Unit cost:FIFO: $468,000/104,000 $573,040/98,400$4.50 $5.82 WA: ($468,000 + $54,560)/113,600 ($573,040 + $35,560)/101,600$4.60 $5.99 EWIP:FIFO: ($4.50 ⨯ 21,600) + ($5.82 ⨯ 9,600) = $153,072WA: ($4.60 ⨯ 21,600) + ($5.99 ⨯ 9,600) = $156,864Lister CompanyAssembly DepartmentProduction ReportFor the Month of February 20XX(Weighted Average Method)Unit InformationUnits to account for: Units accounted for: Units in beginning WIP 24,000 Units completed 69,200 Units started 56,000 Units in ending WIP 10,800 Total units 80,000 Total units 80,000Equivalent units:Units completed 69,200Units in ending WIP (10,800 ⨯ 70%) 7,560Total equivalent units 76,760Cost InformationCosts to account for:Costs in beginning WIP $142,760Costs added by department 333,152Total costs to account for $475,912Cost per equivalent unit ($475,912/76,760) $ 6.20Costs accounted for:Goods transferred out (69,200 ⨯ $6.20) $429,040Ending work in process (7,560 ⨯ $6.20) 46,872Total costs accounted for $475,912Lister CompanyAssembly DepartmentProduction ReportFor the Month of February 20XX(FIFO Method)Unit InformationUnits to account for: Units accounted for:Started and completed 45,200 Units in beginning WIP 24,000 From beginning WIP 24,000 Units started 56,000 From ending WIP 10,800 Total units 80,000 Total units 80,000 Equivalent units:Started and completed 45,200To complete beginning WIP (24,000 ⨯ 40%) 9,600Units in ending WIP (10,800 ⨯ 70%) 7,560 Total equivalent units 62,360Cost InformationCosts to account for:Costs in beginning WIP $ 142,760Costs added by department 333,152 Total costs to account for $ 475,912Cost per equivalent unit ($333,152/62,360) $ 5.3424Costs accounted for:Transferred out:Units started and completed (45,200 ⨯ $5.3424) $ 241,476Units in beginning work in process:From prior period 142,760From current period (9,600 ⨯ $5.3424) 51,287 Total cost transferred out $ 435,523Goods in ending work in process (7,560 ⨯ $5.3424) 40,389Total costs accounted for $ 475,9121. a. Physical flow schedule:Units to account for: Units accounted for:Started and completed 480,000 Units in BWIP 20,000 From BWIP 20,000Units started 510,000 From EWIP 30,000 Total units 530,000 Total units 530,000b. Equivalent unit schedule:Paraffin Pigment Conversion Units completed 500,000 500,000 500,000 Units in ending WIP 30,000 30,000 21,000* Total equivalent units 530,000 530,000 521,000 *(30,000 ⨯ 70%)2. Unit cost computation:Paraffin Pigment Conversion Total Costs in BWIP $ 120,000 $ 100,000 $ 40,000 $ 260,000 Costs added 3,060,000 2,550,000 5,170,000 10,780,000 Total costs $3,180,000 $2,650,000 $5,210,000 $11,040,000 Unit cost = Unit paraffin cost + Unit pigment cost + Unit conversion cost = ($3,180,000/530,000) + ($2,650,000/530,000) +($5,210,000/521,000)= $6 + $5 + $10 = $213. Ending work in process= (30,000 ⨯ $6) + (30,000 ⨯ $5) + (21,000 ⨯ $10)= $180,000 + $150,000 + $210,000= $540,000Cost of goods transferred out: 500,000 ⨯ $21 = $10,500,0004. Cost reconciliation:Costs to account for: Costs accounted for:Beginning WIP $ 260,000 Transferred out $10,500,000 August costs 10,780,000 Ending WIP 540,000 Total to account for $11,040,000 Total accounted for $11,040,000Keating CompanyDepartment CProduction ReportFor the Month of January 20XX(Weighted Average Method)Unit InformationUnits to account for:Units in beginning WIP 4,000Units started 20,000Total units to account for 24,000Equivalent UnitsUnits accounted for: Physical Flow Transferred Materials Conversion Units completed 21,000 21,000 21,000 21,000 Units in ending WIP 3,000 3,000 —1,000 Total units accounted for 24,000 24,000 21,000 22,000Cost InformationTransferredCosts to account for: In Materials Conversion Total Beginning WIP $14,970 $ 0 $11,760 $ 26,730 Incurred during January 70,350 40,635 87,900 198,885 Total costs to account for $85,320 $40,635 $99,660 $225,615 ÷ Equivalent units 24,000 21,000 22,000Cost per equivalent unit $ 3.555 $ 1.935 $ 4.530 $ 10.02 Costs accounted for: Transferred Out EWIP Total Goods transferred out(21,000 ⨯ $10.02) $210,420 —$210,420 Ending work in process:Transferred in (3,000 ⨯ $3.555) —$10,665 10,665 Conversion (1,000 ⨯ $4.53) —4,530 4,530 Total costs accounted for $210,420 $15,195 $225,615Grace Sauces, Inc.Mixing DepartmentProduction ReportFor the First Quarter 20XX(FIFO Method)Unit InformationUnits to account for: Units accounted for:Units in beginning WIP 36,000 Units transferred out 184,500 Units started 180,000 Units in ending WIP 31,500 Units to account for 216,000 Units accounted for 216,000Equivalent UnitsTransferred In Materials ConversionUnits started and completed 148,500 148,500 148,500Units in BWIP (to complete) ——9,000Units in EWIP 31,500 31,500 6,300 Total units accounted for 180,000 180,000 163,800Cost InformationCosts to account for: Transferred In Materials Conversion Total Beginning WIP $ 45,600 $ 6,432 $ 14,400 $ 66,432 Incurred during quarter 230,400 33,500 72,640 336,540 Total costs to account for $276,000 $39,932 $ 87,040 $402,972 Equivalent units 180,000 180,000 163,800Cost incurred during quarter÷ Equivalent units $ 1.28 $ 0.186 $ 0.443 $ 1.909 Costs accounted for: Transferred Out EWIP Total Started/complete (148,500 ⨯ $1.909) $283,487 —$283,487 Units in beginning WIP:From prior period 66,432 —66,432 Current period (9,000 ⨯ $0.443) 3,987 —3,987 Units in ending WIP:Transferred in (31,500 ⨯ $1.28) —$40,320 40,320 Materials (31,500 ⨯ $0.186) —5,859 5,859 Conversion (6,300 ⨯ $0.443) —2,791 2,791 Total costs accounted for $353,906 $48,970 $402,876* *Difference due to rounding.Grace Sauces, Inc.Mixing DepartmentProduction ReportFor the First Quarter 20XX(Weighted Average Method)Unit InformationUnits to account for: Units accounted for:Units in beginning WIP 36,000 Units transferred out 184,500 Units started 180,000 Units in ending WIP 31,500 Units to account for 216,000 Units accounted for 216,000Equivalent UnitsTransferred In Materials ConversionUnits completed 184,500 184,500 184,500Units in ending WIP 31,500 31,500 6,300 Total units accounted for 216,000 216,000 190,800Cost InformationCosts to account for: Transferred In Materials Conversion Total Beginning WIP $ 45,600 $ 6,432 $ 14,400 $ 66,432 Incurred during quarter 230,400 33,500 72,640 336,540 Total costs to account for $ 276,000 $ 39,932 $ 86,040 $402,972 ÷ Equivalent units 216,000 216,000 190,800Cost per equivalent unit $ 1.278 $ 0.185 $ 0.456 $ 1.919 Costs accounted for: Transferred Out EWIP Total Goods transferred out(184,500 ⨯ $1.919) $354,056 —$354,056 Ending work in process:Transferred in (31,500 ⨯ $1.278) —$40,257 40,257 Materials (31,500 ⨯ $0.185) —5,828 5,828 Conversion (6,300 ⨯ $0.456) —2,873 2,873 Total costs accounted for $354,056 $48,958 $403,014* *Difference due to rounding.1. Department Aa. Physical flow schedule:Units in beginning WIP 5,000Units started in November 25,000Total units to account for 30,000Units completed and transferred out:Started and completed 23,000From beginning WIP 5,000Units in ending WIP 2,000Total units accounted for 30,000Costs charged to the department:Materials Conversion Total Beginning WIP $10,000 $ 6,900 $ 16,900 Incurred during November 57,800 95,220 153,020 Total costs $67,800 $102,120 $169,920b. Equivalent unit calculation:Materials Conversion Units completed 28,000 28,000 Add: Equivalent units in ending WIP 2,000 1,600 Total equivalent units 30,000 29,600c. Unit cost calculation:Unit cost = Unit material cost + Unit conversion cost= $67,800/30,000 + $102,120/29,600= $2.26 + $3.45= $5.71d. ande. Cost reconciliation:Total costs accounted for:Goods transferred out (28,000 ⨯ $5.71) .................. $ 159,880 Costs in ending WIP:Materials (2,000 ⨯ $2.26) ..................................... $4,520Conversion (1,600 ⨯ $3.45) ................................. 5,520 10,040 Total costs accounted for ............................. $ 169,920 Costs to account for:Beginning work in process ................................ $ 16,900Costs incurred during November ...................... 153,020 Total costs to account for ............................. $ 169,920 2. Journal entries:Work in Process—Dept. A ....................... 57,800Materials Inventory .............................. 57,800Work in Process—Dept. A ....................... 95,220Conversion Costs—Dept. A ............... 95,220*Work in Process—Dept. B ....................... 159,880Work in Process—Dept. A ................. 159,880 *When conversion costs are not broken into labor and overhead components,a control account for conversion costs is used. Some firms now combineoverhead and direct labor costs into one category. This practice is develop-ing because direct labor is becoming a small percentage of total manufactur-ing costs.。
《管理会计》第六章短期生产经营决策练习题及答案.doc
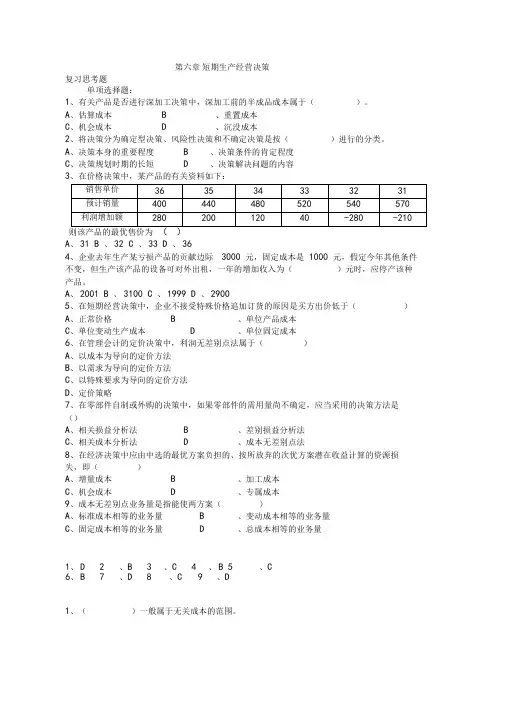
第六章短期生产经营决策复习思考题单项选择题:1、有关产品是否进行深加工决策中,深加工前的半成品成本属于()。
A、估算成本 B 、重置成本C、机会成本 D 、沉没成本2、将决策分为确定型决策、风险性决策和不确定决策是按()进行的分类。
A、决策本身的重要程度 B 、决策条件的肯定程度C、决策规划时期的长短 D 、决策解决问题的内容3、在价格决策中,某产品的有关资料如下:则该产品的最优售价为()A、31 B 、32 C 、33 D 、364、企业去年生产某亏损产品的贡献边际3000 元,固定成本是1000 元,假定今年其他条件不变,但生产该产品的设备可对外出租,一年的增加收入为()元时,应停产该种产品。
A、2001 B 、3100 C 、1999 D 、29005、在短期经营决策中,企业不接受特殊价格追加订货的原因是买方出价低于()A、正常价格 B 、单位产品成本C、单位变动生产成本 D 、单位固定成本6、在管理会计的定价决策中,利润无差别点法属于()A、以成本为导向的定价方法B、以需求为导向的定价方法C、以特殊要求为导向的定价方法D、定价策略7、在零部件自制或外购的决策中,如果零部件的需用量尚不确定,应当采用的决策方法是()A、相关损益分析法 B 、差别损益分析法C、相关成本分析法 D 、成本无差别点法8、在经济决策中应由中选的最优方案负担的、按所放弃的次优方案潜在收益计算的资源损失,即()A、增量成本 B 、加工成本C、机会成本 D 、专属成本9、成本无差别点业务量是指能使两方案()A、标准成本相等的业务量 B 、变动成本相等的业务量C、固定成本相等的业务量 D 、总成本相等的业务量1、D2、B3、C 4 、B 5、C6、B7、D8、C9 、D1、()一般属于无关成本的范围。
A、历史成本BC、联合成本DE、沉没成本2、短期经营决策分析主要包括(A、生产经营决策分析B 、机会成本、专属成本C、D、战略决策分析E、3、)A、B、剩余生产经营能力C、D、最小生产经营能力E、4、)A、B、机会成本C、D、沉没成本E、5、)A、1B、1C、0D、0E、06、)A、B、共同成本C、D、不可避免成本E、7、)A、B、C、D、E、单1、C E 2 、AB 3 、ABCE 4 、ABC 5、BCDE6、B D 7 、ABCD名词解释:1、相关收入是指与特定决策方案相联系的、能对决策产生重大影响的、在短期经营决策中必须予以充分考虑的收入。
chapter6管理会计英文版
McGraw-Hill/Irwin
Copyright © 2008, The McGraw-Hill Companies, Inc.
McGraw-Hill/Irwin Copyright © 2008, The McGraw-Hill Companies, Inc.
9-9
Advantages of Self-Imposed Budgets
1. Individuals at all levels of the organization are viewed as members of the team whose judgments are valued by top management. 2. Budget estimates prepared by front-line managers are often more accurate than estimates prepared by top managers. 3. Motivation is generally higher when individuals participate in setting their own goals than when the goals are imposed from above. 4. A manager who is not able to meet a budget imposed from above can claim that it was unrealistic. Selfimposed budgets eliminate this excuse.
管理会计第六章答案——Answers for Chp 6
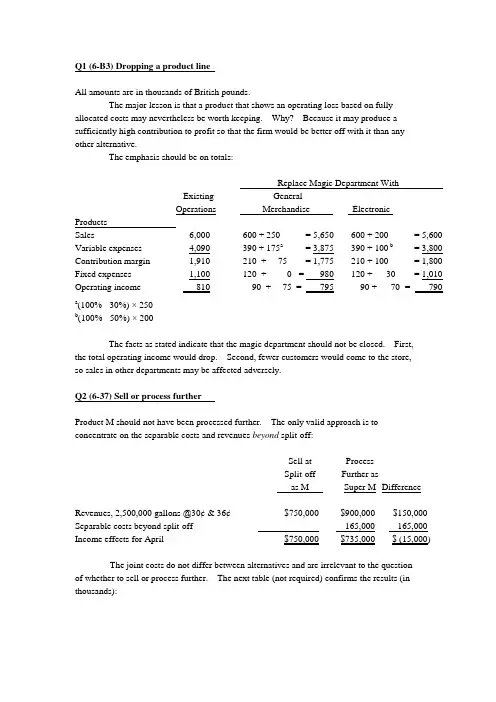
Q1 (6-B3) Dropping a product lineAll amounts are in thousands of British pounds.The major lesson is that a product that shows an operating loss based on fullyallocated costs may nevertheless be worth keeping. Why? Because it may produce a sufficiently high contribution to profit so that the firm would be better off with it than any other alternative.The emphasis should be on totals:Existing General Replace Magic Department With Operations Merchandise Sales 6,000 -600 + 250 = 5,650 -600 + 200 = 5,600 Electronic ProductsVariable expenses 4,090 -390 + 175a = 3,875 -390 + 100 b = Contribution margin 1,910 -210 + 75 = 1,775 -210 + 100 = 1,800 3,800 Fixed expenses 1,100 -120 + 0 = 980 -120 + 30 = Operating income 810 - 90 + 75 = 795 - 90 + 70 = 790 1,010 a(100% - 30%) × 250b (100% - 50%) × 200The facts as stated indicate that the magic department should not be closed. First, the total operating income would drop. Second, fewer customers would come to the store, so sales in other departments may be affected adversely.Q2 (6-37) Sell or process furtherProduct M should not have been processed further. The only valid approach is toconcentrate on the separable costs and revenues beyond split-off:Sell at ProcessSplit-off Further asas M Super M Difference Revenues, 2,500,000 gallons @30¢ & 36¢ $750,000 $900,000 $150,000 Separable costs beyond split-off -- 165,000 Income effects for April $750,000 $735,000 $ (15,000) 165,000The joint costs do not differ between alternatives and are irrelevant to the question of whether to sell or process further. The next table (not required) confirms the results (in thousands):Alternative 1Super DifferentialAlternative 2L M Total L M TotalEffectsRevenues $1,000 $750 $1,750 $1,000 $900 $1,900Joint costs $1,600 $1,600 ---$ 150Separable costs --- 165 165 Total costs 165$1,600 $1,765Income effects $ 150 $ 135 $(15)$ 165The difference in total costs over the five years is $3,000 in favor of keeping, computed as follows:Q3 (6-40) Replacement of old equipmentFive Years TogetherKeep ReplaceCash operating costs $22,500 $15,000 $ 7,500DifferenceOld machine (book value):Depreciation 5,000 --or --Lump-sum write-off -- 5,000Disposal value -- -2,000 2,000 New machine: Acquisition cost -- 12,500Total costs $27,500 $30,500 ($ 3,000)-12,5002. The loss on disposal of the old machine combines the lump-sum write-off (anirrelevant item) with the disposal value (a relevant item), $5,000 - $2,000 = $3,000loss on disposal. Because of the inclusion of an irrelevant item, this amount doesnot affect the computation in requirement 1. It is best to keep the lump-sumwrite-off and the disposal value separate, as is done in the table in requirement 1.Q4 (6-45) Hotel rooms and opportunity costs2. The simplest approach is:Let X = % of occupancyThen $110 × X = $70X = $70 ÷ $110 = 63.636%A longer approach follows. To be indifferent, Marriott would have to generate thesame rent as the American Airlines contract which is $70 × 50 rooms × 365 days =$1,277,500.Let Y = Number of rooms per day @ $110$110 × Y × 365 = $1,277,500$40,150 × Y = $1,277,500Y = 31.82 rooms per dayPercentage of occupancy of the 50 rooms = 31.82 ÷ 50= .63636= 63.636%To check the answer:$110 × .63636 × 50 × 365 = 1,277,493 ≈ $1,277,500Q5 (6-51) Choice of product2. The solution in requirement 1 assumes that moderately priced items can outselldesigner items 2 to 1 and that the store will be 100% full of such items.Interdependencies between the items are ignored. If these factors do not hold,some combination of the two items may be preferable.Additional considerations include the investment in inventories, the number of salespersonnel, the skills and training of sales personnel, and the degree of substitutability between the types of items.This problem could also be addressed on a unit basis. Suppose one designer item is displayed and sold in a given time period. How many moderately priced itemscould be sold in the same period? First, compute how many moderately priceditems would be displayed:Moderate priced items displayed = 4/3 × designer items displayed = 4/3 × 1 = 1 1/3 For each item displayed, 1 1/2 moderately priced items would be sold in the same time period that 1 designer item is sold. Why? Because turnover of designer items is 2/3 that of moderately priced items, which implies that turnover of moderately priced items is 1 1/2 times that of designer items. Therefore,Moderate priced items sold = 1 1/2 × 1 1/3 × designer items sold= 2 × designer items soldGulf Coast Fashions can use a given amount of space to sell either 1 designer item or 2 moderately priced items. Contribution margins are:Moderately priced itemsDesigner items1 × $120 = $1202 × $65 = $130The contribution is greater from selling 2 moderately priced items than from selling 1 designer item.Q6 (6-58) Conceptual approachMarketing management misjudged the life of the old freight cars. This may raise questions about the accuracy of the estimated useful life of the new freight cars. However, the unexpired costs of the old freight cars are not relevant to this decision. The conceptual error being made by the operating manager is the failure to distinguish between two decisions:the original decision and the current decision. Instead, he is mixing the two so that neither is evaluated correctly.The current decision should be influenced solely by expected future revenues and outlays, including the capital investment. The book value of the old equipment is per se irrelevant. The current decision should not carry the burden of past blunders.The past decision should be audited. In this instance, hindsight reveals that marketing management was overly optimistic. The key question is whether unwarranted optimism is being used again to justify additional outlays.Some instructors may wish to point out how decisions such as these might be affected by the long-term relationships with a big customer at this and other locations.Many decisions have such interdependencies.Q7 (6-66) Make or Buy1. The $10,000 disposal value of the old equipment is irrelevant because it is the samefor either choice. This solution assumes that the direct department fixed overheadis avoidable. You may want to explicitly discuss this assumption.Cost Comparison for Make or Buy DecisionAt 60,000 UnitsNormal VolumeBuyMakeOutside purchase cost at $1.00 - $60,000 Direct material at $.30 $18,000 -- Direct labor and variable overhead at $.10 6,000 -- Depreciation ($188,000 - $20,000) ÷ 7 24,000 -- Direct departmental fixed overhead** at$.10 or $6,000 annually 6,000-- Totals $54,000* $60,000*On a unit basis, which is very dangerous to use unless proper provision is made for comparability of volume:Direct material $.30Direct labor and variable overhead .10Depreciation, $24,000 ÷ 60,000 .40Other fixed overhead**, $6,000 ÷ 60,000.10Total unit cost $.90Note particularly that the machine sales representative was citing a $.24 depreciation rate that was based on 100,000 unit volume. She should have used a 60,000 unit volume for the Rohr Company.**Past records indicate that $.05 of the old unit cost was allocated fixed overhead that probably will be unaffected regardless of the decision. This assumption could bechallenged. This total of $3,000 ($.05 × 60,000 units) could be included under bothalternatives, causing the total costs to be $57,000 and $63,000, and the unit costs to be $.95 and $1.05, respectively. Note that such an inclusion would have no effect on thedifference between alternatives.Also, this analysis assumes that any idle facilities could not be put to alternative profitable use. The data indicate that manufacturing rather than purchasing is the better decision--before considering required investment.2. At 50,000 Units At 70,000 UnitsMake Buy Make BuyOutside purchase at $1.00 - $50,000 - $70,000Direct material at $.30 $15,000 -- $21,000 --Direct labor and variableoverhead at $.10 5,000 -- 7,000 --Depreciation 24,000 -- 24,000 --Other direct fixed overhead 6,000 -- 6,000-- Totals $50,000 $50,000 $58,000 $70,000At 70,000 units, the decision would not change. At 50,000 units, Rohr would be indifferent. The general approach to calculating the point of indifference is:Let X = Point of indifference in unitsTotal costs of making = Total costs of buying$.30X + $.10X + $24,000 + $6,000 = $1.00 X$30,000 = $.60 XX = 50,000 units3. Other factors would include: Dependability of estimates of volume needed, need for quality control, possible alternative uses of the facilities, relative merits of other outside suppliers, ability to renew production if price is unsatisfactory, and the minimum desired rate of return. Factors that are particularly applicable to the evaluation of the outside supplier include: short-run and long-run outlook for price changes, quality of goods, stability of employment, labor relations, and credit standing.。
国际会计第七版英文版课后答案(第六章)
Chapter 6Foreign Currency TranslationDiscussion Questions Solutions1.Foreign currency translation is the process of restating aforeign account balance from onecurrency to another. Foreign currency conversion is the process of physically exchanging onecurrency for another.2.In the foreign exchange spot market, currencies bought and sold must be delivered immediately,normally within 2 business days. Thus a Singaporean tourist buying U.S. dollars at the airportbefore boarding a plane for New York would hand over Singapore dollars and immediatelyreceive the equivalent amount in U.S. dollars. The forward market handles agreements toexchange a fixed amount of one currency for another on an agreed date in the future. Forexample, a French manufacturer exporting goods invoiced in euros to a Japanese importer on 60- day credit terms would buy a forward contract to sell yen for euros 2 months in the future.Transactions in the swap market involve the simultaneous purchase (or sale) of one currency in the spot market and the sale (or purchase) of the same currency in the forward market. Thus, a Canadian investor wishing to take advantage of higher interest rates on 6-month Treasury bills in the United States would buy U.S. dollars with Canadian dollars in the spot market and invest in the United States. To guard against a fall in the value of the U.S. dollar before maturity (when the U.S. dollar proceeds are converted back to Canadian dollars), the Canadian investor would simultaneously enter into a forward contract to sell U.S. dollars for Canadian dollars 6 months in the future at today s forward exchange rate.3.The question refers to alternative exchange rates that are usedto translate foreign financialstatements. The current rate is the exchange rate at the financial statement date. It issometimes called the year-end or closing rate. The historical rate is the exchange rate at the time of the underlying transaction. The average rate is the average of various exchange rates during a fiscal period. Since the average rate normally is used to translate income statement items, it isoften weighted to reflect any seasonal changes in the volume of transactions during the period.Translation gains and losses do not occur if exchange rates do not change. However, if exchange rates change, the use of current and average rates causes translation gains and losses.These do not occur when the historical rate is used because the same (constant) rate is used each period.4. In this example, the Mexican Affiliate s Canadian dollar loan is denominated in Canadian dollars.However, because the Mexican affiliate’s functional currency is U.S. dollars, the peso equivalent of the Canadian dollar borrowing would be remeasured in U.S. dollars prior to consolidation. If the Mexican affiliate’s functional currency were the peso, the Canadian dollar loan would beremeasured in pesos before being translated to U.S. dollars.5. A transaction gain or loss occurs when a foreign currency transaction, e.g., a foreign currencyborrowing, is settled at a different exchange rate than that which prevailed when the transaction was originally incurred. In this case there is an exchange of one currency for another. Atranslation gain or loss, on the other hand, is simply the resultof a restatement process. There is1no physical exchange of currencies involved.6. It is not possible to combine, add, or subtract accounting measurements expressed in differentcurrencies; thus, it is necessary to translate those accounts that are measured or denominated in a foreign currency into a singlereporting currency. Foreign currency translation can involverestatement or remeasurement. In restatement, the local (functional) currency is kept as the unit of measure; that is, the translationprocess multiplies the financial results and relationships in the local currency accounts by a constant, the current rate. In contrast, remeasurement translateslocal currency results as if the underlying transactions had taken place in the reporting(functional) currency of the parent company; for example, it changes the unit of measure of aforeign subsidiary from its local (foreign) currency to the U.S. dollar.7. Major advantages and limitations of each of the majortranslation methods follow.Current Rate MethodAdvantages:a. Retains the initial relationships in the foreign currency statements.b. Simple to apply.Limitations:a. Violates the basic purpose of consolidation, which is to present the results of a parent and its subsidiaries as if they were a single entity.b. Inconsistent with historical cost.c. Presumes that all local assets and liabilities are subject to exchange risk.d. While stockholders equity adjustments shield an MNC s bottomline from translation gains and losses, such adjustments could distort certain financial ratios and be confusing.Current-noncurrent MethodAdvantages:a. Distortions in translated gross margins are reduced as inventories and translated at the current rate.b. Reported earnings are shielded from the distorting effects of currency fluctuations as excess translation gains are deferred and used to offset future translation losses.Limitations:a. Uses balance sheet classification as basis for translation.b. Assumes all current assets are exposed to exchange risk regardless of their form.c. Assumes long-term debt is sheltered from exchange rate risk.Monetary-nonmonetary MethodAdvantages:a. Reflects changes in domestic currency equivalent of long-term debt on a timely basis. Limitations:a. Assumes that only monetary assets and liabilities are subject to exchange rate risk.b. Exchange rate changes distort profit margins as sales transacted at current prices are matched against cost of sales measured at historical prices.c. Uses balance sheet classification as basis for translation.d. Nonmonetary items stated at current market values are translated at historical rates.Temporal MethodAdvantages:a. Theoretically valid: compatible with any accounting measurement method.b. Has the effect of translating foreign subsidiaries operations as if they were originally transacted in the home currency, which is desirable for foreign operations that are extensions of the pare nt’s activities. Limitation:a. A company increases its earnings volatility by recognizing translation gains and losses currently.In arguing for one translation method over another, your students should eventually realize that, in the present state of the art, there is probably no one translation method that is appropriate for all circumstances in which translations occur and for all purposes thattranslation serves. It is probably more fruitful to have students identify circumstances in which they think one translation method is more appropriate than another.8.The current rate method is appropriate when the foreign entity being consolidated is largelyindependent of the parent company. Conditions which would justify this methodology is when the foreign affiliate tends to generate and expend cash flows in the local currency, sells a product locally so that its selling price is largely insulated from exchange rate changes, incurs expenses locally, finances its self locally and does not have very many transactions with the parentcompany. In contrast, the temporal method seems appropriate in those instances when theforeign affiliate’s operations are integrally related to the parent company. Conditions whichwould justify use of the temporal method are when the foreign affiliate transacts business in the parent currency and remits such cash flows to the parent company, sells a product largely in the parent country and whose selling price is sensitive to exchange rate changes, sources its factorinputs from the parent company, receives most of its financing from the parent and has a largetwo way flow of transactions with it.9.The history of foreign currency translation in the United States suggests that the development ofaccounting principles does not depend on theoretical considerations so much as on political, institutional, and economic influences that affect accounting standard setting. It may be morerealistic to recognize that theoretically sound solutions are impossible as long as policyprescriptions are evaluated on practical grounds. Without specific choice criteria derived from investor decision models, it is fruitless to argue the conceptual merits of competing accounting treatments. It isfar more productive to admit that foreign currency translation choices are simply arbitrary.Readers of consolidated financial statements should know that the foreign currency translation method used is one of several alternatives, and this should be disclosed. This approach is more open and reduces the chance that readers will draw misleading inferences.10.Foreign inflation, in particular, the differential rate of inflation between the country in which asubsidiary is located and the country of its parent determines foreign exchange rates. Theserates, in turn, are used to translate foreign currency balances to parent currency.11.In the United Kingdom, financial statements of affiliates domiciled in hyperinflationaryenvironments must first be adjusted to current price levels and then translated using the current rate; in the United States, the temporal method would be employed. The second part of thisquestion is designed to get students from abroad to find out what companies in their homecountries are doing and thereby be in a position to share their new found knowledge with theirclassmates. They need simply get on the internet and read the footnotes of a major multinational company in their home country.12.Under FAS No. 52, the parent currency is designated as the functional currency for an affiliate,whose operations are considered to be an integral part of the parent company’s operations.Accordingly, anything that affects consolidated earnings, including foreign currency translation gains and losses, is relevant to parent company shareholders and is included in reported earnings.In contrast, when a foreign affiliate s operations are independent of the parent s, the localcurrency is designated as its functional currency. Since the focus is on the affiliate s localperformance, translation gains and losses that arise solely from consolidation are irrelevant and, therefore, are not included in consolidated income.Exercises Solutions1.¥250,000,000 X .008557 = $2,139,250.¥250,000,000 ÷ ¥116.86 = $2, 139,312The difference is due to rounding.2.Since £1 = US$1.9590 and €1 = US$1.3256, £1 =US$1.9590/US$1.3256 = €1.4778.Alternatively, €1 = US$1.3256/US$1.9590 = £.6767.3.Single Transaction Perspective:4/1 Purchases (¥32,500,000/¥116.91) $277,992Cash $27,800A/P(¥32,500,000 - ¥3,250,000)/¥116.91 250,192(Credit purchase)7/1 Purchases[(¥29,250,000/¥116.91) – (¥29,250,000/¥115.47) 3,120A/P 3,120(To record increase in purchases due to yen appreciation)7/1 Interest expense(¥29,250,000 X .08 X 3/12)/¥115.47 5,066A/P(¥29,250,000/¥115.47) 253,312Cash 258,378(To record settlement)Two Transactions Pers pective:4/1 Purchases $277,992Cash $27,800A/P 250,1927/1 Transaction loss 3,120A/P 3,1207/1 Interest expense 5,066A/P 253,312Cash 258,3784. a. MXN 1,750,000/MXN10.3 = C$169,903.b. The Canadian dollar equivalent of the Mexican inventory account would not change if the functional currencywas the Canadian dollar as the temporal method translates inventory, a nonmonetary asset, at the exchange rate that preserves its original measurement basis. Since inventory is being carried at its netrealizable value, it would be translated at the current rate. Had inventory been carried at historical cosuld have been translated at the historical rate or MXN3,750,000/MXN9.3 = C$403,226.5. Baht is the functional currency:B 2,500,000/20 years = B 125,000B 125,000/B37 = 3,378B 5,000,000/20 years = B 250,000B 250,000/B37 = 6,757U.S. dollar is the functional currency:B 2,500,000/20 years = B 125,000B 125,000/B40 = 3,125B 5,000,000/20 years = B 250,000B 250,000/B38 = 6,579Total depreciation $ 9,7046. If the euro is the German subsidiary’s functional currency, its accounts would be t ranslated into Australian dollarsusing the current rate method. In this case the translation gain of AUD4,545,455 would appear in consolidated equity.Thus the only item affecting current income would be thetransaction loss(loss on an unsettled transac tion) ofAUD1,514,515 on the euro borrowing.If the Australian dollar is deemed to be the functional currency, then the transaction loss andtranslation gain would both appear in reported earnings as follows:AUD(1,514,515) transaction lossAUD4,545,455 translation gainAUD3,030,940 net foreign exchange gain7.U.S. Dollar U.S. Dollar U.S. DollarBefore CNY After CNY After CNYAppreciation Appreciation DepreciationCNY Balance Sheet ($.12=CNY1) ($.15 = C NY1) ($0.09 = CNY1) Assets Amount Current Monetary Current MonetaryNoncurrent Nonmonetary Noncurrent NonmonetaryCash NT5,000 $600 $ 750 $ 750 $ 450 $ 450Accts. R eceivable 14,000 1,680 2,100 2,100 1,260 1,260 Inventories(cost=24,000) 22,000 2,640 3,300 2,640 1,980 2,640Fixed assets, net 39,000 4,680 4,680 4,680 4,680 4,680Total CNY 80,000 $9,600 $10,830 $10,170 $8,370 $9,030 Liabilities & Owners EquityAccts. Payable CNY21,000 $2,520 $ 3,150 $ 3,150 $1,890 $1,890Long-term debt 27,000 3,240 3,240 4,050 3,240 2,430 Stockholders equity 32,000 3,840 4,440 2,970 3,240 4,710 Total CNY 80,000 $9,600 $10,830 $10,170 $8,370 $9,030 Accou nting exposure CNY20,000 (29,000) 20,000 (29,000) Translation gain (loss) US$ 600 (870) (600) 8708.U.S. Dollar U.S. Dollar U.S. DollarBefore CNY After CNY After CNYAppreciation Appreciation DepreciationCNY Balance Sheet ($.12=CNY1) ($.15 = C NY1) ($.09 = C NY1) Assets Amou nt Temporal Current Temporal CurrentCash CNY5,000 $ 600 $ 750 $ 750 $ 450 $ 450Accts. R eceivable 14,000 1,680 2,100 2,100 1,260 1,260 Inventories(cost=24,000) 22,000 2,640 3,300 3,300 1,980 1,980Fixed assets, net 39,000 3,600 3,600 5,850 3,600 3,510 Total CNY 80,000 $8,520 $9,750 $12,000 $11,700 $7,200Liabilities & Owners EquityAccts. Payable CNY21,000 $2,520 $3,150 $3,150 $1,890 $1,890Long-term debt 27,000 3,240 4,050 4,050 2,430 2,430Stockholders equity 32,000 2,760 2,550 4,800 7,380 2,880Total NT$ 80,000 $8,520 $9,750 $12,000 $11,700 $7,200Accou nting exposure NT$ (7,000) 32,000 (7,000) 32,000Translation gain (loss) US$ (210) 960 210 (960)c. Students will quickly discover that each translation method has its advantages and disadvantages. After some discussion, the question of translation objectives will arise. Currency translation objectives are based on how foreign operations are viewed. If foreign operations are considered extensions of the parent, a case can be made for a historical rate method: current-noncurrent, monetary-nonmonetary, or temporal. If foreign operations are viewed from a local company perspective, a case can be made for the current rate method. Given the complexity of multinational business activities, one could argue that a single translation method will not serve all purposes for which translations are done. As long as the objectives of foreign currency translation differ among specific reporting entities, a practical solution is to insist onfull disclosure of the translation procedures used so that users have a basis for reconciling any differences that exist.9.Company A (Country A)(Reporting Currency = Apeso)Beginning of Year End of YearAssets: Exchange Rate Translated Exchange Rate TranslatedApeso 100 Apeso 100 Apeso 100Bol 100 Apeso 1 = Bol 1.25 Apeso 80 Apeso 1 = Bol 2 Apeso 50Apeso 180 Apeso 150Translation loss = A$ 30Company B (Country B)(Reporting Currency = Bol)Beginning of Year End of YearAssets: Exchange Rate Translated Exchange Rate TranslatedApeso 100 Apeso 1 = Bol 1.25 Bol 125 Apeso 1 = Bol 2 Bol 200Bol 100 Bol 100 Bol 100Bol 225 Bol 300Translation gain = Bol 75b. This exercise demonstrates the effect of the reporting currency on foreign currency translation results when the current rate method is used. Both companies are in seemingly identical situations, yet one reports a translation loss while the other reports a translation gain. One company reports shrinking assets while the other reports increasing assets. Nothing has actually happened but an exchange rate change. Also, despite a stronger Apeso, Company A reports a loss. Conversely, the Bol weakened, yet Company B reports a gain. It appears that a strengthening currency is not always good news, nor is a weakening currency always bad news.If the intention is to repatriate the funds invested in the foreign country (Country B from Company A’s perspective, Country A from Company B’s perspective), the scenario makes sense. After all, CompanyA will be repatriating fewer Apesos than originally invested and CompanyB will be repatriating moreB ol’s than originally invested. Fluctuating exchange rates have changed each company s command over a foreign currency. Assuming the company intends to repatriate the currency, it makes sense to include the respective gain or loss in income for the current year. On the other hand it can be argued that the gain or loss should be excluded fromincome if the company intends to keep the foreign assets invested permanently..10.Translation RateLocal Currency is Dollar isFunctional Currency Functional CurrencyCash Current CurrentMarketable securities (cost)Current Historical aAccounts receivable Current CurrentInventory (market) Current CurrentEquipment Current HistoricalAccumulated depreciation Current HistoricalPrepaid expenses Current HistoricalGoodwill Current HistoricalAccounts payable Current CurrentDue to parent (denominated in dollars) Current CurrentBonds payable Current CurrentIncome taxes payable Current CurrentDeferred income taxes Current CurrentCommon stock Historical HistoricalPremium on common stock Historical HistoricalRetained Earnings Balancing Residual Balancing ResidualSales Average AveragePurchases Average AverageCost of Sales Average HistoricalGeneral and administrative expenses Average AverageSelling expenses Average HistoricalDepreciation Average HistoricalAmortization of goodwill Average HistoricalIncome tax expense Average AverageInter-company interest expense Average Average___________________________________________________________________ _______________________________________________________a Fixed income securities intended to be held to maturity.11. a. Before riyal depreciation:Cash SAR 60,000,000 ÷ SA R3.75 = $ 16,000,000Inventory 120,000,000 ÷ SA R3.75 = 32,000,000Fixed Assets 750,000,000 ÷ SA R3.75 = 200,000,000Total $248,000,000After riyal depreciation:Cash SAR 60,000,000 ÷ SA R4.125 = $ 14,545,455Inventory 120,000,000 ÷ SA R3.75 = 32,000,000Fixed Assets 750,000,000 ÷ SA R3.75 = 200,000,000Total $246,545,455Translation loss $(1,454,455)b.The translation loss has no effect on MSC’s cash flows as it is the result of a restatement process.c.equity. However, in addition inventory and fixed assets would be translated at the current rate, as opposed to thehistorical rate, and the resulting translation loss would also be taken to consolidated equity. This would result in a different earnings number as well as asset measures.Before riyal depreciation:Cash SAR 60,000,000 ÷ SA R3.75 = $ 16,000,000Inventory 120,000,000 ÷ SA R3.75 = 32,000,000Fixed Assets 750,000,000 ÷ SA R3.75 = 200,000,000Total $248,000,000After riyal depreciation:Cash SAR 60,000,000 ÷ SA R4.125 = $ 14,545,455Inventory 120,000,000 ÷ SA R4.125 = 29,090,909Fixed Assets 750,000,000 ÷ SA R4.125 = 181,818,182Total $225,454,546Translation adjustnment reflected in equity$(22,545,454)Students could also be probed and asked how the adjusted numbers would impact certain ratios such as ROA or ROE, Debt to Equity, and asset turnover.12. a. The currency effects in the first and third paragraphs have an impact on Alcan’s cash flows. IN the firstparagraph, echange rate changes affect Alcan’s future revenues and costs and directly affect cash receipts andpayments. The third paragraph involves settling foreign currency transactions at a different echange rate than when the transaction were entered into.b.Alcan appears to be employing the monetary-nonmonetary method.c. Many analysts back out translation gains and losses from reported earnings as these are largely non-cash itemsthat simply result from a restatement process. This wouldespecially be the case if Alcan were being compared to a company employing the current rate method. Disregarding translation gains and losses would have the following effect on reported earnings:20X5 20X4 20X3With translation G/L $129m $258m $64mTranslation G/L (86) (153) (326)Without Translation G/L $215m $411m $390mThe impact on the pattern of earnings would change significantly. The year to year changes in earnings both before and after abstracting from currency translation effects are:20X5/20X3 20X5/20X4 20X4/20X3With translation G/L 102% -50% 303%Without Translation G/L 45% -48% 5%Case 6-1 Regents CorporationThe nature of Regents’s operation is such that choice of an appropriate functional currency is ultimately a judgement call. Students can argue for either currency and should be evaluated on the strength of their analysis. A major lesson of this case is that the functional currency choice is important since the currency designation dictateswhich translation method, (current or temporal) is ultimately used. The financial statement effects can be very different. Thus it is importantfor a reader of financial statements to understand how the differing measurement options affect the balance sheet and income statement and be prepared to adjust from one framework to the other, even if only crudely.TEMPORAL METHOD(U.S. DOLLAR IS THE FUNCTIONAL CURRENCY)Balance Sheet Accounts, 12/31/X7 Foreign Currency Exchange RateDollar EquivalentCash £ 1,060 1.80 $ 1,908Accounts receivable 2,890 1.90 5,491Inventory 3,040 1.78 5,411Fixed assets 4,400 1.70 7,480 Accumulated depreciation (420) 1.70 (714)Patent ----- -----Total £10,970 $19,576 Accounts payable £ 1,610 1.80 $ 2,898Due to parent 1,800 1.80 3,240Long-term debt 4,500 1.80 8,100 Deferred taxes 80 1.80 144 Common stock 1,500 1.70 2,550 Retained earnings 1,480 residual 2,644£10,970 $19,576 Income Statement, 12/31/X8 Foreign Currency Exchange Rate Dollar Equivalent Sales £ 16,700 1.86 $ 31,062Cost of sales a (11,300) (20,706) General and administrative (1,600) 1.86 (2,976) Depreciation (280) 1.70 (476)(20) 1.82 (36) Interest (480) 1.86 (893) Transaction gain 125 1.86 233 Aggregate translation adjustment b (368) Taxes:Current (670) 1.86 (1,246)Deferred (40) 1.86 (74)Net income £ 2,435 $ 4,520 Retained earnings, 12/31X7 1,480 2,644 Dividends (300) 1.86 (558) Retained earnings, 12/31X8 £ 3,615 $ 6,606a Beginning inventory £ 3,040 1.78 $ 5,411 Purchases 11,690 1.86 21,743Ending inventory 3,430 1.88 6,448 Cost of Sales 11,300 $20,706b Aggregate translation adjustment:1. Monetary assets, 12/31/X7 £ 3,950Monetary liabilities, 12/31/X7 7,990(£ 4,040) x (1.90 - 1.80) = ($404) 2. Change in negative exposure: 12/31/X7 (£ 4,040)12/31/X8 (2,565 )£ 1,475Composition of decrease:Sources of monetary items:Net income £2,435Depreciation 300 £2,735Uses of monetary items:Inventory increase £(390)Addition to fixed assets (500)Purchase of patent (70)Dividends (300 ) (1,260 )£1,475£2,345 x (1.90 - 1.86) = $94300 x (1.90 – 1.86) = 12 $1094. Uses of monetary items x difference in year-end rate and rate used to translate those items =£(390) x (1.90 – 1.86) = $(15)(300) x (1.90 - 1.86) = (12)(500) x (1.90 - 1.82) = (40)(70) x (1.90 - 1.82) = (6 ) (73)Aggregate translation adjustment = ($404)109(73 )($368)Balance Sheet, 12/31/X8 Foreign Currency Exchange Rate Dollar EquivalentCash £ 1,150 1.90 $2,185 Accounts receivable 3,100 1.90 5,890 Inventory 3,430 1.88 6,448Fixed assets a 4,900 8,390 Accumulated depreciation b (720) (1,226)Patent 70 1.82 127Total £11,930 $21,814 Accounts payable £ 1,385 1.90 $ 2,632Due to parent 1,310 1.90 2,489Long-term debt 4,000 1.90 7,600 Deferred taxes 120 1.90 228 Common stock 1,500 1.70 2,550 Retained earnings 3,615 6,309Total £11,930 $21,814a Original assets £ 4,400 1.70 $ 7,480New assets 500 1.82 910$ 8,390b Original assets £ 700 1.70New assets 20 1.82 36$ 1,226CURRENT RATE METHOD(LOCAL CURRENCY IS THE FUNCTIONAL CURRENCY)Balance Sheet Accounts, 12/31/X7 Foreign Currency Exchange Rate Dollar Equivalent Cash £ 1,060 1.80 $ 1,908 Accounts receivable 2,890 1.80 5,202 Inventory 3,040 1.80 5,472Fixed assets 4,400 1.80 7,920 Accumulated depreciation (420) 1.80 (756)Patent --- ---Total £10,970 $19,746Accounts payable £ 1,610 1.80 $ 2,898Due to parent 1,800 1.80 3,240Long-term debt 4,500 1.80 8,100Deferred taxes 80 1.80 144Common stock 1,500 1.70 2,550Retained earnings 1,480 2,355Cumulative translation adjustment --- 459(given)Total £ 10,970 $19,746Income Statement, 12/31/X8 Foreign Currency Exchange Rate Dollar Equivalent Sales £16,700 1.86 $31,062Cost of sales (11,300) 1.86 (21,018)General and administrative (1,600) 1.86 (2,976) Depreciation (300) 1.86 (558)Interest (480) 1.86 (893) Transaction gain 125 1.86 232Taxes:Current (670) 1.86 (1,246)Deferred (40) 1.86 (74)Net income £ 2,435 $ 4,529Retained earnings, 12/31X7 1,480 2,355Dividends (300) 1.86 (558)Retained earnings, 12/31X8 £ 3,615 $ 6,326Balance Sheet, 12/31/X8 Foreign Currency Exchange Rate Dollar EquivalentCash £ 1,150 1.90 $ 2,185Accounts receivable 3,100 1.90 5,890Inventory 3,430 1.90 6,517Fixed assets 4,900 1.90 9,310Accumulated depreciation (720) 1.90 (1,368)Patent 70 1.90 133Total £ 11,930 $22,667Accounts payable £ 1,385 1.90 $ 2,632Due to parent 1,310 1.90 2,489Long-term debt 4,000 1.90 7,600Deferred taxes 120 1.90 228Common stock 1,500 1.70 2,550Retained earnings 3,615 6,326Cumulative translation adj. ----- 842aTotal £11,930 $22,667a Cumulative translation adjustment:1. Net exposed assets, 12/31/X7, x change in current rate = £2.980 x (1.90 - 1.80) = $2982. Change in net assets x difference between year-end and average rate = £2.135 x (1.90 - 1.86) = 853. Cumulative translation adjustment 12/31/X7 4594. Cumulative translation adjustment, 12/31/X8 $842Selected policy issues raised by the Regents Corporation case:1. Are the FASB s criteria for selecting a functional currency designation adequate? Are there criteria that are more definitive than those identified in this chapter?2. W ill statement readers understand the nature of the aggregate exchange adjustment appearing in the consolidated income statement under the temporal method of translation that includes both transaction and translation gains and losses?。
管理会计双语人教版 Chapter 06

15
Name of company Conventional (Absorption Costing) Income Statement
Period ended XXXXX Sales revenue Less: Cost of goods sold: Beginning finished goods inventory Cost of goods manufactured Cost of goods available for sale Ending finished goods inventory Cost of goods sold Gross profit Operating expenses Operating income
Operating income
Copyright © 2010 Pearson Education, Inc. Publishing as Prentice Hall. 18
Swim Clearly Conventional (Absorption Costing) Income Statement
6
营业利润差额的概念及产生的原因
1、完全成本法下的营业利润 — 变动成本法下的营业利润 称为利润差额 广义 ( > 0 , < 0 ,= 0 ) 狭义—— 差额不为0(利润不相等)
2、导致利润不等的原因分析
从例1中分析一下差额在哪个环节中产生? 非收入即成本 销售收入完全相同(单价、销售量不变) 变动生产成本的数额也相等(单位变动生产成本两种 成 本法下的数额相同)
Year Ended December 31, 2010
$7,585,000
Cost of goods manufactured 6,400,000 $32 x 15,000 = $480,000 ($22 x available 200,000 for goggles Cost + of $10) goods sale produced 6,400,000 = $6,400,000 cost of goods Ending finished goods inventory (480,000) manufactured Cost of goods sold (5,920,000) Gross profit 1,665,000 Operating expenses ($6 x 185,000 goggles) + $250,000 (1,360,000) Operating income $305,000
管理会计第六章课后习题答案
【计算分析题】1. 某人将100万元投资于一项事业,估计年报酬率为6%,在10年中此人并不提走任何现金,10年末该项投资的本利和为多少?100×(F/P,6%,10)=100×1.7908=179.08万元2. 某人打算在5年后送儿子出国留学,如果5年末需要一次性取出30万元学费,年利率为3%,复利计息情况下,他现在应存入银行多少钱?30×(P/F,3%,5)=30×0.8626=25.878万元3. 某企业10年后需偿还到期债务1000万元,如年复利率为10%,则为偿还债务企业每年年末应建立多少等额的偿债基金?1000÷(F/A,10%,10)=1000÷15.9374=62.75万元4. 某人购入一套商品房,向银行按揭贷款50万元,准备20年内于每年年末等额偿还,银行贷款利率为5%,他每年应归还多少钱?50÷(P/A,5%,20)=50÷12.4622=4.01万元5.某公司拟购置一处房产,现有两种付款方案可供选择:(1)从现在起,每年年初支付10万元,连续支付10年;(2)从第4年开始,每年年初支付15万元,连续支付10年。
假设该公司的资金成本率为10%,该公司应选择哪个方案?方案一的现值:10×[(P/A,10%,9)+1]=10×(5.759+1)=67.59万元方案二的现值:15×(P/A,10%,10)×(P/F,10%,2)=10×6.1446×0.8264=50.78万元因为方案二现值小于方案一现值,所以应选择方案二。
6. 某公司拟于2011年购置一台大型冲床,需一次性投资200万元,购入后安装调试即可投入运营。
该设备的使用寿命为8年,每年能为公司增加税前利润50万元。
设备采用直线法计提折旧,预计净残值率为5%。
公司要求的最低报酬率为10%,所得税税率25%。
《管理会计》英文版课后习题答案
第二章产品成本计算Exercises2–1(指教材上的第2章练习第1题,下同)1. Part #72A Part #172CSteel* $ 12.00 $ 18.00Setup cost** 6.00 6.00Total $ 18.00 $ 24.00*($1.00 ? 12; $1.00 ? 18)**($60,000/10,000)Steel cost is assigned by calculating a cost per ounce and then multiplying this by the ounces used by each part:Cost per ounce= $3,000,000/3,000,000 ounces= $1.00 per ounceSetup cost is assigned by calculating the cost per setup and then dividing this by the number of units in each batch (there are 20 setups per year):Cost per setup = $1,200,000/20= $60,0002. The cost of steel is assigned through the driver tracing using the number of ounces of steel, and the cost of the setups is assigned through driver tracing also using number of setups as the driver.3. The assumption underlying number of setups as the driver is that each part uses an equal amount of setup time. Since Part #72A uses double the setup time of Part #172C, it makes sense to assign setup costs based on setup time instead of number of setups. This illustrates the importance of identifying drivers that reflect the true underlying consumption pattern. Using setup hours [(40 ?10) + (20 ? 10)], we get the following rate per hour:Cost per setup hour = $1,200,000/600= $2,000 per hourThe cost per unit is obtained by dividing each part’s total setup costs by the number of units:Part #72A = ($2,000 ? 400)/100,000 = $8.00Part #172C = ($2,000 ? 200)/100,000 = $4.00Thus, Part #72A has its unit cost increased by $2.00, while Part #172C has its unit cost decreased by $2.00.problems2–51. Nursing hours required per year: 4 ? 24 hours ? 364 days* = 34,944*Note: 364 days = 7 days ? 52 weeksNumber of nurses = 34,944 hrs./2,000 hrs. per nurse = 17.472Annual nursing cost = (17 ? $45,000) + $22,500= $787,500Cost per patient day = $787,500/10,000 days= $78.75 per day (for either type of patient)2. Nursing hours act as the driver. If intensive care uses half of the hours and normal care the other half, then 50 percent of the cost is assigned to each patient category. Thus, the cost per patient day by patient category is as follows:Intensive care = $393,750*/2,000 days= $196.88 per dayNormal care = $393,750/8,000 days= $49.22 per day*$525,000/2 = $262,500The cost assignment reflects the actual usage of the nursing resource and, thus, should be more accurate. Patient days would be accurate only if intensive care patients used the same nursing hours per day as normal care patients.3. The salary of the nurse assigned only to intensive care is a directly traceable cost. To assign the other nursing costs, the hours of additional usage would need to be measured. Thus, both direct tracing and driver tracing would be used to assign nursing costs for this new setting.2–61. Bella Obra CompanyStatement of Cost of Services SoldFor the Year Ended June 30, 2006Direct materials:Beginning inventory $ 300,000Add: Purchases 600,000Materials available $ 900,000Less: Ending inventory 450,000*Direct materials used $ 450,000Direct labor 12,000,000Overhead 1,500,000Total service costs added $ 13,950,000Add: Beginning work in process 900,000Total production costs $ 14,850,000Less: Ending work in process 1,500,000Cost of services sold $ 13,350,000*Materials available less materials used2. The dominant cost is direct labor (presumably the salaries of the 100 professionals). Although labor is the major cost of providing many services, it is not always the case. For example, the dominant cost for some medical services may be overhead (e.g., CAT scans). In some services, the dominant cost may be materials (e.g., funeral services).3. Bella Obra CompanyIncome StatementFor the Year Ended June 30, 2006Sales $ 21,000,000Cost of services sold 13,350,000Gross margin $ 7,650,000Less operating expenses:Selling expenses $ 900,000Administrative expenses 750,000 1,650,000Income before income taxes $ 6,000,0004. Services have four attributes that are not possessed by tangible products: (1) intangibility, (2) perishability, (3) inseparability, and (4) heterogeneity. Intangibility means that the buyers of services cannot see, feel, hear, or taste a service before it is bought. Perishability means that services cannot be stored. This property affects the computation in Requirement 1. Inability to store services means that there will never be any finished goods inventories, thus making the cost of services produced equivalent to cost of services sold. Inseparability simply means that providers and buyers of services must be in direct contact for an exchange to take place. Heterogeneity refers to the greater chance for variation in the performance of services than in the production of tangible products.2–71. Direct materials:Magazine (5,000 ? $0.40) $ 2,000Brochure (10,000 ? $0.08) 800 $ 2,800Direct labor:Magazine [(5,000/20) ? $10] $ 2,500Brochure [(10,000/100) ? $10] 1,000 3,500Manufacturing overhead:Rent $ 1,400Depreciation [($40,000/20,000) ? 350*] 700Setups 600Insurance 140Power 350 3,190Cost of goods manufactured $ 9,490*Production is 20 units per printing hour for magazines and 100 units per printing hour for brochures, yielding monthly machine hours of 350 [(5,000/20) + (10,000/100)]. This is also monthly labor hours, as machine labor only operates the presses.2. Direct materials $ 2,800Direct labor 3,500Total prime costs $ 6,300Magazine:Direct materials $ 2,000Direct labor 2,500Total prime costs $ 4,500Brochure:Direct materials $ 800Direct labor 1,000Total prime costs $ 1,800Direct tracing was used to assign prime costs to the two products.3. Total monthly conversion cost:Direct labor $ 3,500Overhead 3,190Total $ 6,690Magazine:Direct labor $ 2,500Overhead:Power ($1 ? 250) $ 250Depreciation ($2 ? 250) 500Setups (2/3 ? $600) 400Rent and insurance ($4.40 ? 250 DLH)* 1,100 2,250Total $ 4,750Brochure:Direct labor $ 1,000Overhead:Power ($1 ? 100) $ 100Depreciation ($2 ? 100) 200Setups (1/3 ? $600) 200Rent and insurance ($4.40 ? 100 DLH)* 440 940Total $ 1,940*Rent and insurance cannot be traced to each product so the costs are assigned using direct labor hours: $1,540/350 DLH = $4.40 per direct labor hour. The other overhead costs are traced according to their usage. Depreciation and power are assigned by using machine hours (250 for magazines and 100 for brochures): $350/350 = $1.00 per machine hour for power and $40,000/20,000 = $2.00 per machine hour for depreciation. Setups are assigned according to the time required. Since magazines use twice as much time, they receive twice the cost: Letting X = the pro?portion of setup time used for brochures, 2X + X = 1 implies a cost assignment ratio of 2/3 for magazines and 1/3 for brochures.Exercises3–11. Resource Total Cost Unit CostPlastic1 $ 10,800 $0.027Direct labor andvariable overhead2 8,000 0.020Mold sets3 20,000 0.050Other facility costs4 10,000 0.025Total $ 48,800 $0.12210.90 ? $0.03 ? 400,000 = $10,800; $10,800/400,000 = $0.0272$0.02 ? 400,000 = $8,000; $8,000/400,000 = $0.023$5,000 ? 4 quarters = $20,000; $20,000/400,000 = $0.054$10,000; $10,000/400,000 = $0.0252. Plastic, direct labor, and variable overhead are flexible resources; molds and other facility costs are committed resources. The cost of plastic, direct labor, and variable overhead are strictly variable. The cost of the molds is fixed for the particular action figure being produced; it is a step cost for the production of action figures in general. Other facility costs are strictly fixed.3–3High (1,400, $7,950); Low (700, $5,150)V = ($7,950 – $5,150)/(1,400 – 700)= $2,800/700 = $4 per oil changeF = $5,150 – $4(700)= $5,150 – $2,800 = $2,350Cost = $2,350 + $4 (oil changes)Predicted cost for January = $2,350 + $4(1,000) = $6,350problems3–61. High (1,700, $21,000); Low (700, $15,000)V = (Y2 – Y1)/(X2 – X1)= ($21,000 – $15,000)/(1,700 – 700) = $6 per receiving orderF = Y2 – VX2= $21,000 – ($6)(1,700) = $10,800Y = $10,800 + $6X2. Output of spreadsheet regression routine with number of receiving orders as the independent variable:Constant 4512.98701298698Std. Err. of Y Est. 3456.24317476605R Squared 0.633710482694768No. of Observations 10Degrees of Freedom 8X Coefficient(s) 13.3766233766234Std. Err. of Coef. 3.59557461331427V = $13.38 per receiving order (rounded)F = $4,513 (rounded)Y = $4,513 + $13.38XR2 = 0.634, or 63.4%Receiving orders explain about 63.4 percent of the variability in receiving cost, providing evidence that Tracy’s choice o f a cost driver is reasonable. However, other drivers may need to be considered because 63.4 percent may not be strong enough to justify the use of only receiving orders.3. Regression with pounds of material as the independent variable:Constant 5632.28109733183Std. Err. of Y Est. 2390.10628259277R Squared 0.824833789433823No. of Observations 10Degrees of Freedom 8X Coefficient(s) 0.0449642991356633Std. Err. of Coef. 0.0073259640055344V = $0.045 per pound of material delivered (rounded)F = $5,632 (rounded)Y = $5,632 + $0.045XR2 = 0.825, or 82.5%Pounds of material delivered explains about 82.5 percent of the variability in receiving cost. This is a better result than that of the receiving orders and should convince Tracy to try multiple regression.4. Regression routine with pounds of material and number of receiving orders as the independent variables:Constant 752.104072925631Std. Err. of Y Est. 1350.46286973443R Squared 0.951068418023306No. of Observations 10Degrees of Freedom 7X Coefficient(s) 0.0333883151096915 7.14702865269395Std. Err. of Coef. 0.00495524841198368 1.68182916088492V1 = $0.033 per pound of material delivered (rounded)V2 = $7.147 per receiving order (rounded)F = $752 (rounded)Y = $752 + $0.033a + $7.147bR2 = 0.95, or 95%Multiple regression with both variables explains 95 percent of the variability in receiving cost. This is the best result.5–21. Job #57 Job #58 Job #59Balance, 7/1 $ 22,450 $ 0 $ 0Direct materials 12,900 9,900 35,350Direct labor 20,000 6,500 13,000Applied overhead:Power 750 600 3,600Material handling 1,500 300 6,000Purchasing 250 1,000 250Total cost $ 57,850 $ 18,300 $ 58,2002. Ending balance in Work in Process = Job #58 = $18,3003. Ending balance in Finished Goods = Job #59 = $58,2004. Cost of Goods Sold = Job #57 = $57,850problems5–31. Overhead rate = $180/$900 = 0.20 or 20% of direct labor dollars.(This rate was calculated using information from the Ladan job; however, the Myron and Coe jobs would give the same answer.)2. Ladan Myron Coe Walker WillisBeginning WIP $ 1,730 $1,180 $2,500 $ 0 $ 0Direct materials 400 150 260 800 760Direct labor 800 900 650 350 900Applied overhead 160 180 130 70 180Total $ 3,090 $2,410 $3,540 $ 1,220 $ 1,840Note: This is just one way of setting up the job-order cost sheets. You might prefer to keep the detail on the materials, labor, and overhead in beginning inventory costs.3. Since the Ladan and Myron jobs were completed, the others must still be in process. Therefore, the ending balance in Work in Process is the sum of the costs of the Coe, Walker, and Willis jobs.Coe $3,540Walker 1,220Willis 1,840Ending Work in Process $6,600Cost of Goods Sold = Ladan job + Myron job = $3,090 + $2,410 = $5,5004. Naman CompanyIncome StatementFor the Month Ended June 30, 20XXSales (1.5 ? $5,500) $8,250Cost of goods sold 5,500Gross margin $2,750Marketing and administrative expenses 1,200Operating income $1,5505–201. Overhead rate = $470,000/50,000 = $9.40 per MHr2. Department A: $250,000/40,000 = $6.25 per MHrDepartment B: $220,000/10,000 = $22.00 per MHr3. Job #73 Job #74Plantwide:70 ? $9.40 = $658 70 ? $9.40 = $658Departmental:20 ? $6.25 $ 125.00 50 ? $6.25 $ 312.5050 ? $22 1,100.00 20 ? $22 440.00$ 1,225.00 $ 752.50Department B appears to be more overhead intensive, so jobs spending more time in Department B ought to receive more overhead. Thus, departmental rates provide more accuracy.4. Plantwide rate: $250,000/40,000 = $6.25Department B: $62,500/10,000 = $6.25Job #73 Job #74Plantwide:70 ? $6.25 = $437.50 70 ? $6.25 = $437.50Departmental:20 ? $6.25 $ 125.00 50 ? $6.25 $ 312.5050 ? $6.25 312.50 20 ? $6.25 125.00$ 437.50 $ 437.50Assuming that machine hours is a good cost driver, the departmental rates reveal that overhead consumption is the same in each department. In this case, there is no need for departmental rates, and a plantwide rate is sufficient.5–41. Overhead rate = $470,000/50,000 = $9.40 per MHr2. Department A: $250,000/40,000 = $6.25 per MHrDepartment B: $220,000/10,000 = $22.00 per MHr3. Job #73 Job #74Plantwide:70 ? $9.40 = $658 70 ? $9.40 = $658Departmental:20 ? $6.25 $ 125.00 50 ? $6.25 $ 312.5050 ? $22 1,100.00 20 ? $22 440.00$ 1,225.00 $ 752.50Department B appears to be more overhead intensive, so jobs spending more time in Department B ought to receive more overhead. Thus, departmental rates provide more accuracy.4. Plantwide rate: $250,000/40,000 = $6.25Department B: $62,500/10,000 = $6.25Job #73 Job #74Plantwide:70 ? $6.25 = $437.50 70 ? $6.25 = $437.50Departmental:20 ? $6.25 $ 125.00 50 ? $6.25 $ 312.5050 ? $6.25 312.50 20 ? $6.25 125.00$ 437.50 $ 437.50Assuming that machine hours is a good cost driver, the departmental rates reveal that overhead consumption is the same in each department. In this case, there is no need for departmental rates, and a plantwide rate is sufficient.5–51. Last year’s unit-based overhead rate = $50,000/10,000 = $5This year’s unit-based overhead rate = $100,000/10,000 = $10Last Year This YearBike cost:2 ? $20 $ 40 $ 403 ? $12 36 36Overhead:5 ? $5 255 ? $10 50Total $101 $126Price last year = $101 ? 1.40 = $141.40/dayPrice this year = $126 ? 1.40 = $176.40/dayThis is a $35 increase over last year, nearly a 25 percent increase. No doubt the Carsons arenot pleased and would consider looking around for other recreational possibilities.2. Purchasing rate = $30,000/10,000 = $3 per purchase orderPower rate = $20,000/50,000 = $0.40 per kilowatt hourMaintenance rate = $6,000/600 = $10 per maintenance hourOther rate = $44,000/22,000 = $2 per DLHBike Rental Picnic CateringPurchasing$3 ? 7,000 $21,000$3 ? 3,000 $ 9,000Power$0.40 ? 5,000 2,000$0.40 ? 45,000 18,000Maintenance$10 ? 500 5,000$10 ? 100 1,000Other$2 ? 11,000 22,000 22,000Total overhead $50,000 $50,0003. This year’s bike rental overhead rate = $50,000/10,000 = $5Carson rental cost = (2 ? $20) + (3 ? $12) + (5 ? $5) = $101Price = 1.4 ? $101 = $141.40/day4. Catering rate = $50,000/11,000 = $4.55* per DLHCost of Estes job:Bike rental rate (2 ? $7.50) $15.00Bike conversion cost (2 ? $5.00) 10.00Catering materials 12.00Catering conversion (1 ? $4.55) 4.55Total cost $41.55*Rounded5. The use of ABC gives Mountain View Rentals a better idea of the types and costs of activities that are used in their business. Adding Level 4 bikes will increase the use of the most expensive activities, meaning that the rental rate will no longer be an average of $5 per rental day. Mountain View Rentals might need to set a Level 4 price based on the increased cost of both the bike and conversion cost.分步成本法6–11. Cutting Sewing PackagingDepartment Department DepartmentDirect materials $5,400 $ 900 $ 225Direct labor 150 1,800 900Applied overhead 750 3,600 900Transferred-in cost:From cutting 6,300From sewing 12,600Total manufacturing cost $6,300 $12,600 $14,6252. a. Work in Process—Sewing 6,300Work in Process—Cutting 6,300b. Work in Process—Packaging 12,600Work in Process—Sewing 12,600c. Finished Goods 14,625Work in Process—Packaging 14,625 3. Unit cost = $14,625/600 = $24.38* per pair6–21. Units transferred out: 27,000 + 33,000 – 16,200 = 43,8002. Units started and completed: 43,800 – 27,000 = 16,8003. Physical flow schedule:Units in beginning work in process 27,000Units started during the period 33,000Total units to account for 60,000Units started and completed 16,800Units completed from beginning work in process 27,000Units in ending work in process 16,200Total units accounted for 60,0004. Equivalent units of production:Materials ConversionUnits completed 43,800 43,800Add: Units in ending work in process:(16,200 ? 100%) 16,200(16,200 ? 25%) 4,050 Equivalent units of output 60,000 47,8506–31. Physical flow schedule:Units to account for:Units in beginning work in process 80,000Units started during the period 160,000Total units to account for 240,000Units accounted for:Units completed and transferred out:Started and completed 120,000From beginning work in process 80,000 200,000 Units in ending work in process 40,000Total units accounted for 240,0002. Units completed 200,000Add: Units in ending WIP ? Fraction complete(40,000 ? 20%) 8,000Equivalent units of output 208,0003. Unit cost = ($374,400 + $1,258,400)/208,000 = $7.854. Cost transferred out = 200,000 ? $7.85 = $1,570,000Cost of ending WIP = 8,000 ? $7.85 = $62,8005. Costs to account for:Beginning work in process $ 374,400Incurred during June 1,258,400Total costs to account for $ 1,632,800Costs accounted for:Goods transferred out $ 1,570,000Goods in ending work in process 62,800Total costs accounted for $ 1,632,8006–31、Units t0 account for:Units in beginning work in process(25% completed) 10000Units started during the period 70000 Total units to account for 80000 Units accounted forUnits completed and transferred outStarted and completed 50000From beginning work in process 10000 60000 Units in ending work in process(60% completed) 20000 Total units accounted for 80000 2、60000+20000×60%=72000(units)3、Unit cost for materials:($/unit)Unit cost for convension:($/unit)Total unit cost:5+1.13=6.13($/unit)4、The cost of units of transferred out:60000×6.13=367800($)The cost of units of ending work in process:20000×5+20000×20%×1.13=113560($)作业成本法4–21. Predetermined rates:Drilling Department: Rate = $600,000/280,000 = $2.14* per MHrAssembly Department: Rate = $392,000/200,000= $1.96 per DLH*Rounded2. Applied overhead:Drilling Department: $2.14 ? 288,000 = $616,320Assembly Department: $1.96 ? 196,000 = $384,160Overhead variances:Drilling Assembly TotalActual overhead $602,000 $ 412,000 $ 1,014,000Applied overhead 616,320 384,160 1,000,480Overhead variance $ (14,320) over $ 27,840 under $ 13,5203. Unit overhead cost = [($2.14 ? 4,000) + ($1.96 ? 1,600)]/8,000= $11,696/8,000= $1.46**Rounded4–31. Yes. Since direct materials and direct labor are directly traceable to each product, their cost assignment should be accurate.2. Elegant: (1.75 ? $9,000)/3,000 = $5.25 per briefcaseFina: (1.75 ? $3,000)/3,000 = $1.75 per briefcaseNote: Overhead rate = $21,000/$12,000 = $1.75 per direct labor dollar (or 175 percent of direct labor cost).There are more machine and setup costs assigned to Elegant than Fina. This is clearly a distortion because the production of Fina is automated and uses the machine resources much more than the handcrafted Elegant. In fact, the consumption ratio for machining is 0.10 and 0.90 (using machine hours as the measure of usage). Thus, Fina uses nine times the machining resources as Elegant. Setup costs are similarly distorted. The products use an equal number of setups hours. Yet, if direct labor dollars are used, then the Elegant briefcase receives three times more machining costs than the Fina briefcase.3. Overhead rate = $21,000/5,000= $4.20 per MHrElegant: ($4.20 ? 500)/3,000 = $0.70 per briefcaseFina: ($4.20 ? 4,500)/3,000 = $6.30 per briefcaseThis cost assignment appears more reasonable given the relative demands each product places on machine resources. However, once a firm moves to a multiproduct setting, using only one activity driver to assign costs will likely produce product cost distortions. Products tend to make different demands on overhead activities, and this should be reflected in overhead cost assignments. Usually, this means the use of both unit- and nonunit-level activity drivers. In this example, there is a unit-level activity (machining) and a nonunit-level activity (setting up equipment). The consumption ratios for each (using machine hours and setup hours as the activity drivers) are as follows:Elegant FinaMachining 0.10 0.90 (500/5,000 and 4,500/5,000)Setups 0.50 0.50 (100/200 and 100/200)Setup costs are not assigned accurately. Two activity rates are needed—one based on machine hours and the other on setup hours:Machine rate: $18,000/5,000 = $3.60 per MHrSetup rate: $3,000/200 = $15 per setup hourCosts assigned to each product:Machining: Elegant Fina$3.60 ? 500 $ 1,800$3.60 ? 4,500 $ 16,200Setups:$15 ? 100 1,500 1,500Total $ 3,300 $ 17,700Units ÷3,000 ÷3,000Unit overhead cost $ 1.10 $ 5.904:Elegant Unit overhead cost:[9000+3000+18000*500/5000+3000/2]/3000=$5.1 Fina Unit overhead cost:[3000+3000+18000*4500/5000+3000/2]/3000=$7.94–51. Deluxe Percent Regular PercentPrice $900 100% $750 100%Cost 576 64 600 80Unit gross profit $324 36% $150 20%Total gross profit:($324 ? 100,000) $32,400,000($150 ? 800,000) $120,000,0002. Calculation of unit overhead costs:Deluxe gularUnit-level:Machining:$200 ? 100,000 $20,000,000$200 ? 300,000 $60,000,000Batch-level:Setups:$3,000 ? 300 900,000$3,000 ? 200 600,000Packing:$20 ? 100,000 2,000,000$20 ? 400,000 8,000,000Product-level:Engineering:$40 ? 50,000 2,000,000$40 ? 100,000 4,000,000Facility-level:Providing space:$1 ? 200,000 200,000$1 ? 800,000 800,000Total overhead $25,100,000 $73,400,000Units ÷100,000 ÷800,000Overhead per unit $251 $91.75Deluxe Percent Regular PercentPrice $900 100% $750.00 100%Cost 780* 87*** 574.50** 77***Unit gross profit $120 13%*** $175.50 23%***Total gross profit:($120 ? 100,000) $12,000,000($175.50 ? 800,000) $140,400,000*$529 + $251**$482.75 + $91.753. Using activity-based costing, a much different picture of the deluxe and regular products emerges. The regular model appears to be more profitable. Perhaps it should be emphasized.4–61. JIT Non-JITSalesa $12,500,000 $12,500,000Allocationb 750,000 750,000a$125 ? 100,000, where $125 = $100 + ($100 ? 0.25), and 100,000 is the average order size times the number of ordersb0.50 ? $1,500,0002. Activity rates:Ordering rate = $880,000/220 = $4,000 per sales orderSelling rate = $320,000/40 = $8,000 per sales callService rate = $300,000/150 = $2,000 per service callJIT Non-JITOrdering costs:$4,000 ? 200 $ 800,000$4,000 ? 20 $ 80,000Selling costs:$8,000 ? 20 160,000$8,000 ? 20 160,000Service costs:$2,000 ? 100 200,000$2,000 ? 50 100,000Total $1,160,000 $340,0 0For the non-JIT customers, the customer costs amount to $750,000/20 = $37,500 per order under the original allocation. Using activity assign?ments, this drops to $340,000/20 = $17,000 per order, a difference of $20,500 per order. For an order of 5,000 units, the order price can be decreased by $4.10 per unit without affecting customer profitability. Overall profitability will decrease, however, unless the price for orders is increased to JIT customers.3. It sounds like the JIT buyers are switching their inventory carrying costs to Emery without any significant benefit to Emery. Emery needs to increase prices to reflect the additional demands on customer-support activities. Furthermore, additional price increases may be needed to reflectthe increased number of setups, purchases, and so on, that are likely occurring inside the plant. Emery should also immediately initiate discussions with its JIT customers to begin negotiations for achieving some of the benefits that a JIT supplier should have, such as long-term contracts. The benefits of long-term contracting may offset most or all of the increased costs from the additional demands made on other activities.4–71. Supplier cost:First, calculate the activity rates for assigning costs to suppliers:Inspecting components: $240,000/2,000 = $120 per sampling hourReworking products: $760,500/1,500 = $507 per rework hourWarranty work: $4,800/8,000 = $600 per warranty hourNext, calculate the cost per component by supplier:Supplier cost:Vance FoyPurchase cost:$23.50 ? 400,000 $ 9,400,000$21.50 ? 1,600,000 $ 34,400,000Inspecting components:$120 ? 40 4,800$120 ? 1,960 235,200Reworking products:$507 ? 90 45,630$507 ? 1,410 714,870Warranty work:$600 ? 400 240,000$600 ? 7,600 4,560,000Total supplier cost $ 9,690,430 $ 39,910,070Units supplied ÷400,000 ÷1,600,000Unit cost $ 24.23* $ 24.94**RoundedThe difference is in favor of Vance; however, when the price concession is considered, the cost of Vance is $23.23, which is less than Foy’s component. Lumus should accept the contractual offer made by Vance.4–7 Concluded2. Warranty hours would act as the best driver of the three choices. Using this driver, the rate is $1,000,000/8,000 = $125 per warranty hour. The cost assigned to each component would be:Vance FoyLost sales:$125 ? 400 $ 50,000$125 ? 7,600 $ 950,000$ 50,000 $ 950,000Units supplied ÷400,000 ÷1,600,000Increase in unit cost $ 0.13* $ 0.59**Rounded$0.075 per unitCategory II: $45/1,000 = $0.045 per unitCategory III: $45/1,500 = $0.03 per unitCategory I, which has the smallest batches, is the most undercosted of the three categories. Furthermore, the unit ordering cost is quite high relative to Category I’s selling price (9 to 15 percent of the selling price). This suggests that something should be done to reduce the order-filling costs.3. With the pricing incentive feature, the average order size has been increased to 2,000 units for all three product families. The number of orders now processed can be calculated as follows:Orders = [(600 ? 50,000) + (1,000 ? 30,000) + (1,500 ? 20,000)]/2,000= 45,000Reduction in orders = 100,000 – 45,000 = 55,000Steps that can be reduced = 55,000/2,000 = 27 (rounding down to nearest whole number)There were initially 50 steps: 100,000/2,000Reduction in resource spending:Step-fixed costs: $50,000 ? 27 = $1,350,000Variable activity costs: $20 ? 55,000 = 1,100,000$2,450,000预算9-4Norton, Inc.Sales Budget For the Coming YearModel Units Price Total SalesLB-1 50,400 $29.00 $1,461,600LB-2 19,800 15.00 297,000WE-6 25,200 10.40 262,080 WE-7 17,820 10.00 178,200 WE-8 9,600 22.00 211,200 WE-9 4,000 26.00 104,000 Total $2,514,080二、1. Raylene’s Flowers and GiftsProduction Budget for Gift BasketsFor September, October, November, and DecemberSept. Oct. Nov. D ec.Sales 200 150 180 250Desired ending inventory 15 18 25 10Total needs 215 168 205 260Less: Beginning inventory 20 15 18 25 Units produced 195 153 187 2352. Raylene’s Flowers and GiftsDirect Materials Purchases BudgetFor September, October, and NovemberFruit: Sept. Oct. Nov.Production 195 153 187? Amount/basket (lbs.) ? 1 ? 1 ?1Needed for production 195 153 187Desired ending inventory 8 9 12Needed 203 162 200Less: Beginning inventory 10 8 9Purchases193 154 190Small gifts: Sept. Oct. Nov.Production 195 153 187 ? Amount/basket (items) ? 5 ? 5 ? 5Needed for production 975 765 935Desired ending inventory 383 468 588Needed 1,358 1,233 1,523Less: Beginning inventory 488 383 468Purchases 870 850 1,055Cellophane: Sept. Oct. Nov.Production 195 153 187。
管理会计2到6章习题和答案
简述:管理会计与财务会计的区别与联系区别:一是职能不同,管理会计侧重于对未来的预测决策规划是管理型会计,财务会计侧重于和酸碱度是报账会计。
二是服务对象不同,管是对内报告会计,财是对外报告会计。
三是约束条件不同,管不受制度的制约有很大的灵活性,财反之。
四报告期间不同。
管不受固定会计期间的限制,才按月季年编制报告。
五是会计主体不同,管是多层次的,财反映整个企业财务状况经营成果资金变动。
六计算方法不同,管运用现代数学方法,财简单的数学方法。
七信息精确程度不同,管一般只能相对精确,财数字必须精确。
八计量尺度不同,管用货币量度和费货币量度,财几乎是货币量度。
联系:一起源相同都是在传统会计中发展完善的,二目标相同获得最大利润提高经济效益。
三基本信息同源来自于财务会计资料。
四服务对象交叉。
五某些概念相同4、成本分解案例答:该化工厂在对总成本进行分析时,把明显属于变动成本或固定成本的项目剔除掉,其余作为半变动成本,用一定的方法进行分解,这样做存在以下几个问题:第一,从半变动成本结构来看,许多费用都不是线性的,如修理费用,四月份产量最高,但费用较低。
第二,下脚料不能作为半变动成本处理。
第三,把大部分近似变动成本和近似固定成本都已经分别归入变动成本和固定成本,剩下的少数费用性质比较复杂,而且有些费用发生没有规律,这部分费用一般难以用公式单独分解。
否则,矛盾就比较突出,如案例计算出来的结果就很不合理。
根据案例的情况,可以有以下几种处理方案:第一,全部费用除了以划分为变动成本、固定成本,剩下的这些半变动成本再照性质直接划分为变动成本和固定成本。
本案例中,修理、动力和水费可归入变动成本,管理费用和制造费用归属于固定成本,下脚料单独列示。
这种方法虽然不够准确,但便于费用控制。
第二,总成本作为半变动成本,按高低点发分解:单位变动成本为0.12万元,固定成本为6.463万元。
计算各月变动成本和固定成本,如表2—14所示。
月份变动成本固定成本合计1 51.658 6.975 58.6332 51.422 6.342 57.7643 49.347 6.397 55.7444 56.92 6.399 63.3195 55.456 6.191 61.656从各月的计算结果来看。
《管理会计》第1--6章习题答案
(1)单价=15/30%=50(元)
(2)销售量=63000/15=4200
固定成本=(50-15)×4200-18000=129000(元)
(3)2004年的保本额=129000/70%≈184285.71(元)
(4)保利量=(129000+98500)/35=6500(件)
(5)安全边际额=50×4200×(1+8%)-184285.71=42514.29(元)
三、判断题
1.×2.×3.√4.√5.×6.√7.×8.√9.×10.×11.×12.×13.×14.√15.×16.√
五、计算题
1.解:
高点(2100,80000),低点(1000,62000)
b= (80000-62000)/(2100-1000)=16.36364
a=62000-16.36364×1000=45636.36
成本无差别点业务量=(12000-0)÷(8-5)=4000件
X<4000件,应外购
4000件≤X<5000件,应自制
(2)X≥5000件
假设自制的固定成本为a1=12000元,单位变动成本为b1=5元
外购的固定成本为a2=0元,单位变动成本为b2=7元
因为a1>a2;b1<b2
所以符合应用成本无差别点法进行决策的条件
13000
17000
10648.74
损益表(变动成本法)
2003
2004
销售收入
销售产品的制造成本
变动性销售与行政管理费
贡献边际
固定成本
固定性制造费用
销售与行政管理费
合计
营业利润
70000
16800
3500