matlab经典编程例题
MATLAB编程练习(含答案很好的)
001双峰曲线图:z=peaks(40);mesh(z);surf(z)002解方程:A=[3,4,-2;6,2,-3;45,5,4];>> B=[14;4;23];>> root=inv(A)*B003傅里叶变换load mtlb ;subplot(2,1,1);plot(mtlb);>> title('原始语音信息');>> y=fft(mtlb);>> subplot(2,1,2);>> yy=abs(y);>> plot(yy);>> title('傅里叶变换')004输入函数:a=input('How many apples\n','s')005输出函数a=[1 2 3 4 ;5 6 7 8;12 23 34 45;34 435 23 34]a =1 2 3 45 6 7 812 23 34 4534 435 23 34disp(a)a =1 2 3 45 6 7 812 23 34 4534 435 23 34b=input('how many people\n' ,'s')how many peopletwo peopleb =two people>> disp(b)two people>>006求一元二次方程的根a=1;b=2;c=3;d=sqrt(b^2-4*a*c);x1=(-b+d)/(2*a)x1 =-1.0000 + 1.4142i>> x2=(-b-d)/(2*a)x2 =-1.0000 - 1.4142i007求矩阵的相乘、转置、存盘、读入数据A=[1 3 5 ;2 4 6;-1 0 -2;-3 0 0];>> B=[-1 3;-2 2;2 1];>> C=A*BC =3 142 20-3 -53 -9>> C=C'C =3 2 -3 314 20 -5 -9>> save mydat C>> clear>> load mydat C008编写数学计算公式:A=2.1;B=-4.5;C=6;D=3.5;E=-5;K=atan(((2*pi*A)+E/(2*pi*B*C))/D) K =1.3121009A=[1 0 -1;2 4 1;-2 0 5];>> B=[0 -1 0;2 1 3;1 1 2];>> H=2*A+BH =2 -1 -26 9 5-3 1 12>> M=A^2-3*BM =3 3 -62 13 -2-15 -3 21>> Y=A*BY =-1 -2 -29 3 145 7 10>> R=B*AR =-2 -4 -1-2 4 14-1 4 10>> E=A.*BE =0 0 04 4 3-2 0 10>> W=A\BW =0.3333 -1.3333 0.66670.2500 1.0000 0.25000.3333 -0.3333 0.6667 >> P=A/BP =-2.0000 3.0000 -5.0000-5.0000 3.0000 -4.00007.0000 -9.0000 16.0000>> Z=A.\BWarning: Divide by zero.Z =0 -Inf 01.0000 0.2500 3.0000-0.5000 Inf 0.4000>> D=A./BWarning: Divide by zero.D =Inf 0 -Inf1.0000 4.0000 0.3333-2.0000 0 2.5000010a=4.96;b=8.11;>> M=exp(a+b)/log10(a+b)M =4.2507e+005011求三角形面积:a=9.6;b=13.7;c=19.4;>> s=(a+b+c)/2;>> area=sqrt(s*(s-a)*(s-b)*(s-c))area =61.1739012逻辑运算A=[-1 0 -6 8;-9 4 0 12.3;0 0 -5.1 -2;0 -23 0 -7]; >> B=A(:,1:2)B =-1 0-9 40 00 -23>> C=A(1:2,:)C =-1.0000 0 -6.0000 8.0000 -9.0000 4.0000 0 12.3000>> D=B'D =-1 -9 0 00 4 0 -23>> A*Bans =1.0000 -184.0000-27.0000 -266.90000 46.0000 207.0000 69.0000>> C<Dans =0 0 1 01 0 0 0>> C&Dans =1 0 0 00 1 0 1>> C|Dans =1 1 1 11 1 0 1>> ~C|~Dans =0 1 1 11 0 1 0013矩阵运算练习:A=[8 9 5;36 -7 11;21 -8 5]A =8 9 536 -7 1121 -8 5>> BB =-1 3 -22 0 3-3 1 9>> RT=A*BRT =-5 29 56-83 119 6-52 68 -21>> QW=A.*BQW =-8 27 -1072 0 33-63 -8 45>> ER=A^3ER =6272 3342 294415714 -856 52608142 -1906 2390 >> BF=A.^3BF =512 729 12546656 -343 13319261 -512 125 >> A/Bans =3.13414.9634 -0.4024-1.2561 12.5244 -3.2317-1.9878 6.4512 -2.0366>> EKV=B\AEKV =10.7195 -1.2683 3.52449.4756 1.5854 3.71954.8537 -1.4878 1.3171>> KDK=[A,B]KDK =8 9 5 -1 3 -236 -7 11 2 0 321 -8 5 -3 1 9 >> ERI=[A;B]ERI =8 9 536 -7 1121 -8 5-1 3 -22 0 3-3 1 9014一般函数的调用:A=[2 34 88 390 848 939];>> S=sum(A)S =2301>> min(A)ans =2>> EE=mean(A)EE =383.5000>> QQ=std(A)QQ =419.3794>> AO=sort(A)AO =2 34 88 390 848 939 >> yr=norm(A)yr =1.3273e+003>> RT=prod(A)RT =1.8583e+012>> gradient(A)ans =32.0000 43.0000 178.0000 380.0000 274.5000 91.0000 >> max(A)ans =939>> median(A)ans =239>> diff(A)ans =32 54 302 458 91>> length(A)ans =6>> sum(A)ans =2301>> cov(A)ans =1.7588e+005>>015矩阵变换:A=[34 44 23;8 34 23;34 55 2]A =34 44 238 34 2334 55 2>> tril(A)ans =34 0 08 34 034 55 2>> triu(A)ans =34 44 230 34 230 0 2>> diag(A)ans =34342norm(A)ans =94.5106>> rank(A)ans =3>> det(A)ans =-23462>> trace(A)ans =70>> null(A)ans =Empty matrix: 3-by-0>> eig(A)ans =80.158712.7671-22.9257>> poly(A)ans =1.0e+004 *0.0001 -0.0070 -0.1107 2.3462>> logm(A)Warning: Principal matrix logarithm is not defined for A with nonpositive real eigenvalues. A non-principal matrixlogarithm is returned.> In funm at 153In logm at 27ans =3.1909 + 0.1314i 1.2707 + 0.1437i 0.5011 - 0.2538i0.4648 + 0.4974i 3.3955 + 0.5438i 0.1504 - 0.9608i0.2935 - 1.2769i 0.8069 - 1.3960i 3.4768 + 2.4663i>> fumn(A)Undefined command/function 'fumn'.>> inv(A)ans =0.0510 -0.0502 -0.0098-0.0326 0.0304 0.02550.0305 0.0159 -0.0343>> cond(A)ans =8.5072>> chol(A)Error using ==> cholMatrix must be positive definite.>> lu(A)ans =34.0000 44.0000 23.00000.2353 23.6471 17.58821.0000 0.4652 -29.1816>> pinv(A)ans =0.0510 -0.0502 -0.0098-0.0326 0.0304 0.02550.0305 0.0159 -0.0343>> svd(A)ans =94.510622.345611.1095>> expm(A)ans =1.0e+034 *2.1897 4.3968 1.93821.31542.6412 1.16431.8782 3.7712 1.6625>> sqrtm(A)ans =5.2379 + 0.2003i 3.4795 + 0.2190i 1.8946 - 0.3869i0.5241 + 0.7581i 5.1429 + 0.8288i 2.0575 - 1.4644i3.0084 - 1.9461i4.7123 - 2.1276i 2.1454 + 3.7589i >>016多项式的计算:A=[34 44 23;8 34 23;34 55 2]A =34 44 238 34 2334 55 2>> P=poly(A)P =1.0e+004 *0.0001 -0.0070 -0.1107 2.3462>> PPA=poly2str(P,'X')PPA =X^3 - 70 X^2 - 1107 X + 23462017多项式的运算:p=[2 6 8 3];w=[32 56 0 2];>> m=conv(p,w)m =64 304 592 548 180 16 6 >> [q,r]=deconv(w,p)q =16r =0 -40 -128 -46>> dp=polyder(w)dp =96 112 0>> [num,den]=polyder(w,p)num =80 512 724 312 -16den =4 24 68 108 100 48 9>> b=polyfit(p,w,4)Warning: Polynomial is not unique; degree >= number of data points. > In polyfit at 74b =-0.6704 9.2037 -32.2593 0 98.1333>> r=roots(p)r =-1.2119 + 1.0652i-1.2119 - 1.0652i-0.5761018求多项式的商和余p=conv([1 0 2],conv([1 4],[1 1]))p =1 5 6 10 8>> q=[1 0 1 1]q =1 0 1 1>> [w,m]=deconv(p,q)w =1 5m =0 0 5 4 3>> cq=w;cr=m;>> disp([cr,poly2str(m,'x')])5 x^2 + 4 x + 3>> disp([cq,poly2str(w,'x')])x + 5019将分式分解a=[1 5 6];b=[1];>> [r,p,k]=residue(b,a)r =-1.00001.0000p =-3.0000-2.0000k =[]020计算多项式:a=[1 2 3;4 5 6;7 8 9];>> p=[3 0 2 3];>> q=[2 3];>> x=2;>> r=roots(p)r =0.3911 + 1.0609i0.3911 - 1.0609i-0.7822>> p1=conv(p,q)p1 =6 9 4 12 9>> p2=poly(a)p2 =1.0000 -15.0000 -18.0000 -0.0000 >> p3=polyder(p)p3 =9 0 2>> p4=polyval(p,x)p4 =31021求除式和余项:[q,r]=deconv(conv([1 0 2],[1 4]),[1 1 1])022字符串的书写格式:s='student's =student>> name='mary';>> s1=[name s]s1 =marystudent>> s3=[name blanks(3);s]s3 =marystudent>>023交换两个数:clearclca=[1 2 3 4 5];b=[6 7 8 9 10];c=a;a=b;b=c;ab24If语句n=input('enter a number,n=');if n<10nend025 if 双分支结构a=input('enter a number ,a=');b=input('enter a number ,b=');if a>bmax=a;elsemax=b;endmax026三个数按照由大到小的顺序排列:A=15;B=24;C=45;if A<BT=A;A=B;B=T;elseif A<CT=A;A=C;C=T;elseif B<CT=B;B=C;C=T;endABC027建立一个收费优惠系统:price=input('please jinput the price : price=') switch fix(price/100)case[0,1]rate =0;case[2,3,4]rate =3/100;case num2cell(5:9)rate=5/100;case num2cell(10:24)rate=8/100;case num2cell(25:49)rate=10/100;otherwiserate=14/100;endprice=price*(1-rate)028:while循环语句i=0;s=0;while i<=1212s=s+i;i=i+1;ends029,用for循环体语句:sum=0;for i=1:1.5:100;sum=sum+i;endsum030循环的嵌套s=0;for i=1:1:6;for j=1:1:8;s=s+i^j;end;end;s031continue 语句的使用:for i=100:120;if rem(i,7)~=0;continue;end;iend032x=input ('输入X的值x=')if x<1y=x^2;elseif x>1&x<2y=x^2-1;elsey=x^2-2*x+1;endy033求阶乘的累加和sum=0;temp=1;for n=1:10;temp=temp*n;sum=sum+temp;endsum034对角线元素之和sum=0;a=[1 2 3 4;5 6 7 8;9 10 11 12;13 14 15 16]; for i=1:4;sum=sum+a(i,i);endsum035用拟合点绘图A=[12 15.3 16 18 25];B=[50 80 118 125 150.8];plot(A,B)036绘制正玄曲线:x=0:0.05:4*pi;y=sin(x);plot(x,y)037绘制向量x=[1 2 3 4 5 6;7 8 9 10 11 12;13 14 15 16 17 18] plot(x)x=[0 0.2 0.5 0.7 0.6 0.7 1.2 1.5 1.6 1.9 2.3]plot(x)x=0:0.2:2*piy=sin(x)plot(x,y,'m:p')038在正弦函数上加标注:t=0:0.05:2*pi;plot(t,sin(t))set(gca,'xtick',[0 1.4 3.14 56.28])xlabel('t(deg)')ylabel('magnitude(v)')title('this is a example ()\rightarrow 2\pi')text(3.14,sin(3.14),'\leftarrow this zero for\pi')039添加线条标注x=0:0.2:12;plot(x,sin(x),'-',x,1.5*cos(x),':');legend('First','Second',1)040使用hold on 函数x=0:0.2:12;plot(x,sin(x),'-');hold onplot(x,1.5*cos(x),':');041一界面多幅图x=0:0.05:7;y1=sin(x);y2=1.5*cos(x);y3=sin(2*x);y4=5*cos(2*x);subplot(221);plot(x,y1);title('sin(x)')subplot(222);plot(x,y2);title('cos(x)')subplot(223);plot(x,y3);title('sin(2x)')subplot(224);plot(x,y4);title('cos(2x)')042染色效果图x=0:0.05:7;y1=sin(x);y2=1.5*cos(x);y3=sin(2*x);y4=5*cos(2*x);subplot(221);plot(x,y1);title('sin(x)');fill(x,y1,'r') subplot(222);plot(x,y2);title('cos(x)');fill(x,y2,'b') subplot(223);plot(x,y3);title('sin(2x)');fill(x,y3,'k') subplot(224);plot(x,y4);title('cos(2x)');fill(x,y4,'g')043特殊坐标图clcy=[0,0.55,2.5,6.1,8.5,12.1,14.6,17,20,22,22.1] subplot(221);plot(y);title('线性坐标图');subplot(222);semilogx(y);title('x轴对数坐标图');subplot(223);semilogx(y);title('y轴对数坐标图');subplot(224);loglog(y);title('双对数坐标图')t=0:0.01:2*pi;r=2*cos(2*(t-pi/8));polar(t,r)044特殊函数绘图:fplot('cos(tan(pi*x))',[-0.4,1.4])fplot('sin(exp(pi*x))',[-0.4,1.4])045饼形图与条形图:x=[8 20 36 24 12];subplot(221);pie(x,[1 0 0 0 1]);title('饼图');subplot(222);bar(x,'group');title('垂直条形图');subplot(223);bar(x,'stack');title('累加值为纵坐标的垂直条形图'); subplot(224);barh(x,'group');title('水平条形图');046梯形图与正弦函数x=0:0.1:10;y=sin(x);subplot(121);stairs(x);subplot(122);stairs(x,y);047概率图x=randn(1,1000);y=-2:0.1:2;hist(x,y)048向量图:x=[-2+3j,3+4j,1-7j];subplot(121);compass(x);rea=[-2 3 1];imag=[3 4 -7];subplot(122);feather(rea,imag);049绘制三维曲线图:z=0:pi/50:10*pi;x=sin(z);y=cos(z);plot3(x,y,z)x=-10:0.5:10;y=-8:0.5:8;[x,y]=meshgrid(x,y);z=sin(sqrt(x.^2+y.^2))./sqrt(x.^2+y.^2); subplot(221);mesh(x,y,z);title('普通一维网格曲面');subplot(222);meshc(x,y,z);title('带等高线的三维网格曲面'); subplot(223);meshz(x,y,z);title('带底座的三维网格曲面'); subplot(224);surf(x,y,z);title('充填颜色的三维网格面')050 带网格二维图x=0:pi/10:2*pi;y1=sin(x);y2=cos(x);plot(x,y1,'r+-',x,y2,'k*:')grid onxlabel('Independent Variable x') ylabel('Dependent Variable y1&y2') text(1.5,0.5,'cos(x)')051各种统计图y=[18 5 28 17;24 12 36 14;15 6 30 9]; subplot(221);bar(y)x=[4,6,8];subplot(222);bar3(x,y)subplot(223);bar(x,y,'grouped') subplot(224);bar(x,y,'stack')052曲面图x=-2:0.4:2;y=-1:0.2:1;[x,y]=meshgrid(x,y);z=sqrt(4-x.^2/9-y.^2/4); surf(x,y,z)grid on053创建符号矩阵e=[1 3 5;2 4 6;7 9 11];m=sym(e)符号表达式的计算问题因式分解:syms xf=factor(x^3-1)s=sym('sin(a+b)'); expand(s)syms x tf=x*(x*(x-8)+6)*t; collect(f)syms xf=sin(x)^2+cos(x)^2; simplify(f)syms xs=(4*x^2+8*x+3)/(2*x+1); simplify(s)通分syms x yf=x/y-y/x;[m,n]=numden(f)嵌套重写syms xf=x^4+3*x^3-7*x^2+12; horner(f)054求极限syms x a;limit(exp(-x),x,0,'left')求导数syms xdiff(x^9+x^6)diff(x^9+x^6,4)055求不定积分与定积分syms x ys=(4-3*x^2)^2;int(s)int(x/(x+y),x)int(x^2/(x+2),x,1,3) double(ans)056函数的变换:syms x ty=exp(-x^2);Ft=fourier(y,x,t)fx=ifourier(Ft,t,x)057求解方程syms a b c xs=a*x^2+b*x+c;solve(s)syms x y zs1=2*x^2+y^2-3*z-4;s2=y+z-3;s3=x-2*y-3*z;[x,y,z]=solve(s1,s2,s3)058求微分方程:y=dsolve('Dy-(t^2+y^2)/t^2/2','t')059求级数和syms x ksymsum(k)symsum(k^2-3,0,10)symsum(x^k/k,k,1,inf)060泰勒展开式syms xs=(1-x+x^2)/(1+x+x^2);taylor(s)taylor(s,9)taylor(s,x,12)taylor(s,x,12,5)061练习syms x a;s1=sin(2*x)/sin(5*x);limit(s1,x,0)s2=(1+1/x)^(2*x);limit(s2,x,inf)syms xs=x*cos(x);diff(s)diff(s,2)diff(s,12)syms xs1=x^4/(1+x^2);int(s1)s2=3*x^2-x+1int(s2,0,2)syms x y zs1=5*x+6*y+7*z-16;s2=4*x-5*y+z-7;s3=x+y+2*z-2;[x,y,z]=solve(s1,s2,s3)syms x yy=dsolve('Dy=exp(2*x-y)','x')y=dsolve('Dy=exp(2*x-y)','y(0)=0','x')n=sym('n');s=symsum(1/n^2,n,1,inf)x=sym('x');f=sqrt(1-2*x+x^3)-(1-3*x+x^2)^(1/3);taylor(f,6)062求于矩阵相关的值a=[2 2 -1 1;4 3 -1 2;8 5 -3 4;3 3 -2 2]adet=det(a)atrace=trace(a)anorm=norm(a)acond=cond(a)arank=rank(a)eiga=eig(a)063矩阵计算A=[0.1389 0.6038 0.0153 0.9318;0.2028 0.2772 0.7468 0.4660;0.1987 0.1988 0.4451 0.4186]B=var(A)C=std(A)D=range(A)E=cov(A)F=corrcoef(A)064求根及求代数式的值P=[4 -3 2 5];x=roots(P)x=[3 3.6];F=polyval(P,x)065多项式的和差积商运算:f=[1 2 -4 3 -1]g=[1 0 1]g1=[0 0 1 0 1]f+g1f-g1conv(f,g)[q,r]=deconv(f,g)polyder(f)066各种插值运算:X=0:0.1:pi/2;Y=sin(X);interp1(X,Y,pi/4)interp1(X,Y,pi/4,'nearest')interp1(X,Y,pi/4,'spline')interp1(X,Y,pi/4,'cubic')067曲线的拟合:X=0:0.1:2*pi;Y=cos(X);[p,s]=polyfit(X,Y,4)plot(X,Y,'K*',X,polyval(p,X),'r-')068求函数的最值与0点x=2:0.1:2;[x,y]=fminbnd('x.^3-2*x+1',-1,1) [x,y]=fzero('x.^3-2*x+1',1)069求多项式的表达式、值、及图像y=[1 3 5 7 19]t=poly(y)x=-4:0.5:8yx=polyval(t,x)plot(x,yx)070数据的拟合与绘图x=0:0.1:2*pi;y=sin(x);p=polyfit(x,y,5);y1=polyval(p,x)plot(x,y,'b',x,y1,'r')071求代数式的极限:syms xf=sym('log(1+2*x)/sin(3*x)');b=limit(f,x,0)072求导数与微分syms xf=sym('x/(cos(x))^2');y1=diff(f)y2=int(f,0,1)078划分网格函数[x,y]=meshgrid(-2:0.01:2,-3:0.01:5); t=x.*exp(-x.^2-y.^2);[px,py]=gradient(t,0.05,0.1);td=sqrt(px.^2+py.^2);subplot(221)imagesc(t)subplot(222)imagesc(td)colormap('gray')079求多次多项方程组的解:syms x1 x2 a ;eq1=sym('x1^2+x2=a')eq2=sym('x1-a*x2=0')[x1 x2]=solve(eq1,eq2,x1,x2)v=solve(eq1,eq2)v.x1v.x2an1=x1(1),an2=x1(2)an3=x2(1),an4=x2(2)080求解微分方程:[y]=dsolve('Dy=-y^2+6*y','y(0)=1','x')s=dsolve('Dy=-y^2+6*y','y(0)=1','x')[u]=dsolve('Du=-u^2+6*u','u(0)=1')w=dsolve('Du=-u^2+6*u','z')[u,w]=dsolve('Du=-w^2+6*w,Dw=sin(z)','u(0)=1,w(0)=0','z') v=dsolve('Du=-w^2+6*w,Dw=sin(z)','u(0)=1,w(0)=0','z')081各种显现隐含函数绘图:f=sym('x^2+1')subplot(221)ezplot(f,[-2,2])subplot(222)ezplot('y^2-x^6-1',[-2,2],[0,10])x=sym('cos(t)')y=sym('sin(t)')subplot(223)ezplot(x,y)z=sym('t^2')subplot(224)ezplot3(x,y,z,[0,8*pi])082极坐标图:r=sym('4*sin(3*x)')ezpolar(r,[0,6*pi])083多函数在一个坐标系内:x=0:0.1:8;y1=sin(x);subplot(221)plot(x,y1)subplot(222)plot(x,y1,x,y2)w=[2 3;3 1;4 6]subplot(223)plot(w)q=[4 6:3 5:1 2]subplot(224)plot(w,q)084调整刻度图像:x=0:0.1:10;y1=sin(x);y2=exp(x);y3=exp(x).*sin(x);subplot(221)plot(x,y2)subplot(222)loglog(x,y2)subplot(223)plotyy(x,y1,x,y2)085等高线等图形,三维图:t=0:pi/50:10*pi;subplot(2,3,1)plot3(t.*sin(t),t.*cos(t),t.^2) grid on[x,y]=meshgrid([-2:0.1:2])z=x.*exp(-x.^2-y.^2)subplot(2,3,2)plot3(x,y,z)box offsubplot(2,3,3)meshz(x,y,z)subplot(2,3,4)surf(x,y,z)contour(x,y,z)subplot(2,3,6)surf(x,y,z)subplot(2,3,5)contour(x,y,z)box offsubplot(2,3,6)contour3(x,y,z)axis off086统计图Y=[5 2 1;8 7 3;9 8 6;5 5 5;4 3 2]subplot(221)bar(Y)box offsubplot(222)bar3(Y)subplot(223)barh(Y)subplot(224)bar3h(Y)087面积图Y=[5 1 2;8 3 7;9 6 8;5 5 5;4 2 3];subplot(221)area(Y)grid onset(gca,'Layer','top','XTick',1:5)sales=[51.6 82.4 90.8 59.1 47.0];x=90:94;profits=[19.3 34.2 61.4 50.5 29.4];subplot(222)area(x,sales,'facecolor',[0.5 0.9 0.6], 'edgecolor','b','linewidth',2) hold onarea(x,profits,'facecolor',[0.9 0.85 0.7], 'edgecolor','y','linewidth',2) hold offset(gca,'Xtick',[90:94])set(gca,'layer','top')gtext('\leftarrow 销售量') gtext('利润')gtext('费用')xlabel('年','fontsize',14)088函数的插值:x=0:2*pi;y=sin(x);xi=0:0.1:8;yi1=interp1(x,y,xi,'linear')yi2=interp1(x,y,xi,'nearest') yi3=interp1(x,y,xi,'spline')yi4=interp1(x,y,xi,'cublic')p=polyfit(x,y,3)yy=polyval(p,xi)subplot(3,2,1)plot(x,y,'o')subplot(3,2,2)plot(x,y,'o',xi,yy)subplot(3,2,3)plot(x,y,'o',xi,yi1)subplot(3,2,4)plot(x,y,'o',xi,yi2)subplot(3,2,5)plot(x,y,'o',xi,yi3)subplot(3,2,6)plot(x,y,'o',xi,yi4)089二维插值计算:[x,y]=meshgrid(-3:0.5:3);z=peaks(x,y);[xi,yi]=meshgrid(-3:0.1:3); zi=interp2(x,y,z,xi,yi,'spline') plot3(x,y,z)hold onmesh(xi,yi,zi+15)hold offaxis tight090函数表达式;function f=exlin(x)if x<0f=-1;elseif x<1f=x;elseif x<2f=2-x;elsef=0;end091:硬循环语句:n=5;for i=1:nfor j=1:nif i==ja(i,j)=2;elsea(i,j)=0;endendendwhile 循环语句:n=1;while prod(1:n)<99^99;n=n+1endn:092 switch开关语句a=input('a=?')switch acase 1disp('It is raning') case 0disp('It do not know')case -1disp('It is not ranging')otherwisedisp('It is raning ?')end093画曲面函数:x1=linspace(-3,3,30)y1=linspace(-3,13,34)[x,y]=meshgrid(x1,y1);z=x.^4+3*x.^2-2*x+6-2*y.*x.^2+y.^2-2*y; surf(x,y,z)。
matlab编程实例100例
1-32是:图形应用篇33-66是:界面设计篇67-84是:图形处理篇85-100是:数值分析篇实例1:三角函数曲线(1)function shili01h0=figure('toolbar','none',...'position',[198 56 350 300],...'name','实例01');h1=axes('parent',h0,...'visible','off');x=-pi:0.05:pi;y=sin(x);plot(x,y);xlabel('自变量X');ylabel('函数值Y');title('SIN( )函数曲线');grid on实例2:三角函数曲线(2)function shili02h0=figure('toolbar','none',...'position',[200 150 450 350],...'name','实例02');x=-pi:0.05:pi;y=sin(x)+cos(x);plot(x,y,'-*r','linewidth',1);grid onxlabel('自变量X');ylabel('函数值Y');title('三角函数');实例3:图形的叠加function shili03h0=figure('toolbar','none',...'position',[200 150 450 350],...'name','实例03');x=-pi:0.05:pi;y1=sin(x);y2=cos(x);plot(x,y1,...'-*r',...x,y2,...'--og');grid onxlabel('自变量X');ylabel('函数值Y');title('三角函数');实例4:双y轴图形的绘制function shili04h0=figure('toolbar','none',...'position',[200 150 450 250],...'name','实例04');x=0:900;a=1000;b=0.005;y1=2*x;y2=cos(b*x);[haxes,hline1,hline2]=plotyy(x,y1,x,y2,'semilogy','plot'); axes(haxes(1))ylabel('semilog plot');axes(haxes(2))ylabel('linear plot');实例5:单个轴窗口显示多个图形function shili05h0=figure('toolbar','none',...'position',[200 150 450 250],...'name','实例05');t=0:pi/10:2*pi;[x,y]=meshgrid(t);subplot(2,2,1)plot(sin(t),cos(t))axis equalsubplot(2,2,2)z=sin(x)-cos(y);plot(t,z)axis([0 2*pi -2 2])subplot(2,2,3)h=sin(x)+cos(y);plot(t,h)axis([0 2*pi -2 2])subplot(2,2,4)g=(sin(x).^2)-(cos(y).^2);plot(t,g)axis([0 2*pi -1 1])实例6:图形标注function shili06h0=figure('toolbar','none',...'position',[200 150 450 400],...'name','实例06');t=0:pi/10:2*pi;h=plot(t,sin(t));xlabel('t=0到2\pi','fontsize',16);ylabel('sin(t)','fontsize',16);title('\it{从0to2\pi 的正弦曲线}','fontsize',16) x=get(h,'xdata');y=get(h,'ydata');imin=find(min(y)==y);imax=find(max(y)==y);text(x(imin),y(imin),...['\leftarrow最小值=',num2str(y(imin))],...'fontsize',16)text(x(imax),y(imax),...['\leftarrow最大值=',num2str(y(imax))],...'fontsize',16)实例7:条形图形function shili07h0=figure('toolbar','none',...'position',[200 150 450 350],...'name','实例07');tiao1=[562 548 224 545 41 445 745 512];tiao2=[47 48 57 58 54 52 65 48];t=0:7;bar(t,tiao1)xlabel('X轴');ylabel('TIAO1值');h1=gca;h2=axes('position',get(h1,'position'));plot(t,tiao2,'linewidth',3)set(h2,'yaxislocation','right','color','none','xticklabel',[]) 实例8:区域图形function shili08h0=figure('toolbar','none',...'position',[200 150 450 250],...'name','实例08');x=91:95;profits1=[88 75 84 93 77];profits2=[51 64 54 56 68];profits3=[42 54 34 25 24];profits4=[26 38 18 15 4];area(x,profits1,'facecolor',[0.5 0.9 0.6],...'edgecolor','b',...'linewidth',3)hold onarea(x,profits2,'facecolor',[0.9 0.85 0.7],...'edgecolor','y',...'linewidth',3)hold onarea(x,profits3,'facecolor',[0.3 0.6 0.7],...'edgecolor','r',...'linewidth',3)hold onarea(x,profits4,'facecolor',[0.6 0.5 0.9],...'edgecolor','m',...'linewidth',3)hold offset(gca,'xtick',[91:95])set(gca,'layer','top')gtext('\leftarrow第一季度销量')gtext('\leftarrow第二季度销量')gtext('\leftarrow第三季度销量')gtext('\leftarrow第四季度销量')xlabel('年','fontsize',16);ylabel('销售量','fontsize',16);实例9:饼图的绘制function shili09h0=figure('toolbar','none',...'position',[200 150 450 250],...'name','实例09');t=[54 21 35;68 54 35;45 25 12;48 68 45;68 54 69];x=sum(t);h=pie(x);textobjs=findobj(h,'type','text');str1=get(textobjs,{'string'});val1=get(textobjs,{'extent'});oldext=cat(1,val1{:});names={'商品一:';'商品二:';'商品三:'};str2=strcat(names,str1);set(textobjs,{'string'},str2)val2=get(textobjs,{'extent'});newext=cat(1,val2{:});offset=sign(oldext(:,1)).*(newext(:,3)-oldext(:,3))/2; pos=get(textobjs,{'position'});textpos=cat(1,pos{:});textpos(:,1)=textpos(:,1)+offset;set(textobjs,{'position'},num2cell(textpos,[3,2]))实例10:阶梯图function shili10h0=figure('toolbar','none',...'position',[200 150 450 400],...'name','实例10');a=0.01;b=0.5;t=0:10;f=exp(-a*t).*sin(b*t);stairs(t,f)hold onplot(t,f,':*')hold offglabel='函数e^{-(\alpha*t)}sin\beta*t的阶梯图'; gtext(glabel,'fontsize',16)xlabel('t=0:10','fontsize',16)axis([0 10 -1.2 1.2])实例11:枝干图function shili11h0=figure('toolbar','none',...'position',[200 150 450 350],...'name','实例11');x=0:pi/20:2*pi;y1=sin(x);y2=cos(x);h1=stem(x,y1+y2);hold onh2=plot(x,y1,'^r',x,y2,'*g');hold offh3=[h1(1);h2];legend(h3,'y1+y2','y1=sin(x)','y2=cos(x)') xlabel('自变量X');ylabel('函数值Y');title('正弦函数与余弦函数的线性组合');实例12:罗盘图function shili12h0=figure('toolbar','none',...'position',[200 150 450 250],...'name','实例12');winddirection=[54 24 65 84256 12 235 62125 324 34 254];windpower=[2 5 5 36 8 12 76 14 10 8];rdirection=winddirection*pi/180;[x,y]=pol2cart(rdirection,windpower); compass(x,y);desc={'风向和风力','气象台','10月1日0:00到','10月1日12:00'};gtext(desc)实例13:轮廓图function shili13h0=figure('toolbar','none',...'position',[200 150 450 250],...'name','实例13');[th,r]=meshgrid((0:10:360)*pi/180,0:0.05:1); [x,y]=pol2cart(th,r);z=x+i*y;f=(z.^4-1).^(0.25);contour(x,y,abs(f),20)axis equalxlabel('实部','fontsize',16);ylabel('虚部','fontsize',16);h=polar([0 2*pi],[0 1]);delete(h)hold oncontour(x,y,abs(f),20)实例14:交互式图形function shili14h0=figure('toolbar','none',...'position',[200 150 450 250],...'name','实例14');axis([0 10 0 10]);hold onx=[];y=[];n=0;disp('单击鼠标左键点取需要的点'); disp('单击鼠标右键点取最后一个点'); but=1;while but==1[xi,yi,but]=ginput(1);plot(xi,yi,'bo')n=n+1;disp('单击鼠标左键点取下一个点');x(n,1)=xi;y(n,1)=yi;endt=1:n;ts=1:0.1:n;xs=spline(t,x,ts);ys=spline(t,y,ts);plot(xs,ys,'r-');hold off实例14:交互式图形function shili14h0=figure('toolbar','none',...'position',[200 150 450 250],...'name','实例14');axis([0 10 0 10]);hold onx=[];y=[];n=0;disp('单击鼠标左键点取需要的点'); disp('单击鼠标右键点取最后一个点'); but=1;while but==1[xi,yi,but]=ginput(1);plot(xi,yi,'bo')n=n+1;disp('单击鼠标左键点取下一个点');x(n,1)=xi;y(n,1)=yi;endt=1:n;ts=1:0.1:n;xs=spline(t,x,ts);ys=spline(t,y,ts);plot(xs,ys,'r-');hold off实例15:变换的傅立叶函数曲线function shili15h0=figure('toolbar','none',...'position',[200 150 450 250],...'name','实例15');axis equalm=moviein(20,gcf);set(gca,'nextplot','replacechildren') h=uicontrol('style','slider','position',...[100 10 500 20],'min',1,'max',20) for j=1:20plot(fft(eye(j+16)))set(h,'value',j)m(:,j)=getframe(gcf);endclf;axes('position',[0 0 1 1]);movie(m,30)实例16:劳伦兹非线形方程的无序活动function shili15h0=figure('toolbar','none',...'position',[200 150 450 250],...'name','实例15');axis equalm=moviein(20,gcf);set(gca,'nextplot','replacechildren') h=uicontrol('style','slider','position',...[100 10 500 20],'min',1,'max',20) for j=1:20plot(fft(eye(j+16)))set(h,'value',j)m(:,j)=getframe(gcf);endclf;axes('position',[0 0 1 1]);movie(m,30)实例17:填充图function shili17h0=figure('toolbar','none',...'position',[200 150 450 250],...'name','实例17');t=(1:2:15)*pi/8;x=sin(t);y=cos(t);fill(x,y,'r')axis square offtext(0,0,'STOP',...'color',[1 1 1],...'fontsize',50,...'horizontalalignment','center') 例18:条形图和阶梯形图function shili18h0=figure('toolbar','none',...'position',[200 150 450 250],...'name','实例18');subplot(2,2,1)x=-3:0.2:3;y=exp(-x.*x);bar(x,y)title('2-D Bar Chart')subplot(2,2,2)x=-3:0.2:3;y=exp(-x.*x);bar3(x,y,'r')title('3-D Bar Chart')subplot(2,2,3)x=-3:0.2:3;y=exp(-x.*x);stairs(x,y)title('Stair Chart')subplot(2,2,4)x=-3:0.2:3;y=exp(-x.*x);barh(x,y)title('Horizontal Bar Chart')实例19:三维曲线图function shili19h0=figure('toolbar','none',...'position',[200 150 450 400],...'name','实例19');subplot(2,1,1)x=linspace(0,2*pi);y1=sin(x);y2=cos(x);y3=sin(x)+cos(x);z1=zeros(size(x));z2=0.5*z1;z3=z1;plot3(x,y1,z1,x,y2,z2,x,y3,z3)grid onxlabel('X轴');ylabel('Y轴');zlabel('Z轴');title('Figure1:3-D Plot')subplot(2,1,2)x=linspace(0,2*pi);y1=sin(x);y2=cos(x);y3=sin(x)+cos(x);z1=zeros(size(x));z2=0.5*z1;z3=z1;plot3(x,z1,y1,x,z2,y2,x,z3,y3)grid onxlabel('X轴');ylabel('Y轴');zlabel('Z轴');title('Figure2:3-D Plot')实例20:图形的隐藏属性function shili20h0=figure('toolbar','none',...'position',[200 150 450 300],...'name','实例20');subplot(1,2,1)[x,y,z]=sphere(10);mesh(x,y,z)axis offtitle('Figure1:Opaque')hidden onsubplot(1,2,2)[x,y,z]=sphere(10);mesh(x,y,z)axis offtitle('Figure2:Transparent') hidden off实例21PEAKS函数曲线function shili21h0=figure('toolbar','none',...'position',[200 100 450 450],...'name','实例21');[x,y,z]=peaks(30);subplot(2,1,1)x=x(1,:);y=y(:,1);i=find(y>0.8&y<1.2);j=find(x>-0.6&x<0.5);z(i,j)=nan*z(i,j);surfc(x,y,z)xlabel('X轴');ylabel('Y轴');zlabel('Z轴');title('Figure1:surfc函数形成的曲面') subplot(2,1,2)x=x(1,:);y=y(:,1);i=find(y>0.8&y<1.2);j=find(x>-0.6&x<0.5);z(i,j)=nan*z(i,j);surfl(x,y,z)xlabel('X轴');ylabel('Y轴');zlabel('Z轴');title('Figure2:surfl函数形成的曲面')实例22:片状图function shili22h0=figure('toolbar','none',...'position',[200 150 550 350],...'name','实例22');subplot(1,2,1)x=rand(1,20);y=rand(1,20);z=peaks(x,y*pi);t=delaunay(x,y);trimesh(t,x,y,z)hidden offtitle('Figure1:Triangular Surface Plot'); subplot(1,2,2)x=rand(1,20);y=rand(1,20);z=peaks(x,y*pi);t=delaunay(x,y);trisurf(t,x,y,z)title('Figure1:Triangular Surface Plot'); 实例23:视角的调整function shili23h0=figure('toolbar','none',...'position',[200 150 450 350],...'name','实例23');x=-5:0.5:5;[x,y]=meshgrid(x);r=sqrt(x.^2+y.^2)+eps;z=sin(r)./r;subplot(2,2,1)surf(x,y,z)xlabel('X-axis')ylabel('Y-axis')zlabel('Z-axis')title('Figure1')view(-37.5,30)subplot(2,2,2)surf(x,y,z)xlabel('X-axis')ylabel('Y-axis')zlabel('Z-axis')title('Figure2')view(-37.5+90,30)subplot(2,2,3)surf(x,y,z)xlabel('X-axis')ylabel('Y-axis')zlabel('Z-axis')title('Figure3')view(-37.5,60)subplot(2,2,4)surf(x,y,z)xlabel('X-axis')ylabel('Y-axis')zlabel('Z-axis')title('Figure4')view(180,0)实例24:向量场的绘制function shili24h0=figure('toolbar','none',...'position',[200 150 450 350],...'name','实例24');subplot(2,2,1)z=peaks;ribbon(z)title('Figure1')subplot(2,2,2)[x,y,z]=peaks(15);[dx,dy]=gradient(z,0.5,0.5); contour(x,y,z,10)hold onquiver(x,y,dx,dy)hold offtitle('Figure2')subplot(2,2,3)[x,y,z]=peaks(15);[nx,ny,nz]=surfnorm(x,y,z);surf(x,y,z)hold onquiver3(x,y,z,nx,ny,nz)hold offtitle('Figure3')subplot(2,2,4)x=rand(3,5);y=rand(3,5);z=rand(3,5);c=rand(3,5);fill3(x,y,z,c)grid ontitle('Figure4')实例25:灯光定位function shili25h0=figure('toolbar','none',...'position',[200 150 450 250],...'name','实例25');vert=[1 1 1;1 2 1;2 2 1;2 1 1;1 1 2;12 2;2 2 2;2 1 2];fac=[1 2 3 4;2 6 7 3;4 3 7 8;15 8 4;1 2 6 5;5 6 7 8];grid offsphere(36)h=findobj('type','surface');set(h,'facelighting','phong',...'facecolor',...'interp',...'edgecolor',[0.4 0.4 0.4],...'backfacelighting',...'lit')hold onpatch('faces',fac,'vertices',vert,...'facecolor','y');light('position',[1 3 2]);light('position',[-3 -1 3]); material shinyaxis vis3d offhold off实例26:柱状图function shili26h0=figure('toolbar','none',...'position',[200 50 450 450],...'name','实例26');subplot(2,1,1)x=[5 2 18 7 39 8 65 5 54 3 2];bar(x)xlabel('X轴');ylabel('Y轴');title('第一子图');subplot(2,1,2)y=[5 2 18 7 39 8 65 5 54 3 2];barh(y)xlabel('X轴');ylabel('Y轴');title('第二子图');实例27:设置照明方式function shili27h0=figure('toolbar','none',...'position',[200 150 450 350],...'name','实例27');subplot(2,2,1)sphereshading flatcamlight leftcamlight rightlighting flatcolorbaraxis offtitle('Figure1')subplot(2,2,2)sphereshading flatcamlight leftcamlight rightlighting gouraudcolorbaraxis offtitle('Figure2')subplot(2,2,3)sphereshading interpcamlight rightcamlight leftlighting phongcolorbaraxis offtitle('Figure3')subplot(2,2,4)sphereshading flatcamlight leftcamlight rightlighting nonecolorbaraxis offtitle('Figure4')实例28:羽状图function shili28h0=figure('toolbar','none',...'position',[200 150 450 350],...'name','实例28');subplot(2,1,1)alpha=90:-10:0;r=ones(size(alpha));m=alpha*pi/180;n=r*10;[u,v]=pol2cart(m,n);feather(u,v)title('羽状图')axis([0 20 0 10])subplot(2,1,2)t=0:0.5:10;x=0.05+i;y=exp(-x*t);feather(y)title('复数矩阵的羽状图')实例29:立体透视(1)function shili29h0=figure('toolbar','none',...'position',[200 150 450 250],...'name','实例29');[x,y,z]=meshgrid(-2:0.1:2,...-2:0.1:2,...-2:0.1:2);v=x.*exp(-x.^2-y.^2-z.^2);grid onfor i=-2:0.5:2;h1=surf(linspace(-2,2,20),...linspace(-2,2,20),...zeros(20)+i);rotate(h1,[1 -1 1],30)dx=get(h1,'xdata');dy=get(h1,'ydata');dz=get(h1,'zdata');delete(h1)slice(x,y,z,v,[-2 2],2,-2)hold onslice(x,y,z,v,dx,dy,dz)hold offaxis tightview(-5,10)drawnowend实例30:立体透视(2)function shili30h0=figure('toolbar','none',...'position',[200 150 450 250],...'name','实例30');[x,y,z]=meshgrid(-2:0.1:2,...-2:0.1:2,...-2:0.1:2);v=x.*exp(-x.^2-y.^2-z.^2); [dx,dy,dz]=cylinder;slice(x,y,z,v,[-2 2],2,-2)for i=-2:0.2:2h=surface(dx+i,dy,dz);rotate(h,[1 0 0],90)xp=get(h,'xdata');yp=get(h,'ydata');zp=get(h,'zdata');delete(h)hold onhs=slice(x,y,z,v,xp,yp,zp);axis tightxlim([-3 3])view(-10,35)drawnowdelete(hs)hold offend实例31:表面图形function shili31h0=figure('toolbar','none',...'position',[200 150 550 250],...'name','实例31');subplot(1,2,1)x=rand(100,1)*16-8;y=rand(100,1)*16-8;r=sqrt(x.^2+y.^2)+eps;z=sin(r)./r;xlin=linspace(min(x),max(x),33); ylin=linspace(min(y),max(y),33); [X,Y]=meshgrid(xlin,ylin);Z=griddata(x,y,z,X,Y,'cubic'); mesh(X,Y,Z)axis tighthold onplot3(x,y,z,'.','Markersize',20)subplot(1,2,2)k=5;n=2^k-1;theta=pi*(-n:2:n)/n;phi=(pi/2)*(-n:2:n)'/n;X=cos(phi)*cos(theta);Y=cos(phi)*sin(theta);Z=sin(phi)*ones(size(theta));colormap([0 0 0;1 1 1])C=hadamard(2^k);surf(X,Y,Z,C)axis square实例32:沿曲线移动的小球h0=figure('toolbar','none',...'position',[198 56 408 468],...'name','实例32');h1=axes('parent',h0,...'position',[0.15 0.45 0.7 0.5],...'visible','on');t=0:pi/24:4*pi;y=sin(t);plot(t,y,'b')n=length(t);h=line('color',[0 0.5 0.5],...'linestyle','.',...'markersize',25,...'erasemode','xor');k1=uicontrol('parent',h0,...'style','pushbutton',...'position',[80 100 50 30],...'string','开始',...'callback',[...'i=1;',...'k=1;,',...'m=0;,',...'while 1,',...'if k==0,',...'break,',...'end,',...'if k~=0,',...'set(h,''xdata'',t(i),''ydata'',y(i)),',...'drawnow;,',...'i=i+1;,',...'if i>n,',...'m=m+1;,',...'i=1;,',...'end,',...'end,',...'end']);k2=uicontrol('parent',h0,...'style','pushbutton',...'position',[180 100 50 30],...'string','停止',...'callback',[...'k=0;,',...'set(e1,''string'',m),',...'p=get(h,''xdata'');,',...'q=get(h,''ydata'');,',...'set(e2,''string'',p);,',...'set(e3,''string'',q)']); k3=uicontrol('parent',h0,...'style','pushbutton',...'position',[280 100 50 30],...'string','关闭',...'callback','close');e1=uicontrol('parent',h0,...'style','edit',...'position',[60 30 60 20]);t1=uicontrol('parent',h0,...'style','text',...'string','循环次数',...'position',[60 50 60 20]);e2=uicontrol('parent',h0,...'style','edit',...'position',[180 30 50 20]); t2=uicontrol('parent',h0,...'style','text',...'string','终点的X坐标值',...'position',[155 50 100 20]); e3=uicontrol('parent',h0,...'style','edit',...'position',[300 30 50 20]); t3=uicontrol('parent',h0,...'style','text',...'string','终点的Y坐标值',...'position',[275 50 100 20]);实例33:曲线转换按钮h0=figure('toolbar','none',...'position',[200 150 450 250],...'name','实例33');x=0:0.5:2*pi;y=sin(x);h=plot(x,y);grid onhuidiao=[...'if i==1,',...'i=0;,',...'y=cos(x);,',...'delete(h),',...'set(hm,''string'',''正弦函数''),',...'h=plot(x,y);,',...'grid on,',...'else if i==0,',...'i=1;,',...'y=sin(x);,',...'set(hm,''string'',''余弦函数''),',...'delete(h),',...'h=plot(x,y);,',...'grid on,',...'end,',...'end'];hm=uicontrol(gcf,'style','pushbutton',...'string','余弦函数',...'callback',huidiao);i=1;set(hm,'position',[250 20 60 20]);set(gca,'position',[0.2 0.2 0.6 0.6])title('按钮的使用')hold on实例34:栅格控制按钮h0=figure('toolbar','none',...'position',[200 150 450 250],...'name','实例34');x=0:0.5:2*pi;y=sin(x);plot(x,y)huidiao1=[...'set(h_toggle2,''value'',0),',...'grid on,',...];huidiao2=[...'set(h_toggle1,''value'',0),',...'grid off,',...];h_toggle1=uicontrol(gcf,'style','togglebutton',...'string','grid on',...'value',0,...'position',[20 45 50 20],...'callback',huidiao1);h_toggle2=uicontrol(gcf,'style','togglebutton',...'string','grid off',...'value',0,...'position',[20 20 50 20],...'callback',huidiao2);set(gca,'position',[0.2 0.2 0.6 0.6])title('开关按钮的使用')实例35:编辑框的使用h0=figure('toolbar','none',...'position',[200 150 350 250],...'name','实例35');f='Please input the letter';huidiao1=[...'g=upper(f);,',...'set(h2_edit,''string'',g),',...];huidiao2=[...'g=lower(f);,',...'set(h2_edit,''string'',g),',...];h1_edit=uicontrol(gcf,'style','edit',...'position',[100 200 100 50],...'HorizontalAlignment','left',...'string','Please input the letter',...'callback','f=get(h1_edit,''string'');',...'background','w',...'max',5,...'min',1);h2_edit=uicontrol(gcf,'style','edit',...'HorizontalAlignment','left',...'position',[100 100 100 50],...'max',5,...'min',1);h1_button=uicontrol(gcf,'style','pushbutton',...'string','小写变大写',...'position',[100 45 100 20],...'callback',huidiao1);h2_button=uicontrol(gcf,'style','pushbutton',...'string','大写变小写',...'position',[100 20 100 20],...'callback',huidiao2);实例36:弹出式菜单h0=figure('toolbar','none',...'position',[200 150 450 250],...'name','实例36');x=0:0.5:2*pi;y=sin(x);h=plot(x,y);grid onhm=uicontrol(gcf,'style','popupmenu',...'string',...'sin(x)|cos(x)|sin(x)+cos(x)|exp(-sin(x))',...'position',[250 20 50 20]);set(hm,'value',1)huidiao=[...'v=get(hm,''value'');,',...'switch v,',...'case 1,',...'delete(h),',...'y=sin(x);,',...'h=plot(x,y);,',...'grid on,',...'case 2,',...'delete(h),',...'y=cos(x);,',...'h=plot(x,y);,',...'grid on,',...'case 3,',...'delete(h),',...'y=sin(x)+cos(x);,',...'h=plot(x,y);,',...'grid on,',...'case 4,',...'y=exp(-sin(x));,',...'h=plot(x,y);,',...'grid on,',...'end'];set(hm,'callback',huidiao)set(gca,'position',[0.2 0.2 0.6 0.6])title('弹出式菜单的使用')实例37:滑标的使用h0=figure('toolbar','none',...'position',[200 150 450 250],...'name','实例37');[x,y]=meshgrid(-8:0.5:8);r=sqrt(x.^2+y.^2)+eps;z=sin(r)./r;h0=mesh(x,y,z);h1=axes('position',...[0.2 0.2 0.5 0.5],...'visible','off');htext=uicontrol(gcf,...'units','points',...'position',[20 30 45 15],...'string','brightness',...'style','text');hslider=uicontrol(gcf,...'units','points',...'position',[10 10 300 15],...'min',-1,...'max',1,...'style','slider',...'callback',...'brighten(get(hslider,''value''))');实例38:多选菜单h0=figure('toolbar','none',...'position',[200 150 450 250],...'name','实例38');[x,y]=meshgrid(-8:0.5:8);r=sqrt(x.^2+y.^2)+eps;z=sin(r)./r;h0=mesh(x,y,z);hlist=uicontrol(gcf,'style','listbox',...'string','default|spring|summer|autumn|winter',...'max',5,...'min',1,...'position',[20 20 80 100],...'callback',[...'k=get(hlist,''value'');,',...'switch k,',...'case 1,',...'colormap default,',...'case 2,',...'colormap spring,',...'case 3,',...'colormap summer,',...'case 4,',...'colormap autumn,',...'case 5,',...'colormap winter,',...'end']);实例39:菜单控制的使用h0=figure('toolbar','none',...'position',[200 150 450 250],...'name','实例39');x=0:0.5:2*pi;y=cos(x);h=plot(x,y);grid onset(gcf,'toolbar','none')hm=uimenu('label','example');huidiao1=[...'set(hm_gridon,''checked'',''on''),',...'set(hm_gridoff,''checked'',''off''),',...'grid on'];huidiao2=[...'set(hm_gridoff,''checked'',''on''),',...'set(hm_gridon,''checked'',''off''),',...'grid off'];hm_gridon=uimenu(hm,'label','grid on',...'checked','on',...'callback',huidiao1);hm_gridoff=uimenu(hm,'label','grid off',...'checked','off',...'callback',huidiao2);实例40:UIMENU菜单的应用。
matlab的例题
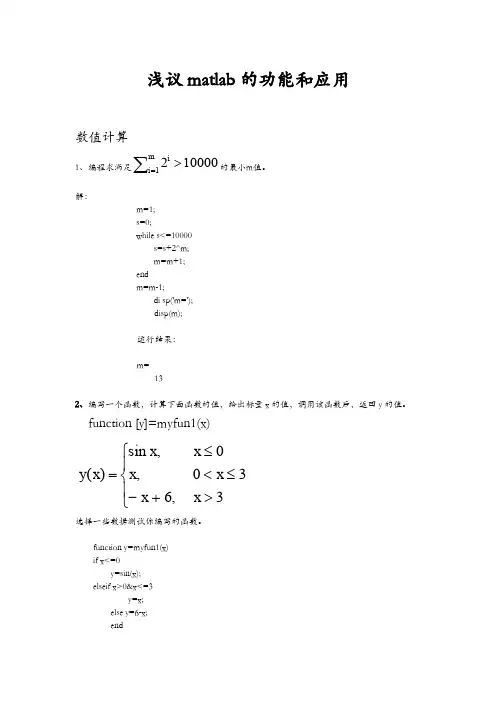
浅议matlab 的功能和应用数值计算1、编程求满足∑=>mi i 1100002的最小m 值。
解:m=1; s=0;while s<=10000s=s+2^m; m=m+1;end m=m-1;di sp('m=');disp(m);运行结果:m=132、编写一个函数,计算下面函数的值,给出标量x 的值,调用该函数后,返回y 的值。
function [y]=myfun1(x)选择一些数据测试你编写的函数。
function y=myfun1(x) if x<=0y=sin(x); elseif x>0&x<=3 y=x; else y=6-x; end⎪⎩⎪⎨⎧>+-≤<≤=3,630,0,sin )(x x x x x x x yreturn ;3、编写一个函数,给出一个向量],,[21n x x x x=,生成如下范德蒙矩阵。
function [v]=myvander(x)⎥⎥⎥⎥⎥⎥⎦⎤⎢⎢⎢⎢⎢⎢⎣⎡---112112222121111n n n n n n x x x x x x x x x例如:>>v=myvander([2 3 4 5]) 得v=⎥⎥⎥⎥⎦⎤⎢⎢⎢⎢⎣⎡1256427825169454321111 生成一些数据测试你写的函数。
function [v]=myvander(x) n=length(x); v(1:n)=1; for i=n+1:n*n a=i/n;r=mod(i,n); b=floor(a); if r==0 r=n; b=b-1; endv(i)=x(r)^b; endv=reshape(v,n,n)';>> myvander([1 2 3])ans =1 1 11 2 3 1 4 9>> myvander([ 1 4 6 8])ans =1 1 1 1 1 4 6 8 1 16 36 64 1 64 216 512图像的绘制1、在同一坐标系下绘制下面三个函数在t ∈[0,4π]的图象。
matlab编程实例100例(精编文档).doc
【最新整理,下载后即可编辑】1-32是:图形应用篇33-66是:界面设计篇67-84是:图形处理篇85-100是:数值分析篇实例1:三角函数曲线(1)function shili01h0=figure('toolbar','none',...'position',[198****0300],...'name','实例01');h1=axes('parent',h0,...'visible','off');x=-pi:0.05:pi;y=sin(x);plot(x,y);xlabel('自变量X');ylabel('函数值Y');title('SIN( )函数曲线');grid on实例2:三角函数曲线(2)function shili02h0=figure('toolbar','none',...'position',[200 150 450 350],...'name','实例02');x=-pi:0.05:pi;y=sin(x)+cos(x);plot(x,y,'-*r','linewidth',1);grid onxlabel('自变量X');ylabel('函数值Y');title('三角函数');实例3:图形的叠加function shili03h0=figure('toolbar','none',...'position',[200 150 450 350],...'name','实例03');x=-pi:0.05:pi;y1=sin(x);y2=cos(x);plot(x,y1,...'-*r',...x,y2,...'--og');grid onxlabel('自变量X');ylabel('函数值Y');title('三角函数');实例4:双y轴图形的绘制function shili04h0=figure('toolbar','none',...'position',[200 150 450 250],...'name','实例04');x=0:900;a=1000;b=0.005;y1=2*x;y2=cos(b*x);[haxes,hline1,hline2]=plotyy(x,y1,x,y2,'semilogy','plot'); axes(haxes(1))ylabel('semilog plot');axes(haxes(2))ylabel('linear plot');实例5:单个轴窗口显示多个图形function shili05h0=figure('toolbar','none',...'position',[200 150 450 250],...'name','实例05');t=0:pi/10:2*pi;[x,y]=meshgrid(t);subplot(2,2,1)plot(sin(t),cos(t))axis equalsubplot(2,2,2)z=sin(x)-cos(y);plot(t,z)axis([0 2*pi -2 2])subplot(2,2,3)h=sin(x)+cos(y);plot(t,h)axis([0 2*pi -2 2])subplot(2,2,4)g=(sin(x).^2)-(cos(y).^2);plot(t,g)axis([0 2*pi -1 1])实例6:图形标注function shili06h0=figure('toolbar','none',...'position',[200 150 450 400],...'name','实例06');t=0:pi/10:2*pi;h=plot(t,sin(t));xlabel('t=0到2\pi','fontsize',16);ylabel('sin(t)','fontsize',16);title('\it{从0to2\pi 的正弦曲线}','fontsize',16) x=get(h,'xdata');y=get(h,'ydata');imin=find(min(y)==y);imax=find(max(y)==y);text(x(imin),y(imin),...['\leftarrow最小值=',num2str(y(imin))],...'fontsize',16)text(x(imax),y(imax),...['\leftarrow最大值=',num2str(y(imax))],...'fontsize',16)实例7:条形图形function shili07h0=figure('toolbar','none',...'position',[200 150 450 350],...'name','实例07');tiao1=[562 548 224 545 41 445 745 512];tiao2=[47 48 57 58 54 52 65 48];t=0:7;bar(t,tiao1)xlabel('X轴');ylabel('TIAO1值');h1=gca;h2=axes('position',get(h1,'position'));plot(t,tiao2,'linewidth',3)set(h2,'yaxislocation','right','color','none','xticklabel',[]) 实例8:区域图形function shili08h0=figure('toolbar','none',...'position',[200 150 450 250],...'name','实例08');x=91:95;profits1=[88 75 84 93 77];profits2=[51 64 54 56 68];profits3=[42 54 34 25 24];profits4=[26 38 18 15 4];area(x,profits1,'facecolor',[0.5 0.9 0.6],...'edgecolor','b',...'linewidth',3)hold onarea(x,profits2,'facecolor',[0.9 0.85 0.7],...'edgecolor','y',...'linewidth',3)hold onarea(x,profits3,'facecolor',[0.3 0.6 0.7],...'edgecolor','r',...'linewidth',3)hold onarea(x,profits4,'facecolor',[0.6 0.5 0.9],...'edgecolor','m',...'linewidth',3)hold offset(gca,'xtick',[91:95])set(gca,'layer','top')gtext('\leftarrow第一季度销量') gtext('\leftarrow第二季度销量') gtext('\leftarrow第三季度销量') gtext('\leftarrow第四季度销量') xlabel('年','fontsize',16);ylabel('销售量','fontsize',16);实例9:饼图的绘制function shili09h0=figure('toolbar','none',...'position',[200 150 450 250],...'name','实例09');t=[54 21 35;68 54 35;45 25 12;48 68 45;68 54 69];x=sum(t);h=pie(x);textobjs=findobj(h,'type','text');str1=get(textobjs,{'string'});val1=get(textobjs,{'extent'});oldext=cat(1,val1{:});names={'商品一:';'商品二:';'商品三:'};str2=strcat(names,str1);set(textobjs,{'string'},str2)val2=get(textobjs,{'extent'});newext=cat(1,val2{:});offset=sign(oldext(:,1)).*(newext(:,3)-oldext(:,3))/2; pos=get(textobjs,{'position'});textpos=cat(1,pos{:});textpos(:,1)=textpos(:,1)+offset;set(textobjs,{'position'},num2cell(textpos,[3,2]))实例10:阶梯图function shili10h0=figure('toolbar','none',...'position',[200 150 450 400],...'name','实例10');a=0.01;b=0.5;t=0:10;f=exp(-a*t).*sin(b*t);stairs(t,f)hold onplot(t,f,':*')hold offglabel='函数e^{-(\alpha*t)}sin\beta*t的阶梯图'; gtext(glabel,'fontsize',16)xlabel('t=0:10','fontsize',16)axis([0 10 -1.2 1.2])实例11:枝干图function shili11h0=figure('toolbar','none',...'position',[200 150 450 350],...'name','实例11');x=0:pi/20:2*pi;y1=sin(x);y2=cos(x);h1=stem(x,y1+y2);hold onh2=plot(x,y1,'^r',x,y2,'*g');hold offh3=[h1(1);h2];legend(h3,'y1+y2','y1=sin(x)','y2=cos(x)') xlabel('自变量X');ylabel('函数值Y');title('正弦函数与余弦函数的线性组合'); 实例12:罗盘图function shili12h0=figure('toolbar','none',...'position',[200 150 450 250],...'name','实例12');winddirection=[54 24 65 84256 12 235 62125 324 34 254];windpower=[2 5 5 36 8 12 76 14 10 8];rdirection=winddirection*pi/180;[x,y]=pol2cart(rdirection,windpower); compass(x,y);desc={'风向和风力','北京气象台','10月1日0:00到','10月1日12:00'};gtext(desc)实例13:轮廓图function shili13h0=figure('toolbar','none',...'position',[200 150 450 250],...'name','实例13');[th,r]=meshgrid((0:10:360)*pi/180,0:0.05:1); [x,y]=pol2cart(th,r);z=x+i*y;f=(z.^4-1).^(0.25);contour(x,y,abs(f),20)axis equalxlabel('实部','fontsize',16);ylabel('虚部','fontsize',16);h=polar([0 2*pi],[0 1]);delete(h)hold oncontour(x,y,abs(f),20)实例14:交互式图形function shili14h0=figure('toolbar','none',...'position',[200 150 450 250],...'name','实例14');axis([0 10 0 10]);hold onx=[];y=[];n=0;disp('单击鼠标左键点取需要的点'); disp('单击鼠标右键点取最后一个点'); but=1;while but==1[xi,yi,but]=ginput(1);plot(xi,yi,'bo')n=n+1;disp('单击鼠标左键点取下一个点');x(n,1)=xi;y(n,1)=yi;endt=1:n;ts=1:0.1:n;xs=spline(t,x,ts);ys=spline(t,y,ts);plot(xs,ys,'r-');hold off实例14:交互式图形function shili14h0=figure('toolbar','none',...'position',[200 150 450 250],...'name','实例14');axis([0 10 0 10]);hold onx=[];y=[];n=0;disp('单击鼠标左键点取需要的点'); disp('单击鼠标右键点取最后一个点'); but=1;while but==1[xi,yi,but]=ginput(1);plot(xi,yi,'bo')n=n+1;disp('单击鼠标左键点取下一个点');x(n,1)=xi;y(n,1)=yi;endt=1:n;ts=1:0.1:n;xs=spline(t,x,ts);ys=spline(t,y,ts);plot(xs,ys,'r-');hold off实例15:变换的傅立叶函数曲线function shili15h0=figure('toolbar','none',...'position',[200 150 450 250],...'name','实例15');axis equalm=moviein(20,gcf);set(gca,'nextplot','replacechildren')h=uicontrol('style','slider','position',...[100 10 500 20],'min',1,'max',20)for j=1:20plot(fft(eye(j+16)))set(h,'value',j)m(:,j)=getframe(gcf);endclf;axes('position',[0 0 1 1]);movie(m,30)实例16:劳伦兹非线形方程的无序活动function shili15h0=figure('toolbar','none',...'position',[200 150 450 250],...'name','实例15');axis equalm=moviein(20,gcf);set(gca,'nextplot','replacechildren')h=uicontrol('style','slider','position',...[100 10 500 20],'min',1,'max',20)for j=1:20plot(fft(eye(j+16)))set(h,'value',j)m(:,j)=getframe(gcf);endclf;axes('position',[0 0 1 1]);movie(m,30)实例17:填充图function shili17h0=figure('toolbar','none',...'position',[200 150 450 250],...'name','实例17');t=(1:2:15)*pi/8;x=sin(t);y=cos(t);fill(x,y,'r')axis square offtext(0,0,'STOP',...'color',[1 1 1],...'fontsize',50,...'horizontalalignment','center') 例18:条形图和阶梯形图function shili18h0=figure('toolbar','none',...'position',[200 150 450 250],...'name','实例18');subplot(2,2,1)x=-3:0.2:3;y=exp(-x.*x);bar(x,y)title('2-D Bar Chart')subplot(2,2,2)x=-3:0.2:3;y=exp(-x.*x);bar3(x,y,'r')title('3-D Bar Chart')subplot(2,2,3)x=-3:0.2:3;y=exp(-x.*x);stairs(x,y)title('Stair Chart')subplot(2,2,4)x=-3:0.2:3;y=exp(-x.*x);barh(x,y)title('Horizontal Bar Chart')实例19:三维曲线图function shili19h0=figure('toolbar','none',...'position',[200 150 450 400],...'name','实例19');subplot(2,1,1)x=linspace(0,2*pi);y1=sin(x);y2=cos(x);y3=sin(x)+cos(x);z1=zeros(size(x));z2=0.5*z1;z3=z1;plot3(x,y1,z1,x,y2,z2,x,y3,z3)grid onxlabel('X轴');ylabel('Y轴');zlabel('Z轴');title('Figure1:3-D Plot')subplot(2,1,2)x=linspace(0,2*pi);y1=sin(x);y2=cos(x);y3=sin(x)+cos(x);z1=zeros(size(x));z2=0.5*z1;z3=z1;plot3(x,z1,y1,x,z2,y2,x,z3,y3)grid onxlabel('X轴');ylabel('Y轴');zlabel('Z轴');title('Figure2:3-D Plot')实例20:图形的隐藏属性function shili20h0=figure('toolbar','none',...'position',[200 150 450 300],...'name','实例20');subplot(1,2,1)[x,y,z]=sphere(10);mesh(x,y,z)axis offtitle('Figure1:Opaque')hidden onsubplot(1,2,2)[x,y,z]=sphere(10);mesh(x,y,z)axis offtitle('Figure2:Transparent') hidden off实例21PEAKS函数曲线function shili21h0=figure('toolbar','none',...'position',[200 100 450 450],...'name','实例21');[x,y,z]=peaks(30);subplot(2,1,1)x=x(1,:);y=y(:,1);i=find(y>0.8&y<1.2);j=find(x>-0.6&x<0.5);z(i,j)=nan*z(i,j);surfc(x,y,z)xlabel('X轴');ylabel('Y轴');zlabel('Z轴');title('Figure1:surfc函数形成的曲面') subplot(2,1,2)x=x(1,:);y=y(:,1);i=find(y>0.8&y<1.2);j=find(x>-0.6&x<0.5);z(i,j)=nan*z(i,j);surfl(x,y,z)xlabel('X轴');ylabel('Y轴');zlabel('Z轴');title('Figure2:surfl函数形成的曲面') 实例22:片状图function shili22h0=figure('toolbar','none',...'position',[200 150 550 350],...'name','实例22');subplot(1,2,1)x=rand(1,20);y=rand(1,20);z=peaks(x,y*pi);t=delaunay(x,y);trimesh(t,x,y,z)hidden offtitle('Figure1:Triangular Surface Plot'); subplot(1,2,2)x=rand(1,20);y=rand(1,20);z=peaks(x,y*pi);t=delaunay(x,y);trisurf(t,x,y,z)title('Figure1:Triangular Surface Plot'); 实例23:视角的调整function shili23h0=figure('toolbar','none',...'position',[200 150 450 350],...'name','实例23');x=-5:0.5:5;[x,y]=meshgrid(x);r=sqrt(x.^2+y.^2)+eps;z=sin(r)./r;subplot(2,2,1)surf(x,y,z)xlabel('X-axis')ylabel('Y-axis')zlabel('Z-axis')title('Figure1')view(-37.5,30)subplot(2,2,2)surf(x,y,z)xlabel('X-axis')ylabel('Y-axis')zlabel('Z-axis')title('Figure2')view(-37.5+90,30) subplot(2,2,3)surf(x,y,z)xlabel('X-axis')ylabel('Y-axis')zlabel('Z-axis')title('Figure3')view(-37.5,60)subplot(2,2,4)surf(x,y,z)xlabel('X-axis')ylabel('Y-axis')zlabel('Z-axis')title('Figure4')view(180,0)实例24:向量场的绘制function shili24h0=figure('toolbar','none',...'position',[200 150 450 350],...'name','实例24');subplot(2,2,1)z=peaks;ribbon(z)title('Figure1')subplot(2,2,2)[x,y,z]=peaks(15);[dx,dy]=gradient(z,0.5,0.5); contour(x,y,z,10)hold onquiver(x,y,dx,dy)hold offtitle('Figure2')subplot(2,2,3)[x,y,z]=peaks(15);[nx,ny,nz]=surfnorm(x,y,z);surf(x,y,z)hold onquiver3(x,y,z,nx,ny,nz)hold offtitle('Figure3')subplot(2,2,4)x=rand(3,5);y=rand(3,5);z=rand(3,5);c=rand(3,5);fill3(x,y,z,c)grid ontitle('Figure4')实例25:灯光定位function shili25h0=figure('toolbar','none',...'position',[200 150 450 250],...'name','实例25');vert=[1 1 1;1 2 1;2 2 1;2 1 1;1 1 2;12 2;2 2 2;2 1 2];fac=[1 2 3 4;2 6 7 3;4 3 7 8;15 8 4;1 2 6 5;5 6 7 8];grid offsphere(36)h=findobj('type','surface');set(h,'facelighting','phong',...'facecolor',...'interp',...'edgecolor',[0.4 0.4 0.4],...'backfacelighting',...'lit')hold onpatch('faces',fac,'vertices',vert,...'facecolor','y');light('position',[1 3 2]);light('position',[-3 -1 3]);material shinyaxis vis3d offhold off实例26:柱状图function shili26h0=figure('toolbar','none',...'position',[200 50 450 450],...'name','实例26'); subplot(2,1,1)x=[5 2 18 7 39 8 65 5 54 3 2];bar(x)xlabel('X轴');ylabel('Y轴');title('第一子图');subplot(2,1,2)y=[5 2 18 7 39 8 65 5 54 3 2];barh(y)xlabel('X轴');ylabel('Y轴');title('第二子图');实例27:设置照明方式function shili27h0=figure('toolbar','none',...'position',[200 150 450 350],...'name','实例27');subplot(2,2,1)sphereshading flatcamlight leftcamlight rightlighting flatcolorbaraxis offtitle('Figure1')subplot(2,2,2)sphereshading flatcamlight leftcamlight rightlighting gouraudcolorbaraxis offtitle('Figure2')subplot(2,2,3)sphereshading interpcamlight rightcamlight leftlighting phongaxis offtitle('Figure3')subplot(2,2,4)sphereshading flatcamlight leftcamlight rightlighting nonecolorbaraxis offtitle('Figure4')实例28:羽状图function shili28h0=figure('toolbar','none',...'position',[200 150 450 350],...'name','实例28');subplot(2,1,1)alpha=90:-10:0;r=ones(size(alpha));m=alpha*pi/180;n=r*10;[u,v]=pol2cart(m,n);feather(u,v)title('羽状图')axis([0 20 0 10])subplot(2,1,2)t=0:0.5:10;y=exp(-x*t);feather(y)title('复数矩阵的羽状图')实例29:立体透视(1)function shili29h0=figure('toolbar','none',...'position',[200 150 450 250],...'name','实例29');[x,y,z]=meshgrid(-2:0.1:2,...-2:0.1:2,...-2:0.1:2);v=x.*exp(-x.^2-y.^2-z.^2);grid onfor i=-2:0.5:2;h1=surf(linspace(-2,2,20),...linspace(-2,2,20),...zeros(20)+i);rotate(h1,[1 -1 1],30)dx=get(h1,'xdata');dy=get(h1,'ydata');dz=get(h1,'zdata');delete(h1)slice(x,y,z,v,[-2 2],2,-2)hold onslice(x,y,z,v,dx,dy,dz)hold offaxis tightview(-5,10)drawnowend实例30:立体透视(2)function shili30h0=figure('toolbar','none',...'position',[200 150 450 250],...'name','实例30');[x,y,z]=meshgrid(-2:0.1:2,...-2:0.1:2,...-2:0.1:2);v=x.*exp(-x.^2-y.^2-z.^2); [dx,dy,dz]=cylinder;slice(x,y,z,v,[-2 2],2,-2)for i=-2:0.2:2h=surface(dx+i,dy,dz);rotate(h,[1 0 0],90)xp=get(h,'xdata');yp=get(h,'ydata');zp=get(h,'zdata');delete(h)hold onhs=slice(x,y,z,v,xp,yp,zp);axis tightxlim([-3 3])view(-10,35)drawnowdelete(hs)hold offend实例31:表面图形function shili31h0=figure('toolbar','none',...'position',[200 150 550 250],...'name','实例31');subplot(1,2,1)x=rand(100,1)*16-8;y=rand(100,1)*16-8;r=sqrt(x.^2+y.^2)+eps;z=sin(r)./r;xlin=linspace(min(x),max(x),33); ylin=linspace(min(y),max(y),33); [X,Y]=meshgrid(xlin,ylin);Z=griddata(x,y,z,X,Y,'cubic'); mesh(X,Y,Z)axis tighthold onplot3(x,y,z,'.','Markersize',20) subplot(1,2,2)k=5;n=2^k-1;theta=pi*(-n:2:n)/n;phi=(pi/2)*(-n:2:n)'/n;X=cos(phi)*cos(theta);Y=cos(phi)*sin(theta);Z=sin(phi)*ones(size(theta)); colormap([0 0 0;1 1 1])C=hadamard(2^k);surf(X,Y,Z,C)axis square实例32:沿曲线移动的小球h0=figure('toolbar','none',...'position',[198****8468],...'name','实例32');h1=axes('parent',h0,...'position',[0.15 0.45 0.7 0.5],...'visible','on');t=0:pi/24:4*pi;y=sin(t);plot(t,y,'b')n=length(t);h=line('color',[0 0.5 0.5],...'linestyle','.',...'markersize',25,...'erasemode','xor');k1=uicontrol('parent',h0,...'style','pushbutton',...'position',[80 100 50 30],...'string','开始',...'callback',[...'i=1;',...'k=1;,',...'m=0;,',...'while 1,',...'if k==0,',...'break,',...'end,',...'if k~=0,',...'set(h,''xdata'',t(i),''ydata'',y(i)),',...'drawnow;,',...'i=i+1;,',...'if i>n,',...'m=m+1;,',...'i=1;,',...'end,',...'end,',...'end']);k2=uicontrol('parent',h0,...'style','pushbutton',...'position',[180 100 50 30],...'string','停止',...'callback',[...'k=0;,',...'set(e1,''string'',m),',...'p=get(h,''xdata'');,',...'q=get(h,''ydata'');,',...'set(e2,''string'',p);,',...'set(e3,''string'',q)']); k3=uicontrol('parent',h0,...'style','pushbutton',...'position',[280 100 50 30],...'string','关闭',...'callback','close');e1=uicontrol('parent',h0,...'style','edit',...'position',[60 30 60 20]);t1=uicontrol('parent',h0,...'style','text',...'string','循环次数',...'position',[60 50 60 20]);e2=uicontrol('parent',h0,...'style','edit',...'position',[180 30 50 20]);t2=uicontrol('parent',h0,...'style','text',...'string','终点的X坐标值',...'position',[155 50 100 20]);e3=uicontrol('parent',h0,...'style','edit',...'position',[300 30 50 20]);t3=uicontrol('parent',h0,...'style','text',...'string','终点的Y坐标值',...'position',[275 50 100 20]);实例33:曲线转换按钮h0=figure('toolbar','none',...'position',[200 150 450 250],...'name','实例33');x=0:0.5:2*pi;y=sin(x);h=plot(x,y);grid onhuidiao=[...'if i==1,',...'i=0;,',...'y=cos(x);,',...'delete(h),',...'set(hm,''string'',''正弦函数''),',...'h=plot(x,y);,',...'grid on,',...'else if i==0,',...'i=1;,',...'y=sin(x);,',...'set(hm,''string'',''余弦函数''),',...'delete(h),',...'h=plot(x,y);,',...'grid on,',...'end,',...'end'];hm=uicontrol(gcf,'style','pushbutton',...'string','余弦函数',...'callback',huidiao);i=1;set(hm,'position',[250 20 60 20]);set(gca,'position',[0.2 0.2 0.6 0.6])title('按钮的使用')hold on实例34:栅格控制按钮h0=figure('toolbar','none',...'position',[200 150 450 250],...'name','实例34');x=0:0.5:2*pi;y=sin(x);plot(x,y)huidiao1=[...'set(h_toggle2,''value'',0),',...'grid on,',...];huidiao2=[...'set(h_toggle1,''value'',0),',...'grid off,',...];h_toggle1=uicontrol(gcf,'style','togglebutton',...'string','grid on',...'value',0,...'position',[20 45 50 20],...'callback',huidiao1);h_toggle2=uicontrol(gcf,'style','togglebutton',...'string','grid off',...'value',0,...'position',[20 20 50 20],...'callback',huidiao2);set(gca,'position',[0.2 0.2 0.6 0.6])title('开关按钮的使用')实例35:编辑框的使用h0=figure('toolbar','none',...'position',[200 150 350 250],...'name','实例35');f='Please input the letter';huidiao1=[...'g=upper(f);,',...'set(h2_edit,''string'',g),',...];huidiao2=[...'g=lower(f);,',...'set(h2_edit,''string'',g),',...];h1_edit=uicontrol(gcf,'style','edit',...'position',[100 200 100 50],...'HorizontalAlignment','left',...'string','Please input the letter',...'callback','f=get(h1_edit,''string'');',...'background','w',...'max',5,...'min',1);h2_edit=uicontrol(gcf,'style','edit',...'HorizontalAlignment','left',...'position',[100 100 100 50],...'background','w',...'max',5,...'min',1);h1_button=uicontrol(gcf,'style','pushbutton',...'string','小写变大写',...'position',[100 45 100 20],...'callback',huidiao1);h2_button=uicontrol(gcf,'style','pushbutton',...'string','大写变小写',...'position',[100 20 100 20],...'callback',huidiao2);实例36:弹出式菜单h0=figure('toolbar','none',...'position',[200 150 450 250],...'name','实例36');x=0:0.5:2*pi;y=sin(x);h=plot(x,y);grid onhm=uicontrol(gcf,'style','popupmenu',...'string',...'sin(x)|cos(x)|sin(x)+cos(x)|exp(-sin(x))',...'position',[250 20 50 20]);set(hm,'value',1)huidiao=[...'v=get(hm,''value'');,',...'switch v,',...'case 1,',...'delete(h),',...'y=sin(x);,',...'h=plot(x,y);,',...'grid on,',...'case 2,',...'delete(h),',...'y=cos(x);,',...'h=plot(x,y);,',...'grid on,',...'case 3,',...'delete(h),',...'y=sin(x)+cos(x);,',...'h=plot(x,y);,',...'grid on,',...'case 4,',...'delete(h),',...'y=exp(-sin(x));,',...'h=plot(x,y);,',...'grid on,',...'end'];set(hm,'callback',huidiao)set(gca,'position',[0.2 0.2 0.6 0.6]) title('弹出式菜单的使用')实例37:滑标的使用h0=figure('toolbar','none',...'position',[200 150 450 250],...'name','实例37');[x,y]=meshgrid(-8:0.5:8);r=sqrt(x.^2+y.^2)+eps;z=sin(r)./r;h0=mesh(x,y,z);h1=axes('position',...[0.2 0.2 0.5 0.5],...'visible','off');htext=uicontrol(gcf,...'units','points',...'position',[20 30 45 15],...'string','brightness',...'style','text');hslider=uicontrol(gcf,...'units','points',...'position',[10 10 300 15],...'min',-1,...'max',1,...'style','slider',...'callback',...'brighten(get(hslider,''value''))'); 实例38:多选菜单h0=figure('toolbar','none',...'position',[200 150 450 250],...'name','实例38');[x,y]=meshgrid(-8:0.5:8);r=sqrt(x.^2+y.^2)+eps;z=sin(r)./r;h0=mesh(x,y,z);hlist=uicontrol(gcf,'style','listbox',...'string','default|spring|summer|autumn|winter',...'max',5,...'min',1,...'position',[20 20 80 100],...'callback',[...'k=get(hlist,''value'');,',...'switch k,',...'case 1,',...'colormap default,',...'case 2,',...'colormap spring,',...'case 3,',...'colormap summer,',...'case 4,',...'colormap autumn,',...'case 5,',...'colormap winter,',...'end']);实例39:菜单控制的使用h0=figure('toolbar','none',...'position',[200 150 450 250],...'name','实例39');x=0:0.5:2*pi;y=cos(x);h=plot(x,y);grid onset(gcf,'toolbar','none')hm=uimenu('label','example');huidiao1=[...'set(hm_gridon,''checked'',''on''),',...'set(hm_gridoff,''checked'',''off''),',...'grid on'];huidiao2=[...'set(hm_gridoff,''checked'',''on''),',...'set(hm_gridon,''checked'',''off''),',...'grid off'];hm_gridon=uimenu(hm,'label','grid on',...'checked','on',...'callback',huidiao1);hm_gridoff=uimenu(hm,'label','grid off',...'checked','off',...'callback',huidiao2);实例40:UIMENU菜单的应用h0=figure('toolbar','none',...'position',[200 150 450 250],...'name','实例40');h1=uimenu(gcf,'label','函数');h11=uimenu(h1,'label','轮廓图',...'callback',[...'set(h31,''checked'',''on''),',...'set(h32,''checked'',''off''),',...'[x,y,z]=peaks;,',...'contour3(x,y,z,30)']);h12=uimenu(h1,'label','高斯分布',...'callback',[...'set(h31,''checked'',''on''),',...'set(h32,''checked'',''off''),',...'mesh(peaks);,',...'axis tight']);。
matLAB经典例题及答案
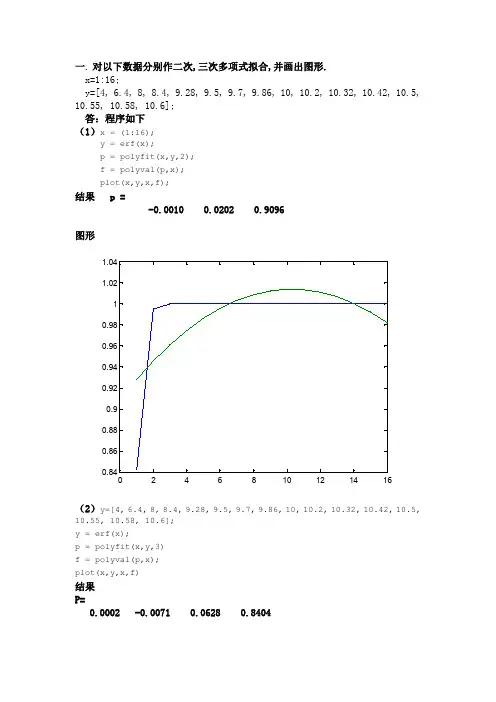
一.对以下数据分别作二次,三次多项式拟合,并画出图形.x=1:16;y=[4,6.4,8,8.4,9.28,9.5,9.7,9.86,10,10.2,10.32,10.42,10.5, 10.55,10.58,10.6];答:程序如下(1)x=(1:16);y=erf(x);p=polyfit(x,y,2);f=polyval(p,x);plot(x,y,x,f);结果p=-0.00100.02020.9096(2)y=[4,6.4,8,8.4,9.28,9.5,9.7,9.86,10,10.2,10.32,10.42,10.5, 10.55,10.58,10.6];y=erf(x);p=polyfit(x,y,3)f=polyval(p,x);plot(x,y,x,f)结果P=0.0002-0.00710.06280.8404二.在[0,4pi]画sin(x),cos(x)(在同一个图象中);其中cos(x)图象用红色小圆圈画.并在函数图上标注“y=sin(x)”,“y=cos(x)”,x轴,y轴,标题为“正弦余弦函数图象”.答:程序如下x=[0:720]*pi/180;plot(x,sin(x),x,cos(x),'ro');x=[2.5;7];y=[0;0];s=['y=sin(x)';'y=cos(x)'];text(x,y,s);xlabel('正弦余弦函数图象'),ylabel('正弦余弦函数图象')图形如下三.选择一个单自由度线性振动系统模型,自定质量、弹簧刚度、阻尼、激振力等一组参数,分别编程(m 文件)计算自由和强迫振动时的响应,并画出振动曲线图。
(要求画出该单自由度线性振动系统模型图)其中质量为m=1000kg,弹性刚度k=48020N/m,阻尼c=1960N.s/m,激振力f(t)=0.阻尼比ζ的程序p=1960/(2*sqrt(48020*1000))求得p=0.1414而p为阻尼比ζ强迫振动时的响应程序g =tf([-101],[48020048020*1.9848020]);bode(g)图形g =tf([001],[0001]);bode(g)振动曲线图程序:函数文件function dx =rigid(t,x)dx =zeros(2,1);dx(1)=x(2);dx(2)=(-48020*x(1)-1960*x(2))/1000;命令文件options =odeset('RelTol',1e-4,'AbsTol',[1e-41e-4]);[T,X]=ode45(@rigid,[012],[11],options);plot(T,X(:,1),'-')其图形如下024681012-6-5-4-3-2-11234单自由度线性强迫振动系统模型图其中质量为m=1000kg,弹性刚度k=48020N/m,阻尼c=1960N.s/m,f(t)=cos(3*pi*t)振动曲线图程序:函数文件function dx=rigid(t,x)dx=zeros(2,1);dx(1)=x(2);dx(2)=(-48020*x(1)-1960*x(2))/1000+cos(3*pi*t);命令文件options=odeset('RelTol',1e-4,'AbsTol',[1e-41e-4]);[T,X]=ode45(@rigid,[020],[11],options);plot(T,X(:,1),'-')力等一组参数,建立Simulink仿真模型框图进行仿真分析。
matlab编程经典例题
3.2 程序控制结构 3.2.1 顺序结构 1.数据的输入 从键盘输入数据,则可以使用input函数来进
行,该函数的调用格式为: A=input(提示信息,选项); 其中提示信息为一个字符串,用于提示用户 输入什么样的数据。 如果在input函数调用时采用's'选项,则允 许用户输入一个字符串。例如,想输入一 个人的姓名,可采用命令: xm=input('What''s your name?','s');
%输出商品实际销售价格
3.try语句 语句格式为:
try 语句组1
catch 语句组2
end try语句先试探性执行语句组1,如果语句组1
在执行过程中出现错误,则将错误信息赋 给保留的lasterr变量,并转去执行语句组2。
1
例3-7 矩阵乘法运算要求两矩阵的维数相容,否则 会出错。先求两矩阵的乘积,若出错,则自动转 去求两矩阵的点乘。
语句组m
else 语句组n
end 语句用于实现多分支选择结构。
1
例3-5 输入一个字符,若为大写字母,则输出其 对应的小写字母;若为小写字母,则输出其对应 的大写字母;若为数字字符则输出其对应的数值, 若为其他字符则原样输出。 c=input('请输入一个字符','s'); if c>='A' & c<='Z' disp(setstr(abs(c)+abs('a')-abs('A'))); elseif c>='a'& c<='z' disp(setstr(abs(c)- abs('a')+abs('A'))); elseif c>='0'& c<='9' disp(abs(c)-abs('0')); else disp(c); end
matlab编程实例100例
1-32是:图形应用篇33-66是:界面设计篇67-84是:图形处理篇85-100是:数值分析篇实例2:三角函数曲线(2)function shili02h0=figure('toolbar','none',...'position',[200 150 450 350],...'name','实例02');x=-pi:0.05:pi;y=sin(x)+cos(x);plot(x,y,'-*r','linewidth',1);grid onxlabel('自变量X');ylabel('函数值Y');title('三角函数');实例3:图形的叠加function shili03h0=figure('toolbar','none',...'position',[200 150 450 350],...'name','实例03');x=-pi:0.05:pi;y1=sin(x);y2=cos(x);plot(x,y1,...'-*r',...x,y2,...'--og');grid onxlabel('自变量X');ylabel('函数值Y');title('三角函数');实例4:双y轴图形的绘制function shili04h0=figure('toolbar','none',...'position',[200 150 450 250],...'name','实例04');x=0:900;a=1000;b=0.005;y1=2*x;y2=cos(b*x);[haxes,hline1,hline2]=plotyy(x,y1,x,y2,'semilogy','plot'); axes(haxes(1))ylabel('semilog plot');axes(haxes(2))ylabel('linear plot');实例6:图形标注function shili06h0=figure('toolbar','none',...'position',[200 150 450 400],...'name','实例06');t=0:pi/10:2*pi;h=plot(t,sin(t));xlabel('t=0到2\pi','fontsize',16);ylabel('sin(t)','fontsize',16);title('\it{从0to2\pi 的正弦曲线}','fontsize',16)x=get(h,'xdata');y=get(h,'ydata');imin=find(min(y)==y);imax=find(max(y)==y);text(x(imin),y(imin),...['\leftarrow最小值=',num2str(y(imin))],...'fontsize',16)text(x(imax),y(imax),...['\leftarrow最大值=',num2str(y(imax))],...'fontsize',16)实例7:条形图形function shili07h0=figure('toolbar','none',...'position',[200 150 450 350],...'name','实例07');tiao1=[562 548 224 545 41 445 745 512];tiao2=[47 48 57 58 54 52 65 48];t=0:7;bar(t,tiao1)xlabel('X轴');ylabel('TIAO1值');h1=gca;h2=axes('position',get(h1,'position'));plot(t,tiao2,'linewidth',3)set(h2,'yaxislocation','right','color','none','xticklabel',[]) 实例8:区域图形function shili08h0=figure('toolbar','none',...'position',[200 150 450 250],...'name','实例08');x=91:95;profits1=[88 75 84 93 77];profits2=[51 64 54 56 68];profits3=[42 54 34 25 24];profits4=[26 38 18 15 4];area(x,profits1,'facecolor',[0.5 0.9 0.6],...'edgecolor','b',...'linewidth',3)hold onarea(x,profits2,'facecolor',[0.9 0.85 0.7],...'edgecolor','y',...'linewidth',3)hold onarea(x,profits3,'facecolor',[0.3 0.6 0.7],...'edgecolor','r',...'linewidth',3)hold onarea(x,profits4,'facecolor',[0.6 0.5 0.9],...'edgecolor','m',...'linewidth',3)hold offset(gca,'xtick',[91:95])set(gca,'layer','top')gtext('\leftarrow第一季度销量')gtext('\leftarrow第二季度销量')gtext('\leftarrow第三季度销量')gtext('\leftarrow第四季度销量')xlabel('年','fontsize',16);ylabel('销售量','fontsize',16);实例9:饼图的绘制function shili09h0=figure('toolbar','none',...'position',[200 150 450 250],...'name','实例09');t=[54 21 35;68 54 35;45 25 12;48 68 45;68 54 69];x=sum(t);h=pie(x);textobjs=findobj(h,'type','text');str1=get(textobjs,{'string'});val1=get(textobjs,{'extent'});oldext=cat(1,val1{:});names={'商品一:';'商品二:';'商品三:'};str2=strcat(names,str1);set(textobjs,{'string'},str2)val2=get(textobjs,{'extent'});newext=cat(1,val2{:});offset=sign(oldext(:,1)).*(newext(:,3)-oldext(:,3))/2; pos=get(textobjs,{'position'});textpos=cat(1,pos{:});textpos(:,1)=textpos(:,1)+offset;set(textobjs,{'position'},num2cell(textpos,[3,2]))实例10:阶梯图function shili10h0=figure('toolbar','none',...'position',[200 150 450 400],...'name','实例10');a=0.01;b=0.5;t=0:10;f=exp(-a*t).*sin(b*t);stairs(t,f)hold onplot(t,f,':*')hold offglabel='函数e^{-(\alpha*t)}sin\beta*t的阶梯图'; gtext(glabel,'fontsize',16)xlabel('t=0:10','fontsize',16)axis([0 10 -1.2 1.2])实例11:枝干图function shili11h0=figure('toolbar','none',...'position',[200 150 450 350],...'name','实例11');x=0:pi/20:2*pi;y1=sin(x);y2=cos(x);h1=stem(x,y1+y2);hold onh2=plot(x,y1,'^r',x,y2,'*g');hold offh3=[h1(1);h2];legend(h3,'y1+y2','y1=sin(x)','y2=cos(x)') xlabel('自变量X');ylabel('函数值Y');title('正弦函数与余弦函数的线性组合'); 实例12:罗盘图function shili12h0=figure('toolbar','none',...'position',[200 150 450 250],...'name','实例12');winddirection=[54 24 65 84256 12 235 62125 324 34 254];windpower=[2 5 5 36 8 12 76 14 10 8];rdirection=winddirection*pi/180;[x,y]=pol2cart(rdirection,windpower); compass(x,y);desc={'风向和风力','北京气象台','10月1日0:00到','10月1日12:00'};gtext(desc)实例13:轮廓图function shili13h0=figure('toolbar','none',...'position',[200 150 450 250],...'name','实例13');[th,r]=meshgrid((0:10:360)*pi/180,0:0.05:1); [x,y]=pol2cart(th,r);z=x+i*y;f=(z.^4-1).^(0.25);contour(x,y,abs(f),20)axis equalxlabel('实部','fontsize',16);ylabel('虚部','fontsize',16);h=polar([0 2*pi],[0 1]);delete(h)hold oncontour(x,y,abs(f),20)实例14:交互式图形function shili14h0=figure('toolbar','none',...'position',[200 150 450 250],...'name','实例14');axis([0 10 0 10]);hold onx=[];y=[];n=0;disp('单击鼠标左键点取需要的点'); disp('单击鼠标右键点取最后一个点'); but=1;while but==1[xi,yi,but]=ginput(1);plot(xi,yi,'bo')n=n+1;disp('单击鼠标左键点取下一个点');x(n,1)=xi;y(n,1)=yi;endt=1:n;ts=1:0.1:n;xs=spline(t,x,ts);ys=spline(t,y,ts);plot(xs,ys,'r-');hold off实例14:交互式图形function shili14h0=figure('toolbar','none',...'position',[200 150 450 250],...'name','实例14');axis([0 10 0 10]);hold onx=[];y=[];n=0;disp('单击鼠标左键点取需要的点'); disp('单击鼠标右键点取最后一个点'); but=1;while but==1[xi,yi,but]=ginput(1);plot(xi,yi,'bo')n=n+1;disp('单击鼠标左键点取下一个点');x(n,1)=xi;y(n,1)=yi;endt=1:n;ts=1:0.1:n;xs=spline(t,x,ts);ys=spline(t,y,ts);plot(xs,ys,'r-');hold off实例15:变换的傅立叶函数曲线function shili15h0=figure('toolbar','none',...'position',[200 150 450 250],...'name','实例15');axis equalm=moviein(20,gcf);set(gca,'nextplot','replacechildren')h=uicontrol('style','slider','position',...[100 10 500 20],'min',1,'max',20)for j=1:20plot(fft(eye(j+16)))set(h,'value',j)m(:,j)=getframe(gcf);endclf;axes('position',[0 0 1 1]);movie(m,30)实例16:劳伦兹非线形方程的无序活动function shili15h0=figure('toolbar','none',...'position',[200 150 450 250],...'name','实例15');axis equalm=moviein(20,gcf);set(gca,'nextplot','replacechildren') h=uicontrol('style','slider','position',...[100 10 500 20],'min',1,'max',20) for j=1:20plot(fft(eye(j+16)))set(h,'value',j)m(:,j)=getframe(gcf);endclf;axes('position',[0 0 1 1]);movie(m,30)实例17:填充图function shili17h0=figure('toolbar','none',...'position',[200 150 450 250],...'name','实例17');t=(1:2:15)*pi/8;x=sin(t);y=cos(t);fill(x,y,'r')axis square offtext(0,0,'STOP',...'color',[1 1 1],...'fontsize',50,...'horizontalalignment','center') 例18:条形图和阶梯形图function shili18h0=figure('toolbar','none',...'position',[200 150 450 250],...'name','实例18');subplot(2,2,1)x=-3:0.2:3;y=exp(-x.*x);bar(x,y)title('2-D Bar Chart')subplot(2,2,2)x=-3:0.2:3;y=exp(-x.*x);bar3(x,y,'r')title('3-D Bar Chart')subplot(2,2,3)x=-3:0.2:3;y=exp(-x.*x);stairs(x,y)title('Stair Chart')subplot(2,2,4)x=-3:0.2:3;y=exp(-x.*x);barh(x,y)title('Horizontal Bar Chart')实例19:三维曲线图function shili19h0=figure('toolbar','none',...'position',[200 150 450 400],...'name','实例19');subplot(2,1,1)x=linspace(0,2*pi);y1=sin(x);y2=cos(x);y3=sin(x)+cos(x);z1=zeros(size(x));z2=0.5*z1;z3=z1;plot3(x,y1,z1,x,y2,z2,x,y3,z3)grid onxlabel('X轴');ylabel('Y轴');zlabel('Z轴');title('Figure1:3-D Plot')subplot(2,1,2)x=linspace(0,2*pi);y1=sin(x);y2=cos(x);y3=sin(x)+cos(x);z1=zeros(size(x));z2=0.5*z1;z3=z1;plot3(x,z1,y1,x,z2,y2,x,z3,y3)grid onxlabel('X轴');ylabel('Y轴');zlabel('Z轴');title('Figure2:3-D Plot')实例20:图形的隐藏属性function shili20h0=figure('toolbar','none',...'position',[200 150 450 300],...'name','实例20');subplot(1,2,1)[x,y,z]=sphere(10);mesh(x,y,z)axis offtitle('Figure1:Opaque')hidden onsubplot(1,2,2)[x,y,z]=sphere(10);mesh(x,y,z)axis offtitle('Figure2:Transparent')hidden off实例21PEAKS函数曲线function shili21h0=figure('toolbar','none',...'position',[200 100 450 450],...'name','实例21');[x,y,z]=peaks(30);subplot(2,1,1)x=x(1,:);y=y(:,1);i=find(y>0.8&y<1.2);j=find(x>-0.6&x<0.5);z(i,j)=nan*z(i,j);surfc(x,y,z)xlabel('X轴');ylabel('Y轴');zlabel('Z轴');title('Figure1:surfc函数形成的曲面')subplot(2,1,2)x=x(1,:);y=y(:,1);i=find(y>0.8&y<1.2);j=find(x>-0.6&x<0.5);z(i,j)=nan*z(i,j);surfl(x,y,z)xlabel('X轴');ylabel('Y轴');zlabel('Z轴');title('Figure2:surfl函数形成的曲面') 实例22:片状图function shili22h0=figure('toolbar','none',...'position',[200 150 550 350],...'name','实例22');subplot(1,2,1)x=rand(1,20);y=rand(1,20);z=peaks(x,y*pi);t=delaunay(x,y);trimesh(t,x,y,z)hidden offtitle('Figure1:Triangular Surface Plot');subplot(1,2,2)x=rand(1,20);y=rand(1,20);z=peaks(x,y*pi);t=delaunay(x,y);trisurf(t,x,y,z)title('Figure1:Triangular Surface Plot'); 实例23:视角的调整function shili23h0=figure('toolbar','none',...'position',[200 150 450 350],...'name','实例23');x=-5:0.5:5;[x,y]=meshgrid(x);r=sqrt(x.^2+y.^2)+eps;z=sin(r)./r;subplot(2,2,1)surf(x,y,z)xlabel('X-axis')ylabel('Y-axis')zlabel('Z-axis')title('Figure1')view(-37.5,30)subplot(2,2,2)surf(x,y,z)xlabel('X-axis')ylabel('Y-axis')zlabel('Z-axis')title('Figure2')view(-37.5+90,30)subplot(2,2,3)surf(x,y,z)xlabel('X-axis')ylabel('Y-axis')zlabel('Z-axis')title('Figure3')view(-37.5,60)subplot(2,2,4)surf(x,y,z)xlabel('X-axis')ylabel('Y-axis')zlabel('Z-axis')title('Figure4')view(180,0)实例24:向量场的绘制function shili24h0=figure('toolbar','none',...'position',[200 150 450 350],...'name','实例24');subplot(2,2,1)z=peaks;ribbon(z)title('Figure1')subplot(2,2,2)[x,y,z]=peaks(15);[dx,dy]=gradient(z,0.5,0.5);contour(x,y,z,10)hold onquiver(x,y,dx,dy)hold offtitle('Figure2')subplot(2,2,3)[x,y,z]=peaks(15);[nx,ny,nz]=surfnorm(x,y,z);surf(x,y,z)hold onquiver3(x,y,z,nx,ny,nz)hold offtitle('Figure3')subplot(2,2,4)x=rand(3,5);y=rand(3,5);z=rand(3,5);c=rand(3,5);fill3(x,y,z,c)grid ontitle('Figure4')实例25:灯光定位function shili25h0=figure('toolbar','none',...'position',[200 150 450 250],...'name','实例25');vert=[1 1 1;1 2 1;2 2 1;2 1 1;1 1 2;12 2;2 2 2;2 1 2];fac=[1 2 3 4;2 6 7 3;4 3 7 8;15 8 4;1 2 6 5;5 6 7 8];grid offsphere(36)h=findobj('type','surface');set(h,'facelighting','phong',...'facecolor',...'interp',...'edgecolor',[0.4 0.4 0.4],...'backfacelighting',...hold onpatch('faces',fac,'vertices',vert,...'facecolor','y');light('position',[1 3 2]);light('position',[-3 -1 3]);material shinyaxis vis3d offhold off实例26:柱状图function shili26h0=figure('toolbar','none',...'position',[200 50 450 450],...'name','实例26');subplot(2,1,1)x=[5 2 18 7 39 8 65 5 54 3 2];bar(x)xlabel('X轴');ylabel('Y轴');title('第一子图');subplot(2,1,2)y=[5 2 18 7 39 8 65 5 54 3 2];barh(y)xlabel('X轴');ylabel('Y轴');title('第二子图');实例27:设置照明方式function shili27h0=figure('toolbar','none',...'position',[200 150 450 350],...'name','实例27');subplot(2,2,1)spherecamlight leftcamlight rightlighting flatcolorbaraxis offtitle('Figure1')subplot(2,2,2)sphereshading flatcamlight leftcamlight rightlighting gouraudcolorbaraxis offtitle('Figure2')subplot(2,2,3)sphereshading interpcamlight rightcamlight leftlighting phongcolorbaraxis offtitle('Figure3')subplot(2,2,4)sphereshading flatcamlight leftcamlight rightlighting nonecolorbaraxis offtitle('Figure4')实例28:羽状图function shili28h0=figure('toolbar','none',...'position',[200 150 450 350],...'name','实例28');subplot(2,1,1)alpha=90:-10:0;r=ones(size(alpha));m=alpha*pi/180;n=r*10;[u,v]=pol2cart(m,n);feather(u,v)title('羽状图')axis([0 20 0 10])subplot(2,1,2)t=0:0.5:10;x=0.05+i;y=exp(-x*t);feather(y)title('复数矩阵的羽状图')实例29:立体透视(1)function shili29h0=figure('toolbar','none',...'position',[200 150 450 250],...'name','实例29');[x,y,z]=meshgrid(-2:0.1:2,...-2:0.1:2,...-2:0.1:2);v=x.*exp(-x.^2-y.^2-z.^2);grid onfor i=-2:0.5:2;h1=surf(linspace(-2,2,20),...linspace(-2,2,20),...zeros(20)+i);rotate(h1,[1 -1 1],30)dx=get(h1,'xdata');dy=get(h1,'ydata');dz=get(h1,'zdata');delete(h1)slice(x,y,z,v,[-2 2],2,-2)hold onslice(x,y,z,v,dx,dy,dz)hold offaxis tightview(-5,10)drawnowend实例30:立体透视(2)function shili30h0=figure('toolbar','none',...'position',[200 150 450 250],...'name','实例30');[x,y,z]=meshgrid(-2:0.1:2,...-2:0.1:2,...-2:0.1:2);v=x.*exp(-x.^2-y.^2-z.^2);[dx,dy,dz]=cylinder;slice(x,y,z,v,[-2 2],2,-2)for i=-2:0.2:2h=surface(dx+i,dy,dz);rotate(h,[1 0 0],90)xp=get(h,'xdata');yp=get(h,'ydata');zp=get(h,'zdata');delete(h)hold onhs=slice(x,y,z,v,xp,yp,zp);axis tightxlim([-3 3])view(-10,35)drawnowdelete(hs)hold offend实例31:表面图形function shili31h0=figure('toolbar','none',...'position',[200 150 550 250],...'name','实例31');subplot(1,2,1)x=rand(100,1)*16-8;y=rand(100,1)*16-8;r=sqrt(x.^2+y.^2)+eps;z=sin(r)./r;xlin=linspace(min(x),max(x),33); ylin=linspace(min(y),max(y),33); [X,Y]=meshgrid(xlin,ylin);Z=griddata(x,y,z,X,Y,'cubic');mesh(X,Y,Z)axis tighthold onplot3(x,y,z,'.','Markersize',20)subplot(1,2,2)k=5;n=2^k-1;theta=pi*(-n:2:n)/n;phi=(pi/2)*(-n:2:n)'/n;X=cos(phi)*cos(theta);Y=cos(phi)*sin(theta);Z=sin(phi)*ones(size(theta)); colormap([0 0 0;1 1 1])C=hadamard(2^k);surf(X,Y,Z,C)axis square实例32:沿曲线移动的小球h0=figure('toolbar','none',...'position',[198****8468],...'name','实例32');h1=axes('parent',h0,...'position',[0.15 0.45 0.7 0.5],...'visible','on');t=0:pi/24:4*pi;y=sin(t);plot(t,y,'b')n=length(t);h=line('color',[0 0.5 0.5],...'linestyle','.',...'markersize',25,...'erasemode','xor');k1=uicontrol('parent',h0,...'style','pushbutton',...'position',[80 100 50 30],...'string','开始',...'callback',[...'i=1;',...'k=1;,',...'m=0;,',...'while 1,',...'if k==0,',...'break,',...'end,',...'if k~=0,',...'set(h,''xdata'',t(i),''ydata'',y(i)),',...'drawnow;,',...'i=i+1;,',...'if i>n,',...'m=m+1;,',...'i=1;,',...'end,',...'end,',...'end']);k2=uicontrol('parent',h0,...'style','pushbutton',...'position',[180 100 50 30],...'string','停止',...'callback',[...'k=0;,',...'set(e1,''string'',m),',...'p=get(h,''xdata'');,',...'q=get(h,''ydata'');,',...'set(e2,''string'',p);,',...'set(e3,''string'',q)']);k3=uicontrol('parent',h0,...'style','pushbutton',...'position',[280 100 50 30],...'string','关闭',...'callback','close');e1=uicontrol('parent',h0,...'style','edit',...'position',[60 30 60 20]);t1=uicontrol('parent',h0,...'style','text',...'string','循环次数',...'position',[60 50 60 20]);e2=uicontrol('parent',h0,...'style','edit',...'position',[180 30 50 20]);t2=uicontrol('parent',h0,...'style','text',...'string','终点的X坐标值',...'position',[155 50 100 20]);e3=uicontrol('parent',h0,...'style','edit',...'position',[300 30 50 20]);t3=uicontrol('parent',h0,...'style','text',...'string','终点的Y坐标值',...'position',[275 50 100 20]);实例33:曲线转换按钮h0=figure('toolbar','none',...'position',[200 150 450 250],...'name','实例33');x=0:0.5:2*pi;y=sin(x);h=plot(x,y);grid onhuidiao=[...'if i==1,',...'i=0;,',...'y=cos(x);,',...'delete(h),',...'set(hm,''string'',''正弦函数''),',...'h=plot(x,y);,',...'grid on,',...'else if i==0,',...'i=1;,',...'y=sin(x);,',...'set(hm,''string'',''余弦函数''),',...'delete(h),',...'h=plot(x,y);,',...'grid on,',...'end,',...'end'];hm=uicontrol(gcf,'style','pushbutton',...'string','余弦函数',...'callback',huidiao);i=1;set(hm,'position',[250 20 60 20]);set(gca,'position',[0.2 0.2 0.6 0.6])title('按钮的使用')hold on实例34:栅格控制按钮h0=figure('toolbar','none',...'position',[200 150 450 250],...'name','实例34');x=0:0.5:2*pi;y=sin(x);plot(x,y)huidiao1=[...'set(h_toggle2,''value'',0),',...'grid on,',...];huidiao2=[...'set(h_toggle1,''value'',0),',...'grid off,',...];h_toggle1=uicontrol(gcf,'style','togglebutton',...'string','grid on',...'value',0,...'position',[20 45 50 20],...'callback',huidiao1);h_toggle2=uicontrol(gcf,'style','togglebutton',...'string','grid off',...'value',0,...'position',[20 20 50 20],...'callback',huidiao2);set(gca,'position',[0.2 0.2 0.6 0.6])title('开关按钮的使用')实例35:编辑框的使用h0=figure('toolbar','none',...'position',[200 150 350 250],...'name','实例35');f='Please input the letter';huidiao1=[...'g=upper(f);,',...'set(h2_edit,''string'',g),',...];huidiao2=[...'g=lower(f);,',...'set(h2_edit,''string'',g),',...];h1_edit=uicontrol(gcf,'style','edit',...'position',[100 200 100 50],...'HorizontalAlignment','left',...'string','Please input the letter',...'callback','f=get(h1_edit,''string'');',...'background','w',...'max',5,...'min',1);h2_edit=uicontrol(gcf,'style','edit',...'HorizontalAlignment','left',...'position',[100 100 100 50],...'background','w',...'max',5,...'min',1);h1_button=uicontrol(gcf,'style','pushbutton',...'string','小写变大写',...'position',[100 45 100 20],...'callback',huidiao1);h2_button=uicontrol(gcf,'style','pushbutton',...'string','大写变小写',...'position',[100 20 100 20],...'callback',huidiao2);实例36:弹出式菜单h0=figure('toolbar','none',...'position',[200 150 450 250],...'name','实例36');x=0:0.5:2*pi;y=sin(x);h=plot(x,y);grid onhm=uicontrol(gcf,'style','popupmenu',...'string',...'sin(x)|cos(x)|sin(x)+cos(x)|exp(-sin(x))',...'position',[250 20 50 20]);set(hm,'value',1)huidiao=[...'v=get(hm,''value'');,',...'switch v,',...'case 1,',...'delete(h),',...'y=sin(x);,',...'h=plot(x,y);,',...'grid on,',...'case 2,',...'delete(h),',...'y=cos(x);,',...'h=plot(x,y);,',...'grid on,',...'case 3,',...'delete(h),',...'y=sin(x)+cos(x);,',...'h=plot(x,y);,',...'grid on,',...'case 4,',...'delete(h),',...'y=exp(-sin(x));,',...'h=plot(x,y);,',...'grid on,',...'end'];set(hm,'callback',huidiao)set(gca,'position',[0.2 0.2 0.6 0.6]) title('弹出式菜单的使用')实例37:滑标的使用h0=figure('toolbar','none',...'position',[200 150 450 250],...'name','实例37');[x,y]=meshgrid(-8:0.5:8);r=sqrt(x.^2+y.^2)+eps;z=sin(r)./r;h0=mesh(x,y,z);h1=axes('position',...[0.2 0.2 0.5 0.5],...'visible','off');htext=uicontrol(gcf,...'units','points',...'position',[20 30 45 15],...'string','brightness',...'style','text');hslider=uicontrol(gcf,...'units','points',...'position',[10 10 300 15],...'min',-1,...'max',1,...'style','slider',...'callback',...'brighten(get(hslider,''value''))'); 实例38:多选菜单h0=figure('toolbar','none',...'position',[200 150 450 250],...'name','实例38');[x,y]=meshgrid(-8:0.5:8);r=sqrt(x.^2+y.^2)+eps;z=sin(r)./r;h0=mesh(x,y,z);hlist=uicontrol(gcf,'style','listbox',...'string','default|spring|summer|autumn|winter',...'max',5,...'min',1,...'position',[20 20 80 100],...'callback',[...'k=get(hlist,''value'');,',...'switch k,',...'case 1,',...'colormap default,',...'case 2,',...'colormap spring,',...'case 3,',...'colormap summer,',...'case 4,',...'colormap autumn,',...'case 5,',...'colormap winter,',...'end']);实例39:菜单控制的使用h0=figure('toolbar','none',...'position',[200 150 450 250],...'name','实例39');x=0:0.5:2*pi;y=cos(x);h=plot(x,y);grid onset(gcf,'toolbar','none')hm=uimenu('label','example');huidiao1=[...'set(hm_gridon,''checked'',''on''),',...'set(hm_gridoff,''checked'',''off''),',...'grid on'];huidiao2=[...'set(hm_gridoff,''checked'',''on''),',...'set(hm_gridon,''checked'',''off''),',...'grid off'];hm_gridon=uimenu(hm,'label','grid on',...'checked','on',...'callback',huidiao1);hm_gridoff=uimenu(hm,'label','grid off',...'checked','off',...'callback',huidiao2);实例40:UIMENU菜单的应用h0=figure('toolbar','none',...'position',[200 150 450 250],...'name','实例40');h1=uimenu(gcf,'label','函数');h11=uimenu(h1,'label','轮廓图',...'callback',[...'set(h31,''checked'',''on''),',...'set(h32,''checked'',''off''),',...'[x,y,z]=peaks;,',...'contour3(x,y,z,30)']);h12=uimenu(h1,'label','高斯分布',...'callback',[...'set(h31,''checked'',''on''),',...'set(h32,''checked'',''off''),',...'mesh(peaks);,',...'axis tight']);h13=uimenu(h1,'label','Sinc函数',...'callback',[...'set(h31,''checked'',''on''),',...'set(h32,''checked'',''off''),',...'[x,y]=meshgrid(-8:0.5:8);,',...'r=sqrt(x.^2+y.^2)+eps;,',...'z=sin(r)./r;,',...'mesh(x,y,z)']);h2=uimenu(gcf,'label','色彩');hl2(1)=uimenu(h2,'label','Default',...'checked','on',...'callback',...[...'set(hl2,''checked'',''off''),',...'set(hl2(1),''checked'',''on''),',...'colormap(''default'')']);hl2(2)=uimenu(h2,'label','spring',...'callback',...[...'set(hl2,''checked'',''off''),',...'set(hl2(2),''checked'',''on''),',...'colormap(spring)']);hl2(3)=uimenu(h2,'label','Summer',...'callback',...[...'set(hl2,''checked'',''off''),',...。
matlab编程例题
matlab编程例题Matlab是一种高级的计算机编程语言和数学计算软件。
它具有强大的数据处理和可视化功能,可以用于各种科学计算、数据分析、模拟和建模等领域。
本文将介绍一些常见的Matlab编程例题,帮助初学者掌握Matlab的基本编程技能。
1. 矩阵运算矩阵是Matlab中最基本的数据类型之一,可以进行各种数学运算。
下面是一些矩阵运算的例子:a = [1 2 3; 4 5 6; 7 8 9]; %定义一个3×3的矩阵b = [10 20 30; 40 50 60; 70 80 90]; %定义另一个3×3的矩阵c = a + b; %矩阵加法d = a - b; %矩阵减法e = a * b; %矩阵乘法f = a' %矩阵转置运行上面的代码,可以得到以下结果:c =11 22 3344 55 6677 88 99d =-9 -18 -27-36 -45 -54-63 -72 -81e =300 360 420660 810 9601020 1260 1500f =1 4 72 5 83 6 92. 绘图Matlab具有强大的绘图功能,可以绘制各种二维和三维图形。
下面是一些绘图的例子:x = linspace(0, 2*pi, 100); %生成一个包含100个点的等间隔向量y = sin(x); %计算sin函数plot(x, y); %绘制sin函数图像z = peaks(25); %生成一个25×25的山峰矩阵surf(z); %绘制3D山峰图像运行上面的代码,可以得到以下结果:sin函数图像:3D山峰图像:3. 文件读写Matlab可以读写各种文件格式,包括文本文件、Excel文件、图像文件等。
下面是一些文件读写的例子:fid = fopen('data.txt', 'r'); %打开名为“data.txt”的文本文件data = fscanf(fid, '%f'); %读取文件中的数据fclose(fid); %关闭文件plot(data); %绘制数据图像A = xlsread('data.xlsx'); %读取名为“data.xlsx”的Excel 文件plot(A(:, 1), A(:, 2)); %绘制Excel文件中的数据图像运行上面的代码,可以得到以下结果:文本文件数据图像:Excel文件数据图像:4. 函数编写Matlab中的函数是一种可重复使用的代码块,可以让程序更加模块化和可读性更高。
matlab经典编程例题
以下各题均要求编程实现,并将程序贴在题目下方。
1.从键盘输入任意个正整数,以0结束,输出那些正整数中的素数。
clc;clear;zzs(1)=input('请输入正整数:');k=1;n=0;%素数个数while zzs(k)~=0flag=0;%是否是素数,是则为1for yz=2:sqrt(zzs(k))%因子从2至此数平方根if mod(zzs(k),yz)==0flag=1;break;%非素数跳出循环endendif flag==0&zzs(k)>1%忽略0和1的素数n=n+1;sus(n)=zzs(k);endk=k+1;zzs(k)=input('请输入正整数:');enddisp(['你共输入了' num2str(k-1) '个正整数。
它们是:'])disp(zzs(1:k-1))%不显示最后一个数0if n==0disp('这些数中没有素数!')%无素数时显示elsedisp('其中的素数是:')disp(sus)end2.若某数等于其所有因子(不含这个数本身)的和,则称其为完全数。
编程求10000以内所有的完全数。
clc;clear;wq=[];%完全数赋空数组for ii=2:10000yz=[];%ii 的因子赋空数组for jj=2:ii/2 %从2到ii/2考察是否为ii 的因子if mod(ii,jj)==0yz=[yz jj];%因子数组扩展,加上jjendendif ii==sum(yz)+1wq=[wq ii];%完全数数组扩展,加上iiendenddisp(['10000以内的完全数为:' num2str(wq)])%输出3.下列这组数据是美国1900—2000年人口的近似值(单位:百万)。
(1) 若.2c bt at y t y ++=的经验公式为与试编写程序计算出上式中的a 、b 、c;(2) 若.bt ae y t y =的经验公式为与试编写程序计算出上式中的a 、b;(3) 在一个坐标系下,画出数表中的散点图(红色五角星),c bx ax y ++=2中拟合曲线图(蓝色实心线),以及.bt ae y = (黑色点划线)。
数学建模中30道经典MATLAB程序
编程1、编写一程序,要求输入五个整数,然后由小到大排序再输出。
%输入n个数,然后由小到大输出a=input('输入数据:')n=length(a); %输入数据的长度i=1;j=1; %赋初值for i=1:n %需要进行n次比较for j=2:n %与相邻的进行n-1次比较if a(j-1)>a(j)b=a(j-1);a(j-1)=a(j);a(j)=b; %比较前者是否比后者大,大的就互换endendendfprintf(' %d',a) ;2、将一个整型数组的元素按逆序重新存放(如原序为:8,6,5,4改为4,5,6,8)。
function lin5a=input('输入数据:')n=length(a);%求输入a的长度for i=1:n/2b=a(i);a(i)=a(n+1-i);a(n+1-i)=b;endfprintf(' %d',a)3、输入一个字符,如果是大写字母,则将其转换成小写并输出,若是小写,则直接输出;若是非字母字符则打印:‘datarror’.function xin2a=input('输入数据:','s')if a>=65&a<=90fprintf('shuchu is %c\n',a+32);elseif a>=97&a<=122fprintf('shuchu is %c\n',a);elsea='dataerror';fprintf('shuchu is %s',a);end4、输入一个整数,写一程序输出它是几位数。
function lin6a=input('输入数据:','s')n=length(a)%求输入a的长度b=n;fprintf('weishu %d',b);end5、写一程序求1!+2!+ (10)function wi=1;j=1;s=0; %赋初值while i<=10j=j*i;s=s+j;i=i+1;endfprintf('s is %d\n',s);6、从键盘上输入a与n的值,计算sum=a+aa+aaa+aaaa+……(共n项)的和。
- 1、下载文档前请自行甄别文档内容的完整性,平台不提供额外的编辑、内容补充、找答案等附加服务。
- 2、"仅部分预览"的文档,不可在线预览部分如存在完整性等问题,可反馈申请退款(可完整预览的文档不适用该条件!)。
- 3、如文档侵犯您的权益,请联系客服反馈,我们会尽快为您处理(人工客服工作时间:9:00-18:30)。
以下各题均要求编程实现,并将程序贴在题目下方。
1.从键盘输入任意个正整数,以0结束,输出那些正整数中的素数。
clc;clear;
zzs(1)=input('请输入正整数:');k=1;
n=0;%素数个数
while zzs(k)~=0
flag=0;%是否是素数,是则为1
for yz=2:sqrt(zzs(k))%因子从2至此数平方根
if mod(zzs(k),yz)==0
flag=1;break;%非素数跳出循环
end
end
if flag==0&zzs(k)>1%忽略0和1的素数
n=n+1;sus(n)=zzs(k);
end
k=k+1;
zzs(k)=input('请输入正整数:');
end
disp(['你共输入了' num2str(k-1) '个正整数。
它们是:'])
disp(zzs(1:k-1))%不显示最后一个数0
if n==0
disp('这些数中没有素数!')%无素数时显示
else
disp('其中的素数是:')
disp(sus)
end
2.若某数等于其所有因子(不含这个数本身)的和,则称其为完全数。
编程求10000以内所有的完全数。
clc;clear;
wq=[];%完全数赋空数组
for ii=2:10000
yz=[];%ii 的因子赋空数组
for jj=2:ii/2 %从2到ii/2考察是否为ii 的因子
if mod(ii,jj)==0
yz=[yz jj];%因子数组扩展,加上jj
end
end
if ii==sum(yz)+1
wq=[wq ii];%完全数数组扩展,加上ii
end
end
disp(['10000以内的完全数为:' num2str(wq)])%输出
3.下列这组数据是美国1900—2000年人口的近似值(单位:百万)。
(1) 若.2c bt at y t y ++=的经验公式为与试编写程序计算出上式中的a 、b 、c;
(2) 若.bt ae y t y =的经验公式为与试编写程序计算出上式中的a 、b;
(3) 在一个坐标系下,画出数表中的散点图(红色五角星),c bx ax y ++=2中
拟合曲线图(蓝色实心线),以及.bt ae y = (黑色点划线)。
(4) 图形标注要求:无网格线,横标注“时间t ”,纵标注“人口数(百万)”,图形
标题“美国1900—2000年的人口数据”。
(5) 程序中要有注释,将你的程序和作好的图粘贴到这里。
clf;clc;clear %清除图形窗、屏幕、工作空间
t=1900:10:2000;
y=[76 92 106 123 132 151 179 203 227 250 281];
p1=polyfit(t,y,2);%二次多项式拟合
y1=polyval(p1,t);%求拟合多项式函数值 …..﹙1﹚ % 显示拟合多项式及其系数a,b,c
disp(char(['y=' poly2str(p1,'t')],['a=' num2str(p1(1)) ' ' 'b=' num2str(p1(2)) ' ' 'c=' num2str(p1(3))])); …..﹙2﹚ yy=log(y);%指数拟合必需的线性化变形
p2=polyfit(t,yy,1);%拟合
b=p2(1);a=exp(p2(2));%求出指数拟合中的a,b
y2=a*exp(b*t);%指数拟合函数式
plot(t,y,'rp',t,y1,t,y2,'k-.');%三类数据作图 …..﹙3﹚ %图形窗的进一步设定
grid off;xlabel('时间t');ylabel('人口数(百万)'); …..﹙4﹚ title('美国1900—2000年的人口数据');
1900191019201930194019501960
1970198019902000
时间t 人口数(百万)美国1900—2000年的人口数据
4.附加题
某正整数的三次方是四位数,四次方是六位数,四位数和六位数的各位数字正好是0~9这十个数字,求此正整数。
clc;clear;
for ii=10:40%10的三次方是最小四位数,40的四次方超过六位i3=num2str(ii^3);i4=num2str(ii^4);%三四次方均转为字符
if length(i3)==4 & length(i4)==6%长度判断
i_34=sort([i3 i4]);%两数合并后升序排列
if isequal(i_34,char(48:57))%是否为0至9字符串
disp(['这个数是' num2str(ii)])
disp(['它的三次方是' i3 ',' '四次方是' i4])
end
end
end。