matlab典型例题
MATLAB习题及参考答案经典.doc
习题:1, 计算⎥⎦⎤⎢⎣⎡=572396a 与⎥⎦⎤⎢⎣⎡=864142b 的数组乘积。
2, 对于B AX =,如果⎥⎥⎥⎦⎤⎢⎢⎢⎣⎡=753467294A ,⎥⎥⎥⎦⎤⎢⎢⎢⎣⎡=282637B ,求解X 。
3, 已知:⎥⎥⎥⎦⎤⎢⎢⎢⎣⎡=987654321a ,分别计算a 的数组平方和矩阵平方,并观察其结果。
4, 角度[]604530=x ,求x 的正弦、余弦、正切和余切。
(应用sin,cos,tan.cot)5, 将矩阵⎥⎦⎤⎢⎣⎡=7524a 、⎥⎦⎤⎢⎣⎡=3817b 和⎥⎦⎤⎢⎣⎡=2695c 组合成两个新矩阵: (1)组合成一个4⨯3的矩阵,第一列为按列顺序排列的a 矩阵元素,第二列为按列顺序排列的b 矩阵元素,第三列为按列顺序排列的c 矩阵元素,即 ⎥⎥⎥⎥⎦⎤⎢⎢⎢⎢⎣⎡237912685574(2)按照a 、b 、c 的列顺序组合成一个行矢量,即 []2965318772546, 将(x -6)(x -3)(x -8)展开为系数多项式的形式。
(应用poly,polyvalm)7, 求解多项式x 3-7x 2+2x +40的根。
(应用roots)8, 求解在x =8时多项式(x -1)(x -2) (x -3)(x -4)的值。
(应用poly,polyvalm)9, 计算多项式9514124234++--x x x x 的微分和积分。
(应用polyder,polyint ,poly2sym)10, 解方程组⎥⎥⎥⎦⎤⎢⎢⎢⎣⎡=⎥⎥⎥⎦⎤⎢⎢⎢⎣⎡66136221143092x 。
(应用x=a\b)11, 求欠定方程组⎥⎦⎤⎢⎣⎡=⎥⎦⎤⎢⎣⎡5865394742x 的最小范数解。
(应用pinv) 12, 矩阵⎥⎥⎥⎦⎤⎢⎢⎢⎣⎡-=943457624a ,计算a 的行列式和逆矩阵。
(应用det,inv)13, y =sin(x ),x 从0到2π,∆x =0.02π,求y 的最大值、最小值、均值和标准差。
matlab编程实例100例
1-32是:图形应用篇33-66是:界面设计篇67-84是:图形处理篇85-100是:数值分析篇实例1:三角函数曲线(1)function shili01h0=figure('toolbar','none',...'position',[198 56 350 300],...'name','实例01');h1=axes('parent',h0,...'visible','off');x=-pi:0.05:pi;y=sin(x);plot(x,y);xlabel('自变量X');ylabel('函数值Y');title('SIN( )函数曲线');grid on实例2:三角函数曲线(2)function shili02h0=figure('toolbar','none',...'position',[200 150 450 350],...'name','实例02');x=-pi:0.05:pi;y=sin(x)+cos(x);plot(x,y,'-*r','linewidth',1);grid onxlabel('自变量X');ylabel('函数值Y');title('三角函数');实例3:图形的叠加function shili03h0=figure('toolbar','none',...'position',[200 150 450 350],...'name','实例03');x=-pi:0.05:pi;y1=sin(x);y2=cos(x);plot(x,y1,...'-*r',...x,y2,...'--og');grid onxlabel('自变量X');ylabel('函数值Y');title('三角函数');实例4:双y轴图形的绘制function shili04h0=figure('toolbar','none',...'position',[200 150 450 250],...'name','实例04');x=0:900;a=1000;b=0.005;y1=2*x;y2=cos(b*x);[haxes,hline1,hline2]=plotyy(x,y1,x,y2,'semilogy','plot'); axes(haxes(1))ylabel('semilog plot');axes(haxes(2))ylabel('linear plot');实例5:单个轴窗口显示多个图形function shili05h0=figure('toolbar','none',...'position',[200 150 450 250],...'name','实例05');t=0:pi/10:2*pi;[x,y]=meshgrid(t);subplot(2,2,1)plot(sin(t),cos(t))axis equalsubplot(2,2,2)z=sin(x)-cos(y);plot(t,z)axis([0 2*pi -2 2])subplot(2,2,3)h=sin(x)+cos(y);plot(t,h)axis([0 2*pi -2 2])subplot(2,2,4)g=(sin(x).^2)-(cos(y).^2);plot(t,g)axis([0 2*pi -1 1])实例6:图形标注function shili06h0=figure('toolbar','none',...'position',[200 150 450 400],...'name','实例06');t=0:pi/10:2*pi;h=plot(t,sin(t));xlabel('t=0到2\pi','fontsize',16);ylabel('sin(t)','fontsize',16);title('\it{从0to2\pi 的正弦曲线}','fontsize',16) x=get(h,'xdata');y=get(h,'ydata');imin=find(min(y)==y);imax=find(max(y)==y);text(x(imin),y(imin),...['\leftarrow最小值=',num2str(y(imin))],...'fontsize',16)text(x(imax),y(imax),...['\leftarrow最大值=',num2str(y(imax))],...'fontsize',16)实例7:条形图形function shili07h0=figure('toolbar','none',...'position',[200 150 450 350],...'name','实例07');tiao1=[562 548 224 545 41 445 745 512];tiao2=[47 48 57 58 54 52 65 48];t=0:7;bar(t,tiao1)xlabel('X轴');ylabel('TIAO1值');h1=gca;h2=axes('position',get(h1,'position'));plot(t,tiao2,'linewidth',3)set(h2,'yaxislocation','right','color','none','xticklabel',[]) 实例8:区域图形function shili08h0=figure('toolbar','none',...'position',[200 150 450 250],...'name','实例08');x=91:95;profits1=[88 75 84 93 77];profits2=[51 64 54 56 68];profits3=[42 54 34 25 24];profits4=[26 38 18 15 4];area(x,profits1,'facecolor',[0.5 0.9 0.6],...'edgecolor','b',...'linewidth',3)hold onarea(x,profits2,'facecolor',[0.9 0.85 0.7],...'edgecolor','y',...'linewidth',3)hold onarea(x,profits3,'facecolor',[0.3 0.6 0.7],...'edgecolor','r',...'linewidth',3)hold onarea(x,profits4,'facecolor',[0.6 0.5 0.9],...'edgecolor','m',...'linewidth',3)hold offset(gca,'xtick',[91:95])set(gca,'layer','top')gtext('\leftarrow第一季度销量')gtext('\leftarrow第二季度销量')gtext('\leftarrow第三季度销量')gtext('\leftarrow第四季度销量')xlabel('年','fontsize',16);ylabel('销售量','fontsize',16);实例9:饼图的绘制function shili09h0=figure('toolbar','none',...'position',[200 150 450 250],...'name','实例09');t=[54 21 35;68 54 35;45 25 12;48 68 45;68 54 69];x=sum(t);h=pie(x);textobjs=findobj(h,'type','text');str1=get(textobjs,{'string'});val1=get(textobjs,{'extent'});oldext=cat(1,val1{:});names={'商品一:';'商品二:';'商品三:'};str2=strcat(names,str1);set(textobjs,{'string'},str2)val2=get(textobjs,{'extent'});newext=cat(1,val2{:});offset=sign(oldext(:,1)).*(newext(:,3)-oldext(:,3))/2; pos=get(textobjs,{'position'});textpos=cat(1,pos{:});textpos(:,1)=textpos(:,1)+offset;set(textobjs,{'position'},num2cell(textpos,[3,2]))实例10:阶梯图function shili10h0=figure('toolbar','none',...'position',[200 150 450 400],...'name','实例10');a=0.01;b=0.5;t=0:10;f=exp(-a*t).*sin(b*t);stairs(t,f)hold onplot(t,f,':*')hold offglabel='函数e^{-(\alpha*t)}sin\beta*t的阶梯图'; gtext(glabel,'fontsize',16)xlabel('t=0:10','fontsize',16)axis([0 10 -1.2 1.2])实例11:枝干图function shili11h0=figure('toolbar','none',...'position',[200 150 450 350],...'name','实例11');x=0:pi/20:2*pi;y1=sin(x);y2=cos(x);h1=stem(x,y1+y2);hold onh2=plot(x,y1,'^r',x,y2,'*g');hold offh3=[h1(1);h2];legend(h3,'y1+y2','y1=sin(x)','y2=cos(x)') xlabel('自变量X');ylabel('函数值Y');title('正弦函数与余弦函数的线性组合');实例12:罗盘图function shili12h0=figure('toolbar','none',...'position',[200 150 450 250],...'name','实例12');winddirection=[54 24 65 84256 12 235 62125 324 34 254];windpower=[2 5 5 36 8 12 76 14 10 8];rdirection=winddirection*pi/180;[x,y]=pol2cart(rdirection,windpower); compass(x,y);desc={'风向和风力','气象台','10月1日0:00到','10月1日12:00'};gtext(desc)实例13:轮廓图function shili13h0=figure('toolbar','none',...'position',[200 150 450 250],...'name','实例13');[th,r]=meshgrid((0:10:360)*pi/180,0:0.05:1); [x,y]=pol2cart(th,r);z=x+i*y;f=(z.^4-1).^(0.25);contour(x,y,abs(f),20)axis equalxlabel('实部','fontsize',16);ylabel('虚部','fontsize',16);h=polar([0 2*pi],[0 1]);delete(h)hold oncontour(x,y,abs(f),20)实例14:交互式图形function shili14h0=figure('toolbar','none',...'position',[200 150 450 250],...'name','实例14');axis([0 10 0 10]);hold onx=[];y=[];n=0;disp('单击鼠标左键点取需要的点'); disp('单击鼠标右键点取最后一个点'); but=1;while but==1[xi,yi,but]=ginput(1);plot(xi,yi,'bo')n=n+1;disp('单击鼠标左键点取下一个点');x(n,1)=xi;y(n,1)=yi;endt=1:n;ts=1:0.1:n;xs=spline(t,x,ts);ys=spline(t,y,ts);plot(xs,ys,'r-');hold off实例14:交互式图形function shili14h0=figure('toolbar','none',...'position',[200 150 450 250],...'name','实例14');axis([0 10 0 10]);hold onx=[];y=[];n=0;disp('单击鼠标左键点取需要的点'); disp('单击鼠标右键点取最后一个点'); but=1;while but==1[xi,yi,but]=ginput(1);plot(xi,yi,'bo')n=n+1;disp('单击鼠标左键点取下一个点');x(n,1)=xi;y(n,1)=yi;endt=1:n;ts=1:0.1:n;xs=spline(t,x,ts);ys=spline(t,y,ts);plot(xs,ys,'r-');hold off实例15:变换的傅立叶函数曲线function shili15h0=figure('toolbar','none',...'position',[200 150 450 250],...'name','实例15');axis equalm=moviein(20,gcf);set(gca,'nextplot','replacechildren') h=uicontrol('style','slider','position',...[100 10 500 20],'min',1,'max',20) for j=1:20plot(fft(eye(j+16)))set(h,'value',j)m(:,j)=getframe(gcf);endclf;axes('position',[0 0 1 1]);movie(m,30)实例16:劳伦兹非线形方程的无序活动function shili15h0=figure('toolbar','none',...'position',[200 150 450 250],...'name','实例15');axis equalm=moviein(20,gcf);set(gca,'nextplot','replacechildren') h=uicontrol('style','slider','position',...[100 10 500 20],'min',1,'max',20) for j=1:20plot(fft(eye(j+16)))set(h,'value',j)m(:,j)=getframe(gcf);endclf;axes('position',[0 0 1 1]);movie(m,30)实例17:填充图function shili17h0=figure('toolbar','none',...'position',[200 150 450 250],...'name','实例17');t=(1:2:15)*pi/8;x=sin(t);y=cos(t);fill(x,y,'r')axis square offtext(0,0,'STOP',...'color',[1 1 1],...'fontsize',50,...'horizontalalignment','center') 例18:条形图和阶梯形图function shili18h0=figure('toolbar','none',...'position',[200 150 450 250],...'name','实例18');subplot(2,2,1)x=-3:0.2:3;y=exp(-x.*x);bar(x,y)title('2-D Bar Chart')subplot(2,2,2)x=-3:0.2:3;y=exp(-x.*x);bar3(x,y,'r')title('3-D Bar Chart')subplot(2,2,3)x=-3:0.2:3;y=exp(-x.*x);stairs(x,y)title('Stair Chart')subplot(2,2,4)x=-3:0.2:3;y=exp(-x.*x);barh(x,y)title('Horizontal Bar Chart')实例19:三维曲线图function shili19h0=figure('toolbar','none',...'position',[200 150 450 400],...'name','实例19');subplot(2,1,1)x=linspace(0,2*pi);y1=sin(x);y2=cos(x);y3=sin(x)+cos(x);z1=zeros(size(x));z2=0.5*z1;z3=z1;plot3(x,y1,z1,x,y2,z2,x,y3,z3)grid onxlabel('X轴');ylabel('Y轴');zlabel('Z轴');title('Figure1:3-D Plot')subplot(2,1,2)x=linspace(0,2*pi);y1=sin(x);y2=cos(x);y3=sin(x)+cos(x);z1=zeros(size(x));z2=0.5*z1;z3=z1;plot3(x,z1,y1,x,z2,y2,x,z3,y3)grid onxlabel('X轴');ylabel('Y轴');zlabel('Z轴');title('Figure2:3-D Plot')实例20:图形的隐藏属性function shili20h0=figure('toolbar','none',...'position',[200 150 450 300],...'name','实例20');subplot(1,2,1)[x,y,z]=sphere(10);mesh(x,y,z)axis offtitle('Figure1:Opaque')hidden onsubplot(1,2,2)[x,y,z]=sphere(10);mesh(x,y,z)axis offtitle('Figure2:Transparent') hidden off实例21PEAKS函数曲线function shili21h0=figure('toolbar','none',...'position',[200 100 450 450],...'name','实例21');[x,y,z]=peaks(30);subplot(2,1,1)x=x(1,:);y=y(:,1);i=find(y>0.8&y<1.2);j=find(x>-0.6&x<0.5);z(i,j)=nan*z(i,j);surfc(x,y,z)xlabel('X轴');ylabel('Y轴');zlabel('Z轴');title('Figure1:surfc函数形成的曲面') subplot(2,1,2)x=x(1,:);y=y(:,1);i=find(y>0.8&y<1.2);j=find(x>-0.6&x<0.5);z(i,j)=nan*z(i,j);surfl(x,y,z)xlabel('X轴');ylabel('Y轴');zlabel('Z轴');title('Figure2:surfl函数形成的曲面')实例22:片状图function shili22h0=figure('toolbar','none',...'position',[200 150 550 350],...'name','实例22');subplot(1,2,1)x=rand(1,20);y=rand(1,20);z=peaks(x,y*pi);t=delaunay(x,y);trimesh(t,x,y,z)hidden offtitle('Figure1:Triangular Surface Plot'); subplot(1,2,2)x=rand(1,20);y=rand(1,20);z=peaks(x,y*pi);t=delaunay(x,y);trisurf(t,x,y,z)title('Figure1:Triangular Surface Plot'); 实例23:视角的调整function shili23h0=figure('toolbar','none',...'position',[200 150 450 350],...'name','实例23');x=-5:0.5:5;[x,y]=meshgrid(x);r=sqrt(x.^2+y.^2)+eps;z=sin(r)./r;subplot(2,2,1)surf(x,y,z)xlabel('X-axis')ylabel('Y-axis')zlabel('Z-axis')title('Figure1')view(-37.5,30)subplot(2,2,2)surf(x,y,z)xlabel('X-axis')ylabel('Y-axis')zlabel('Z-axis')title('Figure2')view(-37.5+90,30)subplot(2,2,3)surf(x,y,z)xlabel('X-axis')ylabel('Y-axis')zlabel('Z-axis')title('Figure3')view(-37.5,60)subplot(2,2,4)surf(x,y,z)xlabel('X-axis')ylabel('Y-axis')zlabel('Z-axis')title('Figure4')view(180,0)实例24:向量场的绘制function shili24h0=figure('toolbar','none',...'position',[200 150 450 350],...'name','实例24');subplot(2,2,1)z=peaks;ribbon(z)title('Figure1')subplot(2,2,2)[x,y,z]=peaks(15);[dx,dy]=gradient(z,0.5,0.5); contour(x,y,z,10)hold onquiver(x,y,dx,dy)hold offtitle('Figure2')subplot(2,2,3)[x,y,z]=peaks(15);[nx,ny,nz]=surfnorm(x,y,z);surf(x,y,z)hold onquiver3(x,y,z,nx,ny,nz)hold offtitle('Figure3')subplot(2,2,4)x=rand(3,5);y=rand(3,5);z=rand(3,5);c=rand(3,5);fill3(x,y,z,c)grid ontitle('Figure4')实例25:灯光定位function shili25h0=figure('toolbar','none',...'position',[200 150 450 250],...'name','实例25');vert=[1 1 1;1 2 1;2 2 1;2 1 1;1 1 2;12 2;2 2 2;2 1 2];fac=[1 2 3 4;2 6 7 3;4 3 7 8;15 8 4;1 2 6 5;5 6 7 8];grid offsphere(36)h=findobj('type','surface');set(h,'facelighting','phong',...'facecolor',...'interp',...'edgecolor',[0.4 0.4 0.4],...'backfacelighting',...'lit')hold onpatch('faces',fac,'vertices',vert,...'facecolor','y');light('position',[1 3 2]);light('position',[-3 -1 3]); material shinyaxis vis3d offhold off实例26:柱状图function shili26h0=figure('toolbar','none',...'position',[200 50 450 450],...'name','实例26');subplot(2,1,1)x=[5 2 18 7 39 8 65 5 54 3 2];bar(x)xlabel('X轴');ylabel('Y轴');title('第一子图');subplot(2,1,2)y=[5 2 18 7 39 8 65 5 54 3 2];barh(y)xlabel('X轴');ylabel('Y轴');title('第二子图');实例27:设置照明方式function shili27h0=figure('toolbar','none',...'position',[200 150 450 350],...'name','实例27');subplot(2,2,1)sphereshading flatcamlight leftcamlight rightlighting flatcolorbaraxis offtitle('Figure1')subplot(2,2,2)sphereshading flatcamlight leftcamlight rightlighting gouraudcolorbaraxis offtitle('Figure2')subplot(2,2,3)sphereshading interpcamlight rightcamlight leftlighting phongcolorbaraxis offtitle('Figure3')subplot(2,2,4)sphereshading flatcamlight leftcamlight rightlighting nonecolorbaraxis offtitle('Figure4')实例28:羽状图function shili28h0=figure('toolbar','none',...'position',[200 150 450 350],...'name','实例28');subplot(2,1,1)alpha=90:-10:0;r=ones(size(alpha));m=alpha*pi/180;n=r*10;[u,v]=pol2cart(m,n);feather(u,v)title('羽状图')axis([0 20 0 10])subplot(2,1,2)t=0:0.5:10;x=0.05+i;y=exp(-x*t);feather(y)title('复数矩阵的羽状图')实例29:立体透视(1)function shili29h0=figure('toolbar','none',...'position',[200 150 450 250],...'name','实例29');[x,y,z]=meshgrid(-2:0.1:2,...-2:0.1:2,...-2:0.1:2);v=x.*exp(-x.^2-y.^2-z.^2);grid onfor i=-2:0.5:2;h1=surf(linspace(-2,2,20),...linspace(-2,2,20),...zeros(20)+i);rotate(h1,[1 -1 1],30)dx=get(h1,'xdata');dy=get(h1,'ydata');dz=get(h1,'zdata');delete(h1)slice(x,y,z,v,[-2 2],2,-2)hold onslice(x,y,z,v,dx,dy,dz)hold offaxis tightview(-5,10)drawnowend实例30:立体透视(2)function shili30h0=figure('toolbar','none',...'position',[200 150 450 250],...'name','实例30');[x,y,z]=meshgrid(-2:0.1:2,...-2:0.1:2,...-2:0.1:2);v=x.*exp(-x.^2-y.^2-z.^2); [dx,dy,dz]=cylinder;slice(x,y,z,v,[-2 2],2,-2)for i=-2:0.2:2h=surface(dx+i,dy,dz);rotate(h,[1 0 0],90)xp=get(h,'xdata');yp=get(h,'ydata');zp=get(h,'zdata');delete(h)hold onhs=slice(x,y,z,v,xp,yp,zp);axis tightxlim([-3 3])view(-10,35)drawnowdelete(hs)hold offend实例31:表面图形function shili31h0=figure('toolbar','none',...'position',[200 150 550 250],...'name','实例31');subplot(1,2,1)x=rand(100,1)*16-8;y=rand(100,1)*16-8;r=sqrt(x.^2+y.^2)+eps;z=sin(r)./r;xlin=linspace(min(x),max(x),33); ylin=linspace(min(y),max(y),33); [X,Y]=meshgrid(xlin,ylin);Z=griddata(x,y,z,X,Y,'cubic'); mesh(X,Y,Z)axis tighthold onplot3(x,y,z,'.','Markersize',20)subplot(1,2,2)k=5;n=2^k-1;theta=pi*(-n:2:n)/n;phi=(pi/2)*(-n:2:n)'/n;X=cos(phi)*cos(theta);Y=cos(phi)*sin(theta);Z=sin(phi)*ones(size(theta));colormap([0 0 0;1 1 1])C=hadamard(2^k);surf(X,Y,Z,C)axis square实例32:沿曲线移动的小球h0=figure('toolbar','none',...'position',[198 56 408 468],...'name','实例32');h1=axes('parent',h0,...'position',[0.15 0.45 0.7 0.5],...'visible','on');t=0:pi/24:4*pi;y=sin(t);plot(t,y,'b')n=length(t);h=line('color',[0 0.5 0.5],...'linestyle','.',...'markersize',25,...'erasemode','xor');k1=uicontrol('parent',h0,...'style','pushbutton',...'position',[80 100 50 30],...'string','开始',...'callback',[...'i=1;',...'k=1;,',...'m=0;,',...'while 1,',...'if k==0,',...'break,',...'end,',...'if k~=0,',...'set(h,''xdata'',t(i),''ydata'',y(i)),',...'drawnow;,',...'i=i+1;,',...'if i>n,',...'m=m+1;,',...'i=1;,',...'end,',...'end,',...'end']);k2=uicontrol('parent',h0,...'style','pushbutton',...'position',[180 100 50 30],...'string','停止',...'callback',[...'k=0;,',...'set(e1,''string'',m),',...'p=get(h,''xdata'');,',...'q=get(h,''ydata'');,',...'set(e2,''string'',p);,',...'set(e3,''string'',q)']); k3=uicontrol('parent',h0,...'style','pushbutton',...'position',[280 100 50 30],...'string','关闭',...'callback','close');e1=uicontrol('parent',h0,...'style','edit',...'position',[60 30 60 20]);t1=uicontrol('parent',h0,...'style','text',...'string','循环次数',...'position',[60 50 60 20]);e2=uicontrol('parent',h0,...'style','edit',...'position',[180 30 50 20]); t2=uicontrol('parent',h0,...'style','text',...'string','终点的X坐标值',...'position',[155 50 100 20]); e3=uicontrol('parent',h0,...'style','edit',...'position',[300 30 50 20]); t3=uicontrol('parent',h0,...'style','text',...'string','终点的Y坐标值',...'position',[275 50 100 20]);实例33:曲线转换按钮h0=figure('toolbar','none',...'position',[200 150 450 250],...'name','实例33');x=0:0.5:2*pi;y=sin(x);h=plot(x,y);grid onhuidiao=[...'if i==1,',...'i=0;,',...'y=cos(x);,',...'delete(h),',...'set(hm,''string'',''正弦函数''),',...'h=plot(x,y);,',...'grid on,',...'else if i==0,',...'i=1;,',...'y=sin(x);,',...'set(hm,''string'',''余弦函数''),',...'delete(h),',...'h=plot(x,y);,',...'grid on,',...'end,',...'end'];hm=uicontrol(gcf,'style','pushbutton',...'string','余弦函数',...'callback',huidiao);i=1;set(hm,'position',[250 20 60 20]);set(gca,'position',[0.2 0.2 0.6 0.6])title('按钮的使用')hold on实例34:栅格控制按钮h0=figure('toolbar','none',...'position',[200 150 450 250],...'name','实例34');x=0:0.5:2*pi;y=sin(x);plot(x,y)huidiao1=[...'set(h_toggle2,''value'',0),',...'grid on,',...];huidiao2=[...'set(h_toggle1,''value'',0),',...'grid off,',...];h_toggle1=uicontrol(gcf,'style','togglebutton',...'string','grid on',...'value',0,...'position',[20 45 50 20],...'callback',huidiao1);h_toggle2=uicontrol(gcf,'style','togglebutton',...'string','grid off',...'value',0,...'position',[20 20 50 20],...'callback',huidiao2);set(gca,'position',[0.2 0.2 0.6 0.6])title('开关按钮的使用')实例35:编辑框的使用h0=figure('toolbar','none',...'position',[200 150 350 250],...'name','实例35');f='Please input the letter';huidiao1=[...'g=upper(f);,',...'set(h2_edit,''string'',g),',...];huidiao2=[...'g=lower(f);,',...'set(h2_edit,''string'',g),',...];h1_edit=uicontrol(gcf,'style','edit',...'position',[100 200 100 50],...'HorizontalAlignment','left',...'string','Please input the letter',...'callback','f=get(h1_edit,''string'');',...'background','w',...'max',5,...'min',1);h2_edit=uicontrol(gcf,'style','edit',...'HorizontalAlignment','left',...'position',[100 100 100 50],...'max',5,...'min',1);h1_button=uicontrol(gcf,'style','pushbutton',...'string','小写变大写',...'position',[100 45 100 20],...'callback',huidiao1);h2_button=uicontrol(gcf,'style','pushbutton',...'string','大写变小写',...'position',[100 20 100 20],...'callback',huidiao2);实例36:弹出式菜单h0=figure('toolbar','none',...'position',[200 150 450 250],...'name','实例36');x=0:0.5:2*pi;y=sin(x);h=plot(x,y);grid onhm=uicontrol(gcf,'style','popupmenu',...'string',...'sin(x)|cos(x)|sin(x)+cos(x)|exp(-sin(x))',...'position',[250 20 50 20]);set(hm,'value',1)huidiao=[...'v=get(hm,''value'');,',...'switch v,',...'case 1,',...'delete(h),',...'y=sin(x);,',...'h=plot(x,y);,',...'grid on,',...'case 2,',...'delete(h),',...'y=cos(x);,',...'h=plot(x,y);,',...'grid on,',...'case 3,',...'delete(h),',...'y=sin(x)+cos(x);,',...'h=plot(x,y);,',...'grid on,',...'case 4,',...'y=exp(-sin(x));,',...'h=plot(x,y);,',...'grid on,',...'end'];set(hm,'callback',huidiao)set(gca,'position',[0.2 0.2 0.6 0.6])title('弹出式菜单的使用')实例37:滑标的使用h0=figure('toolbar','none',...'position',[200 150 450 250],...'name','实例37');[x,y]=meshgrid(-8:0.5:8);r=sqrt(x.^2+y.^2)+eps;z=sin(r)./r;h0=mesh(x,y,z);h1=axes('position',...[0.2 0.2 0.5 0.5],...'visible','off');htext=uicontrol(gcf,...'units','points',...'position',[20 30 45 15],...'string','brightness',...'style','text');hslider=uicontrol(gcf,...'units','points',...'position',[10 10 300 15],...'min',-1,...'max',1,...'style','slider',...'callback',...'brighten(get(hslider,''value''))');实例38:多选菜单h0=figure('toolbar','none',...'position',[200 150 450 250],...'name','实例38');[x,y]=meshgrid(-8:0.5:8);r=sqrt(x.^2+y.^2)+eps;z=sin(r)./r;h0=mesh(x,y,z);hlist=uicontrol(gcf,'style','listbox',...'string','default|spring|summer|autumn|winter',...'max',5,...'min',1,...'position',[20 20 80 100],...'callback',[...'k=get(hlist,''value'');,',...'switch k,',...'case 1,',...'colormap default,',...'case 2,',...'colormap spring,',...'case 3,',...'colormap summer,',...'case 4,',...'colormap autumn,',...'case 5,',...'colormap winter,',...'end']);实例39:菜单控制的使用h0=figure('toolbar','none',...'position',[200 150 450 250],...'name','实例39');x=0:0.5:2*pi;y=cos(x);h=plot(x,y);grid onset(gcf,'toolbar','none')hm=uimenu('label','example');huidiao1=[...'set(hm_gridon,''checked'',''on''),',...'set(hm_gridoff,''checked'',''off''),',...'grid on'];huidiao2=[...'set(hm_gridoff,''checked'',''on''),',...'set(hm_gridon,''checked'',''off''),',...'grid off'];hm_gridon=uimenu(hm,'label','grid on',...'checked','on',...'callback',huidiao1);hm_gridoff=uimenu(hm,'label','grid off',...'checked','off',...'callback',huidiao2);实例40:UIMENU菜单的应用。
matlab程序设计例题及答案
matlab程序设计例题及答案1.编写程序:计算1/3+2/5+3/7+……+10/21法一: s=0;for i=1:10s=s+i/(2*i+1); end ss =法二:sum((1:10)./(3:2:21)) ans =2.编写程序:计算1~100中即能被3整除,又能被7整除的所有数之和。
s=0;for i=1:100if mod(i,3)==0&&mod(i,7)==0 s=s+i; end,end ss =2103.画出y=n!的图,阶乘的函数自己编写,禁用MATLAB 自带的阶乘函数。
x=1:10; for i=1:10try y(i)=y(i-1)*i; catch y(i)=1; end,end plot(x,y)106123456789104.一个数恰好等于它的因子之和,这个数就称为完数。
例如,6的因子为1,2,3,而6=1+2+3,因此6就是一个完数。
编程找出20XX以内的所有完数。
g=;for n=2:20XX s=0;for r=1:n-1if mod(n,r)==0 s=s+r; end endif s==ng=[g n]; end end gg =6 28 4965.编写一个函数,模拟numel函数的功能,函数中调用size函数。
function y=numelnumel(x) m=size(x); y=m(1)*m(2);numelnumel([1 2 3;4 5 6])ans =66. 编写一个函数,模拟length函数的功能,函数中调用size函数。
function y=lengthlength(x) m=size(x);y=max(m(1),m(2));lengthlength([1 2 3;4 5 6])ans =37.求矩阵rand的所有元素和及各行平均值,各列平均值。
s=rand(5);sum=sum(sum(s)) mean2=mean(s,2) mean1=mean(s)sum =mean2 =mean1 =8.编程判断1001,1003,1007,1009,1011为素数,若不是,输出其约数。
matlab典型例题
例2.1>> muw0=1.785;>> a=0.03368;>> b=0.000221;>> t=0:20:80;>> muw=muw0./(1+a*t+b*t.^2)例2.2 数值数组和字符串的转换>> a=[1:5];>> b=num2str(a);>> a*2ans =2 4 6 8 10>> b*2ans =98 64 64 100 64 64 102 64 64 104 64 64 106例2.9比较左除和右除求解恰定方程>> rand('seed',12);>> a=rand(100)+1.e8;>> x=ones(100,1);>> b=a*x;>> cond(a)ans =5.0482e+011>> tic;x1=b'/a;t1=toct1 =0.4711>> er1=norm(x-x1')er1 =139.8326>> re1=norm(a*x1'-b)/norm(b)re1 =4.3095e-009>> tic;x1=a\b;t1=toct1 =0.0231>> tic;x1=a\b;t1=toct1 =0.0011>> er2=norm(x-x1)er2 =1.5893e-004>> re1=norm(a*x1-b)/norm(b)re1 =4.5257e-016例2.14:计算矩阵的指数>> b=magic(3);>> expm(b)ans =1.0e+006 *1.0898 1.0896 1.08971.0896 1.0897 1.08971.0896 1.0897 1.0897 例2.18:特征值条件数>> a=[-149 -50 -154;537 180 546; -27 -9 -25]a =-149 -50 -154537 180 546-27 -9 -25>> [V,D,s]=condeig(a)V =0.3162 -0.4041 -0.1391-0.9487 0.9091 0.9740-0.0000 0.1010 -0.1789D =1.0000 0 00 2.0000 00 0 3.0000例2.41 5阶多项式在【0,2pi】最小二乘拟合>> x=0:pi/20:pi/2;>> y=sin(x);>> a=polyfit(x,y,5);>> x1=0:pi/30:pi*2;>> y1=sin(x1);>> y2=a(1)*x1.^5+a(2)*x1.^4+a(3)*x1.^3+a(4)*x1.^2+a(5)*x1+a(6); >> plot(x1,y1,'b-',x1,y2,'r*')>> legend('原曲线','拟合曲线')>> axis([0,7,-1.2,4])例3.7 gradient绘制矢量图>> x=0:pi/20:pi/2;>> y=sin(x);>> a=polyfit(x,y,5);>> x1=0:pi/30:pi*2;>> y1=sin(x1);>> y2=a(1)*x1.^5+a(2)*x1.^4+a(3)*x1.^3+a(4)*x1.^2+a(5)*x1+a(6); >> plot(x1,y1,'b-',x1,y2,'r*')>> legend('原曲线','拟合曲线')>> axis([0,7,-1.2,4])>>>> [x,y]=meshgrid(-2:.2:2,-2:.2:2); >> z=x.*exp(-x.^2-y.^2);>> [px,py]=gradient(z,.2,.2);>> contour(z),>> hold on>> quiver(px,py)>> hold off例基本绘图命令rand(100,1);plot(y)例4.1 绘制如图>> x=1:0.1*pi:2*pi;>> y=sin(x);>> z=cos(x);>> plot(x,y,'--k',x,z,'-.rd')例4.5 绘制如图>> x=1:10;>> y=rand(10,1);>> bar(x,y);>> x=0:0.1*pi:2*pi;>> y=x.*sin(x);>> feather(x,y)例 4.6 绘制如图>> lim=[0,2*pi,-1,1];>> fplot('[sin(x),cos(x)]',lim)例4.7绘图如下>> x=[2,4,6,8];>> pie(x,{'math','english','chinese','music'}) 例4.9 绘图如下三维螺旋线>> x=0:pi/50:10*pi;>> y=sin(x);>> x=0:pi/50:10*pi;>> y=sin(x);>> z=cos(x);>> plot3(x,y,z);例4.10 绘图如下。
matlab的例题
浅议matlab 的功能和应用数值计算1、编程求满足∑=>mi i 1100002的最小m 值。
解:m=1; s=0;while s<=10000s=s+2^m; m=m+1;end m=m-1;di sp('m=');disp(m);运行结果:m=132、编写一个函数,计算下面函数的值,给出标量x 的值,调用该函数后,返回y 的值。
function [y]=myfun1(x)选择一些数据测试你编写的函数。
function y=myfun1(x) if x<=0y=sin(x); elseif x>0&x<=3 y=x; else y=6-x; end⎪⎩⎪⎨⎧>+-≤<≤=3,630,0,sin )(x x x x x x x yreturn ;3、编写一个函数,给出一个向量],,[21n x x x x=,生成如下范德蒙矩阵。
function [v]=myvander(x)⎥⎥⎥⎥⎥⎥⎦⎤⎢⎢⎢⎢⎢⎢⎣⎡---112112222121111n n n n n n x x x x x x x x x例如:>>v=myvander([2 3 4 5]) 得v=⎥⎥⎥⎥⎦⎤⎢⎢⎢⎢⎣⎡1256427825169454321111 生成一些数据测试你写的函数。
function [v]=myvander(x) n=length(x); v(1:n)=1; for i=n+1:n*n a=i/n;r=mod(i,n); b=floor(a); if r==0 r=n; b=b-1; endv(i)=x(r)^b; endv=reshape(v,n,n)';>> myvander([1 2 3])ans =1 1 11 2 3 1 4 9>> myvander([ 1 4 6 8])ans =1 1 1 1 1 4 6 8 1 16 36 64 1 64 216 512图像的绘制1、在同一坐标系下绘制下面三个函数在t ∈[0,4π]的图象。
matlab20道试题及解答
试题1.“数学黑洞”:任意一个4位自然数,将组成该数的各位数字重新排列,形成一个最大数和一个最小数,之后两数相减,其差仍为一个自然数。
重复进行上述运算,最终会出现一个神秘的数,请编程输出这个神秘的数。
clear;a=input('请输入一个四位正整数:');str_a=num2str(a); %将a转化为一个字符串b_min=str2double(sort(str_a)); %形成最小数b_max=str2double(sort(str_a,'descend')); %形成最大数b=b_max-b_min; %求最大数与最小数之差while (b~=a)a=b;str_a=num2str(a); %将a转化为一个字符串b_min=str2double(sort(str_a)); %形成最小数b_max=str2double(sort(str_a,'descend')); %形成最大数b=b_max-b_min; %求最大数与最小数之差endb试题2.将数字1、2、3、4、5、6填入一个2行3列的表格中,要使得每一列右边的数字比左边的数字大,每一行下面的数字比上面的数字大。
请编写程序求出按此要求可有几种填写方法。
a(1)=1;a(6)=6;count=0; %用来计数b=perms('2345'); %产生2345的全排列[m,n]=size(b);for i=1:mtemp=b(i,:);a(2)=str2double(temp(1));a(3)=str2double(temp(2));a(4)=str2double(temp(3));a(5)=str2double(temp(4));if ((a(4)>a(2))&&(a(4)>a(3))&&(a(5)>a(3)))count=count+1;c=reshape(a,2,3); %将a向量转化为2*3矩阵输出disp(c);endenddisp(['共有',num2str(count),'种填写方法']); %输出填写方法的种数试题3.编写成绩排序程序。
matlab 程序设计 例题

一、概述Matlab是一种强大的工程计算软件,在工程领域有着广泛的应用。
对于学习Matlab程序设计来说,通过例题学习是非常有效的方法。
通过实际的例题练习,可以帮助学生更深入地理解Matlab的基本原理和应用技巧。
本文将介绍几个常见的Matlab程序设计例题,并进行详细的分析和讲解,希望能够帮助读者加深对Matlab程序设计的理解。
二、例题一:矩阵运算题目:编写一个Matlab程序,实现两个任意大小的矩阵相加的运算。
1.我们需要定义两个任意大小的矩阵A和矩阵B,可以通过rand函数生成随机矩阵,也可以手动输入矩阵的元素。
2.编写Matlab程序,使用矩阵的加法运算符“+”进行矩阵相加操作。
3.输出矩阵相加的结果,并进行验证和检查。
通过这个例题,可以加深对Matlab矩阵运算的理解,包括矩阵的定义、矩阵相加的操作和结果输出的方法。
三、例题二:函数绘图题目:编写一个Matlab程序,绘制sin函数的曲线图像。
1.我们需要定义sin函数的自变量范围和取值步长,可以使用linspace函数生成自变量的取值范围。
2.编写Matlab程序,调用sin函数计算自变量对应的函数值。
3.接下来,使用plot函数绘制sin函数的曲线图像,并设置图像的标题、坐标轴标签等其他参数。
4.输出绘制好的sin函数曲线图像,并进行观察和分析。
通过这个例题,可以了解Matlab中函数绘图的基本方法,包括自变量的定义、函数值的计算和图像的绘制等操作。
四、例题三:数值积分题目:编写一个Matlab程序,实现对指定函数在指定区间上的数值积分。
1.我们需要定义积分的目标函数和积分区间,在Matlab中可以使用function定义目标函数,也可以手动输入目标函数和积分区间。
2.编写Matlab程序,调用Matlab内置的数值积分函数(如quad、quadl等)进行数值积分的计算。
3.输出数值积分的结果,并与解析解进行比较和分析。
通过这个例题,可以了解Matlab中数值积分的计算方法,包括目标函数的定义、积分区间的设定和数值积分函数的调用。
matLAB经典例题及答案
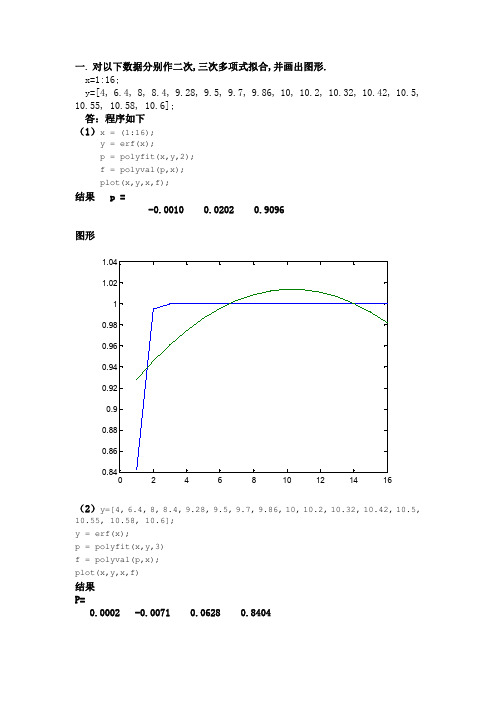
一.对以下数据分别作二次,三次多项式拟合,并画出图形.x=1:16;y=[4,6.4,8,8.4,9.28,9.5,9.7,9.86,10,10.2,10.32,10.42,10.5, 10.55,10.58,10.6];答:程序如下(1)x=(1:16);y=erf(x);p=polyfit(x,y,2);f=polyval(p,x);plot(x,y,x,f);结果p=-0.00100.02020.9096(2)y=[4,6.4,8,8.4,9.28,9.5,9.7,9.86,10,10.2,10.32,10.42,10.5, 10.55,10.58,10.6];y=erf(x);p=polyfit(x,y,3)f=polyval(p,x);plot(x,y,x,f)结果P=0.0002-0.00710.06280.8404二.在[0,4pi]画sin(x),cos(x)(在同一个图象中);其中cos(x)图象用红色小圆圈画.并在函数图上标注“y=sin(x)”,“y=cos(x)”,x轴,y轴,标题为“正弦余弦函数图象”.答:程序如下x=[0:720]*pi/180;plot(x,sin(x),x,cos(x),'ro');x=[2.5;7];y=[0;0];s=['y=sin(x)';'y=cos(x)'];text(x,y,s);xlabel('正弦余弦函数图象'),ylabel('正弦余弦函数图象')图形如下三.选择一个单自由度线性振动系统模型,自定质量、弹簧刚度、阻尼、激振力等一组参数,分别编程(m 文件)计算自由和强迫振动时的响应,并画出振动曲线图。
(要求画出该单自由度线性振动系统模型图)其中质量为m=1000kg,弹性刚度k=48020N/m,阻尼c=1960N.s/m,激振力f(t)=0.阻尼比ζ的程序p=1960/(2*sqrt(48020*1000))求得p=0.1414而p为阻尼比ζ强迫振动时的响应程序g =tf([-101],[48020048020*1.9848020]);bode(g)图形g =tf([001],[0001]);bode(g)振动曲线图程序:函数文件function dx =rigid(t,x)dx =zeros(2,1);dx(1)=x(2);dx(2)=(-48020*x(1)-1960*x(2))/1000;命令文件options =odeset('RelTol',1e-4,'AbsTol',[1e-41e-4]);[T,X]=ode45(@rigid,[012],[11],options);plot(T,X(:,1),'-')其图形如下024681012-6-5-4-3-2-11234单自由度线性强迫振动系统模型图其中质量为m=1000kg,弹性刚度k=48020N/m,阻尼c=1960N.s/m,f(t)=cos(3*pi*t)振动曲线图程序:函数文件function dx=rigid(t,x)dx=zeros(2,1);dx(1)=x(2);dx(2)=(-48020*x(1)-1960*x(2))/1000+cos(3*pi*t);命令文件options=odeset('RelTol',1e-4,'AbsTol',[1e-41e-4]);[T,X]=ode45(@rigid,[020],[11],options);plot(T,X(:,1),'-')力等一组参数,建立Simulink仿真模型框图进行仿真分析。
- 1、下载文档前请自行甄别文档内容的完整性,平台不提供额外的编辑、内容补充、找答案等附加服务。
- 2、"仅部分预览"的文档,不可在线预览部分如存在完整性等问题,可反馈申请退款(可完整预览的文档不适用该条件!)。
- 3、如文档侵犯您的权益,请联系客服反馈,我们会尽快为您处理(人工客服工作时间:9:00-18:30)。
【例】水资源系统规划调度常应用系统分析方法处理,以一个水资源分配问题为例,讨论线性规划问题。
例:有甲、乙两个水库同时给A、B、C三个城市供水,甲水库的日供水量为28万m3/d,乙水库的日供水量为35万m3/d,三个城市的日需水量分别为A≥10万m3/d,B≥15万m3/d,C≥20 万m3/d。
由于水库与各城市的距离不等,输水方式不同,因此单位水费也不同。
各单位水费分别为c11=2000元/万m3、c12=3000元/万m3、c13=4000元/万m3、c21=4500元/万m3、c22=3500元/万m3、c23=3000元/万m3。
试作出在满足对三个城市供水的情况下,输水费用最小的方案。
设甲水库向三城市日供水量分别为x ll、x12、x13,乙水库向三城市日供水量分别为x2l、x22、x23。
建立约束条件:
x11 + x21 ≥10
x12 + x22 ≥15
x13 + x23 ≥20
x11 + x12 + x13 ≤28
x21 + x22 + x23 ≤35
x11,x12,x13,x21,x22,x23,≥0
目标函数:
fmin=c11x11+c12x12+c13x13+c21x21+c22x22+c23x23
这样的问题单纯求解是非常繁琐的,而MLTLAB求解是十分简单的,只要在命令行输入:
》f=[0.2 0.3 0.4 0.45 0.35 0.3]’;
》A=[-1 0 0 -1 0 0;0 -1 0 0 -1 0;0 0 -1 0 0 -1;1 1 1 0 0 0;
0 0 0 1 1 1];
》B=[-10 -15 -20 28 35];
》lb=zeros(6,1);
》[X,Zmin]=linprog(f,A,B,[],[],lb,[])
最后得出x=[10 15 0 0 0 20]万m3,Zmin=12.5万元。