TI-血氧与心率的采集计算
ICU常用计算公式

心脏学公式体循环阻力体循环阻力(dyne×sec)/cm5=80×(MAP-RAP)/C.O.MAP=平均动脉压RAP=右心房压C.O.=心输出量正常值=900-1300(dyne×sec)/ cm5平均动脉压(MAP)MAP(平均动脉压)=舒张压+[1/3(收缩压-舒张压)]心输出量心输出量(L/min)=BSA=体表面积(M2)Hb=血红蛋白(g/100ml)SaO2&SvO2=动脉血氧饱和度—静脉血氧饱和度。
心脏指数是心输出量以个体为单位计算的心脏指数=心输出量/体表面积(L/min/M2)总外周血管阻力(SVR)SVR=(平均动脉压-中心静脉压)÷心排出量×80正常值为100-130kpa.s/L杜克平板测验分数=未出现心绞痛:测试持续时间(min)-5.0×最大ST段下降(mm)持续心绞痛:测试持续时间(min)-5.0×最大ST段下降(mm)-4.0×1测试因心绞痛中止:测试持续时间(min)-5.0×最大ST段下降(mm)-4.0×2风险级别:高风险:杜克平板实验分数<-5高风险:杜克平板实验分数>10校正的QT间期=测量的QT间期(sec)÷sqrt(R-R间期)正常值:校正的QT间期不应该超过:0.45(婴儿<6个月)0.44(儿童)0.425(青少年和成人)2DO2=1.34×[SaO2(动脉血氧饱和度)×Hb(血红蛋白)]×CO×102VO2=1.34×[(CaO2(动脉血氧含量)×CvO2(静脉血氧含量))×CO×10CaO2=1.34×SaO2×HbCvO2=1.34×SvO2×Hb氧耗量(ml/min)=心输出量(C.O.)×(13×Hgb)×(SaO2-SvO2)SaO2=动脉血氧饱和度SvO2=静脉血氧饱和度正常值=110-160ml/min/M2若平均体表面积为1.73M2,则正常值=190-275ml/min肺脏学公式22PaCO2=0.863×VCO2/VAVCO2为CO2排出量(ml/min)Va为每分钟肺泡通气量(L/min)0.863为使气体容量(ml)变为Kpa(mmHg)的转换因子2坐位:P a O2=104.2-0.27×年龄仰卧位:P a O2=103.5-0.42×年龄2C a O2=0.003×P a O2+1.34×S a O2×Hb2S a O2=HbO2÷(HbO2+Hb)×100%HbO2是血红蛋白结合的氧量急性肺损伤的氧合指数=动脉血氧分压/吸入气氧分数氧合指数<300,诊断为急性肺损伤(ALI)氧合指数<200,诊断为急性呼吸窘迫综合症(ARDS)2(1)吸入气氧分压P I O2=(大气压—P H2O)×吸入氧浓度%(2)肺泡气PO2(P A O2)=P I O2—PCO2×1.25(3)肺泡动脉氧分压差(P(A-a)O2)=P A O2—P a O2将(2)的结果代入(3)中即可得P(A-a)O2肺泡氧分压(P a O2)(mmHg)=[F I O2(%)×(大气压-PH2O)]-(P a CO2×1.25)] F I O2=吸入气浓度(%)P H2O=气道水蒸气压力,通常为6.3Kpa,即47mmHgP a CO2=动脉血二氧化碳分压肺顺应性(Cdyn)=潮气量÷(最大气道压-呼气末正压)肾脏学公式3尿HCO3-排泄率=[尿HCO3—(mmol/L)×血肌酐(umol/L)]÷[血浆HCO3—(mmol/L)×尿肌酐(umol/L)]×100ERPF=(尿液PAH浓度×尿量)÷血浆PAH浓度(mi/min)C osm =(U osm×V)÷P osm(ml/min)其中V为每分钟尿量U osm为尿渗透压,正常成人尿渗透压600-1000 mOsm/kg.H2O,平均为800 mOsm/kg.H2OCockcroft公式Ccr=(140-年龄)×体重(kg)/72×Scr(mg/dl)(男性)Ccr=(140-年龄)×体重(kg)/85×Scr(mg/dl)(女性)Durate公式该公式与实测Ccr相关性较好,且不需测体重,更适合于危重病人。
血氧仪的血氧心率标准

血氧仪的血氧心率标准
血氧的检测可以帮助医生诊断一些会影响健康的状况,也是身体健康状况的重要指标之一。
血氧仪是一种检测血氧、心率等数据的小型设备,它可以通过检测血液流过手指的光来确定血氧饱和度。
血氧仪的血氧心率标准可能因性别、年龄、身高、体重和其他因素略有不同,但人体理想的血氧心率是脉搏心率乘以血氧饱和度乘以100后所得的值。
一般而言,女性的血氧心率应该在95%以上,男性的血氧心率应该在94%以上,婴儿的血氧心率应该在95%-100%之间。
且血氧心率越高,血液的氧含量就会越高,从而更有利于身体健康。
血氧的检测是医学诊断的重要手段,测量血氧仪的血氧心率标准可以有效地检测血液的氧含量,从而及时发现问题,避免可能带来的风险。
血氧仪是一款便携式、易于使用的设备,它可以随时随地检测出血液的氧含量,它考虑到患者的年龄、性别等因素,同时提醒患者保持良好的血氧心率水平。
如果患者的血氧率低于正常范围,就需要及时进行体检处理,以确保健康。
心率怎么算
心率怎么算心率是指心脏每分钟跳动的次数,通常用每分钟跳动次数来表示。
它是衡量心血管系统运作情况的重要指标之一,也是人体健康状况的反映。
心率的计算有多种方法,常见的方法有手动计算和利用心率监测设备自动计算两种。
接下来将详细介绍这两种计算方法。
手动计算心率的方法是最简单直观的。
手动计算的步骤如下:首先,找到一个舒适的位置,尽量保持静止。
可以坐下或躺下,但不要进行剧烈运动。
然后,用三根手指轻轻按压动脉,常见的测量部位有颈动脉、腕动脉和股动脉。
按压时要避免用力过大,以免影响血流。
在按压的同时,用计时器计算出持续60秒的时间。
在这个时间内,注意数清脉搏跳动的次数。
最后,将数到的脉搏跳动次数作为心率,单位为每分钟次数(bpm)。
手动计算的优点是简单易行,不需要额外的设备,特别适用于日常生活中快速了解自己的心率情况。
但是手动计算也有一些限制,比如在剧烈运动或情绪激动时可能会导致计算不准确。
自动计算心率的方法则利用了心率监测设备。
常见的心率监测设备有心率表、心率手环、智能手表等。
这些设备一般都通过传感器来检测脉搏跳动情况,并将心率数据显示在设备的屏幕上。
自动计算心率的步骤相对简单,只需要佩戴设备并合理使用即可。
通常来说,需要将设备佩戴在身体部位(如手腕、胸部等)接触到皮肤的位置,并按照设备的说明进行操作。
自动计算心率的优点是准确性较高,可以实时监测心率情况,并记录下来以供建议和分析。
但是自动计算心率的设备价格较高,需要购买额外的设备来实现。
总结起来,心率的计算方法有手动计算和自动计算两种。
手动计算方法简单直观,但不准确;自动计算方法准确性高,但需要额外的设备支持。
根据实际需求和经济条件,选择适合自己的心率计算方法,有助于对心脏健康进行有效监测和评估。
注意,本文中没有出现任何网址、超链接和电话、广告。
心率计算方法

实时心率计算方法
假设心电图机的采样频率为1000,即每秒采样1000个数据,我们采样4秒钟的心电数据即4000个数据,瞬时性非常好。
假设我们要求的心律是x,那么心率计算的数学公式如下(R波指的是大小为4000的缓冲区里面,心跳波动的波峰数):
x / (60*1000) = (R波个数 - 1) / (最后一个R波位置 - 第一个R波位置) 求出x
x = (60*1000) * (R波个数 - 1) / (最后一个R波位置 - 第一个R波位置) 这个数学公式中
(最后一个R波位置-第一个R波位置) 得到的是最后一个R波和第一个R波之间隔了多少个数据,采样率1000的话,这个值其实就是隔了多少个毫秒。
(R波个数 - 1) 得到的是在这么多个毫秒内,经历多少个心跳周期。
先进先出队列的实现比较简单,我用的是最多为4000个WORD型数据的一个队列,如果数据达到4000,在添加数据的时候,就要把最早的一个数据挤出去了。
但是R波检测算法却并不完美,有时候会漏检,比如缓冲区里有5个R波,却只检出4个,这个时侯算出来的心律就偏低,不准确了。
我想到解决这个问题的方法,就是叫做“双线竞争法”,因为心电图机共15条导联线,通常的做法是用其中信号最强的一条胸导来计算心率。
为了解决R波漏检导致的心律有误的问题,可以用两个缓冲区,分别取两条胸导的数据,各自计算心律,然后采用两个心律值中较大的一个。
信号最强的导联--胸导。
血氧分析的计算公式
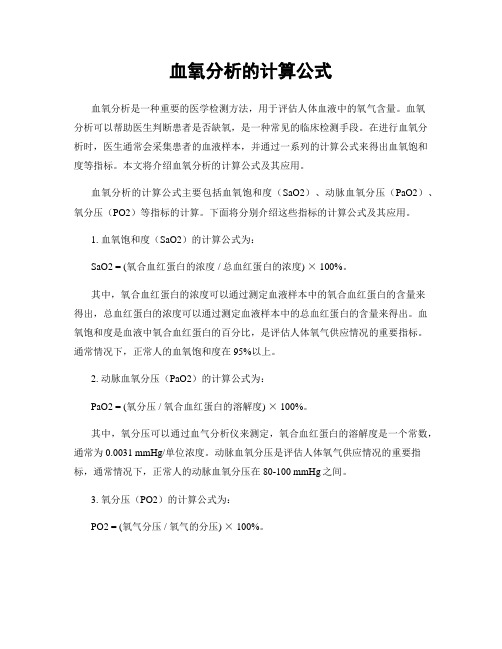
血氧分析的计算公式血氧分析是一种重要的医学检测方法,用于评估人体血液中的氧气含量。
血氧分析可以帮助医生判断患者是否缺氧,是一种常见的临床检测手段。
在进行血氧分析时,医生通常会采集患者的血液样本,并通过一系列的计算公式来得出血氧饱和度等指标。
本文将介绍血氧分析的计算公式及其应用。
血氧分析的计算公式主要包括血氧饱和度(SaO2)、动脉血氧分压(PaO2)、氧分压(PO2)等指标的计算。
下面将分别介绍这些指标的计算公式及其应用。
1. 血氧饱和度(SaO2)的计算公式为:SaO2 = (氧合血红蛋白的浓度 / 总血红蛋白的浓度) × 100%。
其中,氧合血红蛋白的浓度可以通过测定血液样本中的氧合血红蛋白的含量来得出,总血红蛋白的浓度可以通过测定血液样本中的总血红蛋白的含量来得出。
血氧饱和度是血液中氧合血红蛋白的百分比,是评估人体氧气供应情况的重要指标。
通常情况下,正常人的血氧饱和度在95%以上。
2. 动脉血氧分压(PaO2)的计算公式为:PaO2 = (氧分压 / 氧合血红蛋白的溶解度) × 100%。
其中,氧分压可以通过血气分析仪来测定,氧合血红蛋白的溶解度是一个常数,通常为0.0031 mmHg/单位浓度。
动脉血氧分压是评估人体氧气供应情况的重要指标,通常情况下,正常人的动脉血氧分压在80-100 mmHg之间。
3. 氧分压(PO2)的计算公式为:PO2 = (氧气分压 / 氧气的分压) × 100%。
其中,氧气分压可以通过血气分析仪来测定,氧气的分压是一个常数,通常为159 mmHg。
氧分压是评估人体氧气供应情况的重要指标,通常情况下,正常人的氧分压在80-100 mmHg之间。
血氧分析的计算公式可以帮助医生评估患者的氧气供应情况,及时发现缺氧等问题。
通过对血氧饱和度、动脉血氧分压、氧分压等指标的测定和分析,医生可以及时采取相应的治疗措施,保障患者的生命健康。
除了用于临床诊断和治疗,血氧分析的计算公式还可以应用于科研领域。
各心率区间计算公式

各心率区间计算公式心率是指单位时间内心脏跳动的次数,通常以每分钟的心跳次数来衡量。
心率的高低可以反映出身体的运动状态和健康状况。
在运动中,我们常常会根据自己的心率来调整运动强度,以达到最佳的运动效果。
而不同的心率区间对应着不同的运动效果,因此了解各心率区间的计算公式对于运动者来说是非常重要的。
一、静息心率区间计算公式。
静息心率是指在安静状态下,不进行任何运动时的心率。
通常来说,成年人的静息心率在60-100次/分钟之间。
静息心率的计算公式如下:静息心率 = 在安静状态下测得的心率。
二、热身心率区间计算公式。
热身心率是指在开始运动前进行热身时的心率。
热身可以帮助身体逐渐适应运动的强度,减少运动中的受伤风险。
热身心率的计算公式如下:热身心率 = (220 年龄) 0.6。
三、有氧运动心率区间计算公式。
有氧运动是指持续性的中低强度运动,如慢跑、游泳等。
有氧运动可以提高心肺功能,促进脂肪燃烧,对身体健康非常有益。
有氧运动心率的计算公式如下:有氧运动心率 = (220 年龄) 0.6~0.8。
四、无氧运动心率区间计算公式。
无氧运动是指高强度、短时间的运动,如举重、蛙跳等。
无氧运动可以增强肌肉力量和爆发力,但对心肺功能的提升作用较小。
无氧运动心率的计算公式如下:无氧运动心率 = (220 年龄) 0.8~0.9。
五、恢复心率区间计算公式。
恢复心率是指在运动结束后,身体逐渐恢复到静息状态下的心率。
恢复心率的快慢可以反映出身体的耐力和恢复能力。
恢复心率的计算公式如下:恢复心率 = 运动结束后的心率 5分钟后的心率。
六、最大心率区间计算公式。
最大心率是指一个人在最大运动强度下所能达到的心率。
通常来说,最大心率可以通过年龄来估算。
最大心率的计算公式如下:最大心率 = 220 年龄。
以上就是各心率区间的计算公式,通过这些公式我们可以更加科学地调整自己的运动强度,达到更好的运动效果。
在运动过程中,合理控制心率可以有效地避免运动中的意外情况发生,同时也可以更好地促进身体的健康和发展。
PPG测量心率和血氧的方法——原理版
PPG测量心率和血氧的方法——原理版PPG(Photoplethysmography)是一种非侵入式的生物信号检测技术,可用于测量心率和血氧水平。
本文将介绍PPG测量心率和血氧的方法的原理。
PPG基本原理:PPG利用激光或LED光源透过皮肤照射到血管组织,光线经过组织反射回光传感器。
被测血管组织容纳了心跳引起的血液容积变化,这些变化导致了光线吸收和反射特性的变化。
PPG信号随着血液容积的变化而呈现周期性的波形,可以通过测量这些波形的特征来计算心率和血氧水平。
心率是每分钟心脏收缩的次数,PPG通过测量心脏收缩引起的血管组织血液容积的变化来估计心率。
1.基准线校准:在开始测量之前,需要将PPG信号的基线调整到适当的水平。
通常会有一个不透光或非发光的器件放置在PPG传感器上,在此过程中记录下基准线。
2.滤波处理:为了去除来自运动和环境干扰对PPG信号的影响,需要对信号进行滤波处理。
常见的滤波方法有低通滤波和高通滤波。
3.心跳峰值检测:通过寻找PPG信号中的峰值,可以确定心脏收缩的时间点。
峰值检测可以通过寻找信号峰值处的局部最大值来实现。
4.心率计算:根据心跳峰值的时间间隔,可以计算心率。
心率的计算可以根据以下公式进行:心率=60/平均心跳间隔。
血氧水平是指血液中氧气的饱和度,PPG可以通过测量血管组织中的血液脉动来估计血氧水平。
1.基准线校准:与测量心率时类似,需要对PPG信号进行基准线校准。
2.滤波处理:同样地,需要对信号进行滤波处理以去除噪声和干扰。
3.血氧估计:血氧水平的估计通常通过计算PPG信号中的脉动变化来完成。
脉动变化可以通过计算平均值、标准差或功率谱等统计特征来获得。
4.血氧饱和度计算:根据脉动变化,可以使用经验公式或查表法来计算血氧饱和度。
需要注意的是,PPG测量心率和血氧的方法虽然便捷和非侵入性,但其精度可能受到多种因素的影响,如运动、环境条件以及个体差异等。
因此,在实际应用中,需要根据具体情况对PPG信号进行合适的处理和校正,以提高测量的准确性和可靠性。
睡眠环境调节系统的血氧饱和度与心率信号采集环节研制
波 长 f m p
宽度来计算心率 。 了减小脉冲噪声的影 响, 为 本文通过对连 续 9 周 期 长 度 的 脉搏 波 宽度 求 平 均 ,进 而 获 得 较 为精 确 的 个
饱和度还可 以反 映人 的呼吸功能 , 并在 ‘ 定程度上反映动脉 血氧 的变化 ,故在 临床监护和家庭监护都具有重要意义【c 9 】
根 据 比 尔一 朗伯 定理 , 长 为 的单 色 光 在 吸 收 物 质 媒 波
基 金项 目:该项 目受 巾 山大 学学 生科研 项 目资助 ( 号 :医教 [098 号) 编 20 13 作 者简 介 :黄俊 杰, 男,广 东 ,中 山医学 院生物 医 学_程 系 ,生物 医学 T程 专业 本科 生 , 』 ,5 08 【 = = _ 州 100 孙 骁 ,女 ,…东 , 中山医学 院 生物 医学工 程系 ,生物 医 学工程 专业 本科 生 ,广州 ,50 8 10 0 刘 燕 ,女 ,通讯 作者 ,广 东 ,中山 医学 院生物 医学 工程 系 ,副 教授 ,项 目指 导老 师 ,硕 士,医 学信息 学 ,广州 ,50 8 10 0 黄 耀棵 , 男,广东 , 中I大 学东 校区 教学 实验 中心 ,高级 工程 师 ,项 日指 导老师 ,学 士 , 自动控 制 ,广州 ,50 8 i l 100
和度 的检测 需求, 心率信号采集检 测环 节采 用与测量血氧相
同 的9 0m波 长 光 电 传 感器 ,通 过传 感器 的复 用 ,同 时检 测 4n
出血 氧 和 心 率 生 理 参 数 。
心 率 信 号 检 测 环 节 主 要 通 过 计 算 固 定 周 期 内 的 脉 搏 波
o7 0 08 ,0 09 . 0 10 0
Mcc ptApci so2,o, 1 io m ur plao 18 .2 2 ro e itnV . N 3 0
PPG测量心率和血氧的方法——原理版
PPG测量心率和血氧的方法——原理版PPG(Photoplethysmography)是一种通过检测光线在组织中的吸收和散射来测量心率和血氧的非侵入性技术。
它使用一个光源和一个光接收器来测量光线的吸收差异,并通过分析这些差异来推断心率和血氧水平。
PPG原理涉及到许多物理和生理参数,其中包括光吸收、散射、脉搏波产生和传播等。
首先,PPG技术使用一种红外光源照射到皮肤表面。
红外光能够穿透到皮肤的一定深度并被组织吸收。
这些组织包括皮肤、血管、肌肉等。
当光源照射到皮肤表面,一部分光线被组织吸收,一部分光线会穿过组织并被光接收器接收。
当血液中的红细胞通过照射区域时,它们会吸收不同波长的光线。
作为共振现象的一种,红细胞会吸收红外光并反射绿光。
这种吸收和反射的光线会被光接收器检测到。
在一个完整的心脏周期中,心率相关的脉冲信号会不断重复。
通过分析这些脉冲信号的频率和幅度变化,可以确定心率。
此外,PPG技术也可以用于血氧测量。
血氧饱和度是血液中氧气的浓度,是指血液中氧合血红蛋白的百分比。
当红细胞中的血红蛋白与氧结合时,会吸收不同波长的光线,从而影响到光接收器记录的光强度。
传统的PPG技术使用两种波长的光线,通常是红光和红外光。
红光对血氧的吸收较小,而红外光对血氧的吸收较大。
通过测量红光和红外光的吸收差异,可以计算出血氧饱和度。
总结一下,PPG技术通过光的吸收和散射差异来测量心率和血氧。
检测器记录到的光强度的变化与心脏的收缩和血液的流动有关,从而可以推断出心率。
同时,通过测量不同波长光线的吸收差异,可以计算出血氧饱和度。
PPG技术具有非侵入性、便携性和低成本等优点,在医疗领域和健康监测设备中得到广泛应用。
血氧仪算法
血氧仪算法血氧仪算法是指用于测量和计算血氧饱和度的算法。
血氧饱和度是指在血液中携带氧气的红细胞与总红细胞数量的比例,通常以百分比表示。
血氧仪算法的主要目的是通过对红外光和红光的吸收情况进行分析,从而准确地计算出血氧饱和度。
血氧仪算法的基本原理是光吸收法。
血氧仪通常会发射一束红外光和一束红光通过皮肤照射到血液中,然后通过光电二极管接收经过组织和血液的反射光。
由于血红蛋白对不同波长的光的吸收特性不同,因此通过测量反射光的强度,就可以得到血氧饱和度的估计值。
在血氧仪算法中,首先需要对反射光的强度进行校正,以消除外界干扰因素的影响。
校正包括环境光的去除、皮肤色素的补偿等操作。
接下来,算法会对红外光和红光的吸收情况进行分析,计算出血红蛋白的浓度和氧合血红蛋白与脱氧血红蛋白的比例。
最后,根据这些数据,就可以计算出血氧饱和度的值。
为了提高血氧饱和度的准确性,血氧仪算法通常会采用多种数据处理技术。
例如,可以对光信号进行滤波处理,以减少噪声的影响。
同时,还可以利用机器学习算法,通过训练模型来提高血氧饱和度的预测能力。
此外,血氧仪算法还需要考虑不同人群的生理特征差异,以便在不同情况下获得准确的测量结果。
在实际应用中,血氧仪算法被广泛用于医疗领域。
例如,在手术过程中,医生可以通过监测患者的血氧饱和度来评估其健康状况和手术风险。
此外,血氧仪算法还可以用于睡眠监测、运动健康管理等领域。
通过跟踪血氧饱和度的变化,可以及时发现身体健康问题,并采取相应的措施。
血氧仪算法是一种基于光吸收法的计算方法,用于测量和计算血氧饱和度。
通过对红外光和红光的吸收情况进行分析,可以得到血氧饱和度的估计值。
为了提高测量的准确性,血氧仪算法采用了多种数据处理技术,并考虑了不同人群的生理特征差异。
在医疗和健康管理领域,血氧仪算法具有重要的应用价值,可以帮助人们及时了解自己的健康状况,采取相应的措施。
- 1、下载文档前请自行甄别文档内容的完整性,平台不提供额外的编辑、内容补充、找答案等附加服务。
- 2、"仅部分预览"的文档,不可在线预览部分如存在完整性等问题,可反馈申请退款(可完整预览的文档不适用该条件!)。
- 3、如文档侵犯您的权益,请联系客服反馈,我们会尽快为您处理(人工客服工作时间:9:00-18:30)。
Getting Started Guide TIDA-00301 1 Miniaturized Pulse Oximeter Reference DesignHealthTechABSTRACT The scope of this document is to provide a miniaturized pulse oximeter reference design for high end clinical application. This reference design features AFE4403, TI’s high performance Analog Front End for pulse oximeters, an ultra-low power microcontroller and a highly optimizedintegrated dual light emitting diodes (LED) and photodiode optical sensor. This reference design simplifies and accelerates the pulse oximeter system design while still ensuring the highestquality clinical measurements.Document History VersionDate Author Notes 1.0June 2014 Praveen Aroul First releaseTIDA-003012Contents1Design Summary (4)1.1Design Goal (4)1.2Top Level Architecture (4)2Theory of operation (4)3Circuit Description (8)4Hardware Overview (8)4.1AFE4403 Overview (9)4.1.1Receiver Front end (9)4.1.2Transmit Section (11)4.1.3Clocking and Timing Signal Generation (12)4.1.4Diagnostic mode (14)4.2Optical Sensor (14)4.3Microcontroller (15)5Miniaturized SpO2 reference design Modules (15)5.1DCM03–AFE4403 module pin-outs (16)5.2DCM03–AFE4403–MCU module pin-outs (17)6Verification and Measured Performance (19)6.1Testing conditions (19)6.2Estimation of SpO2 percentage (20)Appendix A. Design Resources (21)Appendix B. Acronyms (22)Appendix C. References (23)FiguresFigure 1: Top Level Architecture(1) (4)Figure 2: Oxygenated versus de-oxygenated blood light absorption of IR and Red (5)Figure 3: Variations in light attenuation by tissue illustrating the rhythmic effect of arterial pulsation (6)Figure 4: Normalization of R and IR wavelengths to remove the effects of variation in the incident light intensity or detector sensitivity (7)Figure 5: Empirical relationship between arterial SaO2 and normalized (R/IR) ratio (8)Figure 6: Functional Block Diagram of AFE4403 (9)Figure 7: TIA block diagram of AFE4403 (10)Figure 8: LED Transmit – H-Bridge Drive (13)Figure 9: LED Transmit – Push-Pull LED Drive (14)Figure 10: DCM03 Optical sensor (15)Figure 11: DCM03-AFE4403 reference module (15)Figure 12: DCM03-AFE4403-MCU reference module (16)Figure 13: Pin positions on the DCM03-AFE4403 module (17)Figure 14: Pin positions on the DCM03-AFE4403-MCU module (18)Figure 15: PPG waveform from the DCM03-AFE4403 reference module (19)TIDA-003013TablesDocument History (1)DCM03-AFE4403 module pin-outs (16)DCM03-AFE4403-MCU module pin-outs (17)TIDA-0030141 Design SummaryTI Reference Designs are mixed-signal solutions created by TI’s experts. Verified designs offer the theory, complete PCB schematic & layout, bill of materials and measured performance of the overall system.1.1 Design GoalThe goal is to provide reference design for building a miniaturized pulse oximeter system.1.2 Top Level ArchitectureThe block diagram shown in Figure 1 gives a top level architecture of the reference design. There are two variations of the reference design modules. The first reference design contains the LED and photodiode optical sensor and the Analog Front End (AFE). The second reference design contains the LED and photodiode optical sensor, Analog Front End (AFE) and the MCU.Figure 1: Top Level Architecture (1)(1)Note: The second reference design contains the MSP430 device.2 Theory of operationThe principle of pulse oximetry revolves around the fact that the arterial component of blood is pulsatile in nature (time varying). So when a LED light is made incident on the human body (for example at a finger), the amount of light that passes through after the attenuation from various components like tissue, artery and veins also has a pulsatile component riding over a constant component. The aim of pulse oximetry is to measure the percentage of oxygenated hemoglobin (HbO 2) to the total hemoglobin (Hb) (oxygenated plus deoxygenated) in the arterial blood – this is referred to as SpO 2. Oxygenated hemoglobin in the blood is distinctively red, whereas deoxygenated hemoglobin in the blood has a characteristic dark blue coloration. The opticalproperty of blood in the visible (i.e. between 400 and 700nm) and near-infrared (i.e. between 700 and 1000nm) spectral regions depends strongly on the amount of O 2 carried by blood.TIDA-003015The method exploits the fact that Hb has a higher optical absorption coefficient in the red region of the spectrum around 660nm compared with HbO 2, as illustrated in Figure 2. On the other hand, in the near-infrared region of the spectrum around 940nm, the optical absorption by Hb is lower compared to HbO 2.At the isobestic wavelength (i.e. 805nm), where the two curves cross over, the absorbance of light is independent of oxygenation level.Figure 3: Oxygenated versus de-oxygenated blood light absorption of IR and Red By doing light measurements at two wavelengths (usually Red and IR) that have dissimilar absorption coefficients to oxygenated and deoxygenated hemoglobin, all the constant components can be cancelled out and the SpO 2 can be calculated in a ratiometric manner. The optical system for SPO2 measurement consists of LEDs that shine the light and aphotodiode that receives the light. There are two types of optical arrangements – transmissive and reflective. In the transmissive case, the photodiode and the LED are placed on opposite sides of the human body part (most commonly the finger), with the photodiode collecting the residual light after absorption from the various components of the body part. In the reflective case, the photodiode and the LED are on the same side and the photodiode collects the light reflected from various depths underneath the skin. Both variations of this reference design is based on the reflective case.The photodiode converts the incident light into an electrical signal proportional to the intensity of the light and the AFE44xx signal chain can be used to condition the signal and digitize it. The signal is referred to as the Photoplethysmogram (PPG) signal and contains the periodicity of the pulse rate. SpO 2 measurements involve using two wavelengths – most commonly Red and IR. The AFE44xx family of devices therefore supports independent control over 2 LEDs.As shown in Figure 3, the magnitude of the PPG signal depends on the amount of blood ejected from the heart with each systolic cycle, the optical absorption of blood, absorption by skin and various tissue components, and the specific wavelengths used to illuminate the vascular tissuebed.TIDA-003016During systole, when the arterial pulsation is at its peak, the volume of blood in the tissueincreases. This additional blood absorbs more light, thus reducing the light intensity which is either transmitted or backscattered.During diastole, less blood is present in the vascular bed, thus increasing the amount of light transmitted or backscattered.The pulsatile part of the PPG signal is considered as the “AC” component, and the non- pulsatile part, resulting mainly from the venous blood, skin and tissue, is referred to as the “DC”component. A deviation in the LED brightness or detector sensitivity can change the intensity of the light detected by the sensor. This dependence on transmitted or backscattered light intensity can be compensated by using a normalization technique where the AC component is divided by the DC component, as given in the equation (1) below:R IR=⎝⎜⎛AC R DC R AC IR DC IR�⎠⎟⎞(1)Thus, the time invariant absorbance due to venous blood or surrounding tissues does not have any effect on the measurement. This normalization is carried out for both the red (R) and the infrared (IR) wavelengths, as shown in Figure 4. The normalized R/IR “ratio of ratios” can then be related empirically to SpO2, as shown in Figure 5. When the ratio is 1, the SpO2 value is about 85%.Figure 4: Variations in light attenuation by tissue illustrating the rhythmic effect of arterialpulsationTIDA-003017Figure 5: Normalization of R and IR wavelengths to remove the effects of variation in theincident light intensity or detector sensitivityMost pulse oximeters measure absorbance at two different wavelengths and are calibrated using data collected from CO-oximeters by empirically looking up a value for SpO 2, giving an estimation of SaO 2 using the empirical relationship given by the Equation (2)SaO 2% = A − B ∙ (R /IR ) (2)where R /IR is based on a normalization where the pulsatile (AC) component is divided by the corresponding non-pulsatile (DC) component for each wavelength, and A and B are linear regression coefficients which are related to the specific absorptions coefficients of Hb and HbO 2. The constants A and B are derived empirically during in-vivo calibration by correlating the ratio calculated by the pulse oximeter against SaO 2 from arterial blood samples by an in vitro oximeter for a large group of subjects. Pulse oximeters read the SaO 2 of the blood accurately enough for clinical use under normal circumstances because they use a calibration curve based on empirical data shown in Figure 5.TIDA-003018Figure 6: Empirical relationship between arterial SaO2 and normalized (R/IR) ratio3 Circuit DescriptionPulse oximeters measure arterial blood oxygen saturation by sensing absorption properties of deoxygenated and oxygenated hemoglobin using various wavelengths of light. A basic meter is comprised of a sensing probe attached to a patient's earlobe, toe, finger or other body locations, depending upon the sensing method (reflection or transmission), and a data acquisition system for the calculation and eventually display of oxygen saturation level, heart rate and/or blood flow.This reference design discusses the methodology to build a miniaturized pulse oximeter system.The design employs reflectance mode photoplethysmography (PPG).High Performance pulse oximetry measurements are achieved by using the AFE4403, a fully Integrated Analog Front End that consists of a low noise receiver channel with an integratedanalog-to-Digital converter, an LED transmit section, diagnostics for sensor and LED faultdetection. Additional components include:•Ultra-low power microcontroller (MCU)•LED and photodiode optical sensor4 Hardware OverviewThe following section describes the reference design by providing detailed information about the Analog Front End and the additional components that complete this reference design.TIDA-0030194.1 AFE4403 OverviewThe AFE4403 is a complete analog front-end (AFE) solution targeted for pulse oximeterapplications. The device consists of a low-noise receiver channel, an LED transmit section, and diagnostics for sensor and LED fault detection. To ease clocking requirements and provide the low-jitter clock to the AFE, an oscillator is also integrated that functions from an external crystal. The device communicates to an external microcontroller or host processor using an SPIinterface. Figure 6 provides a detailed block diagram for the AFE4403. The blocks are described in more detail in the following section.Figure 7: Functional Block Diagram of AFE44034.1.1 Receiver Front endThe device is ideally suited as a front-end for a PPG (photoplethysmography) application. In such an application, the light from the LED is reflected (or transmitted) from (or through) the various components inside the body (such as blood, tissue, and so forth) and are received by the photodiode. The signal received by the photodiode has three distinct components:1. A pulsatile or AC component that arises as a result of the changes in blood volume through the arteries.2. A constant DC signal that is reflected or transmitted from the time invariant components in the path of light. This constant DC component is referred to as the pleth signal.3.Ambient light entering the photodiode.TIDA-0030110The AC component is usually a small fraction of the pleth component, with the ratio referred to as the perfusion index (PI). Thus, the allowed signal chain gain is usually determined by the amplitude of the DC component.The receiver consists of a differential current-to-voltage (I-V) transimpedance amplifier (TIA) that converts the input photodiode current into an appropriate voltage. The feedback resistor of the amplifier (Rf) is programmable to support a wide range of photodiode currents. Available RF values include: 1 MΩ, 500 kΩ, 250 kΩ, 100 kΩ, 50 kΩ, 25 kΩ, and 10 kΩ.The model of the photodiode and the connection to the TIA is shown below:Figure 8: TIA block diagram of AFE4403I in is the signal current generated by the photodiode in response to the incident light and C in is the zero bias capacitance of the photodiode.The current to voltage gain in the TIA is given by:V TIA(diff)=V TIA+−V TIA−= 2∗I in∗R f(3) For example, for a photodiode current of I in= 1 μA and a TIA gain setting of R f = 100 kΩ, the differential output of the TIA is equal to 200 mV. The TIA has an operating range of ±1 V, and the ADC has an input full-scale range of ±1.2 V (the extra margin is to prevent the ADC from saturating while operating the TIA at the fullest output range). Furthermore, because the PPG signal is one-sided, only one half of the full-scale is used. TI recommends operating the device at a DC level that is not more than 50% to 60% of the ADC full-scale. The margin allows for sudden changes in the signal level that might saturate the signal chain if operating too close tofull-scale.The Rf amplifier and the feedback capacitor (Cf) form a low-pass filter for the input signalcurrent. Always ensure that the low-pass filter RC time constant has sufficiently high bandwidth (as shown by Equation 4 below) because the input current consists of pulses. For this reason, the feedback capacitor is also programmable. Available Cf values include: 5 pF, 10 pF, 25 pF,50 pF, 100 pF, and 250 pF. Any combination of these capacitors can also be used.R f∗C f≤Rx Sample Time10(4)The output voltage of the I-V amplifier includes the pleth component (the desired signal) and a component resulting from the ambient light leakage. The I-V amplifier is followed by the second stage, which consists of a current digital-to-analog converter (DAC) that sources the cancellation current and an amplifier that gains up the pleth component alone. The amplifier has fiveprogrammable gain settings: 0 dB, 3.5 dB, 6 dB, 9.5 dB, and 12 dB. The gained-up pleth signal is then low-pass filtered (500-Hz bandwidth) and buffered before driving a 22-bit ADC. Thecurrent DAC has a cancellation current range of 10 μA with 10 steps (1 μA each). The DACvalue can be digitally specified with the SPI interface. Using ambient compensation with theambient DAC allows the DC-biased signal to be centered to near mid-point of the amplifier (±0.9 V). Using the gain of the second stage allows for more of the available ADC dynamic range to be used.The output of the ambient cancellation amplifier is separated into LED2 and LED1 channels.When LED2 is on, the amplifier output is filtered and sampled on capacitor C LED2. Similarly, the LED1 signal is sampled on the C LED1 capacitor when LED1 is on. In between the LED2 andLED1 pulses, the idle amplifier output is sampled to estimate the ambient signal on capacitorsC LED2_amb and C LED1_amb.The sampling duration is termed the receiver (Rx) sample time and is programmable for each signal, independently. The sampling can start after the I-V amplifier output is stable (to account for LED and cable settling times). The Rx sample time is used for all dynamic range calculations;the minimum time recommended is 50 μs. While the AFE4403 can support pulse widths lower than 50 µs, having too low of a pulse width could result in a degraded signal and noise from the photodiode.A single 22-bit ADC converts the sampled LED2, LED1, and ambient signals sequentially. Eachconversion provides a single digital code at the ADC output. The conversions are meant to be staggered so that the LED2 conversion starts after the end of the LED2 sample phase, and so on.Note that four data streams are available at the ADC output (LED2, LED1, ambient LED2, and ambient LED1) at the same rate as the pulse repetition frequency. The ADC is followed by adigital ambient subtraction block that additionally outputs the (LED2 – ambient LED2) and (LED1 – ambient LED1) data values.4.1.2 Transmit SectionThe transmit section integrates the LED driver and the LED current control section with 8-bitresolution.The RED and IR LED reference currents can be independently set. The current source (ILED) locally regulates and ensures that the actual LED current tracks the specified reference. Thetransmitter section uses an internal 0.25-V reference voltage for operation. This referencevoltage is available on the TX_REF pin and must be decoupled to ground with a 2.2-μFcapacitor. The TX_REF voltage is derived from the TX_CTRL_SUP. The TX_REF voltage can be programmed from 0.25 V to 1 V. A lower TX_REF voltage allows a lower voltage to besupported on LED_DRV_SUP. However, the transmitter dynamic range falls in proportion to the voltage on TX_REF. Thus, a TX_REF setting of 0.5 V gives a 6-dB lower transmitter dynamic range as compared to a 1-V setting on TX_REF, and a 6-dB higher transmitter dynamic range as compared to a 0.25-V setting on TX_REF.Note that reducing the value of the band-gap reference capacitor on the BG pin reduces the time required for the device to wake-up and settle. However, this reduction in time is a trade-offbetween wake-up time and noise performance. For example, reducing the value of thecapacitors on the BG and TX_REF pins from 2.2 µF to 0.1µF reduces the wake-up time (from complete power-down) from 1 sec to 100 ms, but results in a few decibels of degradation in the transmitter dynamic range.The minimum LED_DRV_SUP voltage required for operation depends on:•Voltage drop across the LED (VLED),•Voltage drop across the external cable, connector, and any other component in series with the LED (V CABLE), and•Transmitter reference voltage.Two LED driver schemes are supported:•An H-bridge drive for a two-terminal back-to-back LED package. See Figure 8.• A push-pull drive for a three-terminal LED package. See Figure9.4.1.3 Clocking and Timing Signal GenerationThe crystal oscillator generates a master clock signal using an external crystal. In the defaultmode, a divide-by-2 block converts the 8-MHz clock to 4 MHz, which is used by the AFE tooperate the timer modules, ADC, and diagnostics. The 4-MHz clock is buffered and output from the AFE in order to clock an external microcontroller.To enable flexible clocking, the AFE4403 has a clock divider with programmable division ratios.While the default division ratio is divide-by-2, the clock divider can be programmed to selectbetween ratios of 1, 2, 4, 6, 8, or 12. The division ratio should be selected based on the external clock input frequency such that the divided clock has a frequency close to 4 MHz. Whenoperating with an external clock input, the divider is reset based on the RESET signal risingedge.The device supports both external clock mode as well as an internal clock mode with the external crystal. In the external clock mode, an external clock is input on the XIN pin and the device internally generates the internal clock (used by the timing engine and the ADC) by a programmable division ratio. After division, the internal clock should be within the range of 4 MHz to 6 MHz. In internal clock mode, an external crystal (connected between XIN and XOUT) is used to generate the clock.Figure 9: LED Transmit – H-Bridge DriveThe AFE4403 has a timer module that can program the various rising and falling timing edges for the 11 signals.The module uses a single 16-bit counter (running off of the 4-MHz clock) to set the time-base. All timing signals are set with reference to the pulse repetition period (PRP). Therefore, a dedicated compare register compares the 16-bit counter value with the reference value specified in the PRF register. Every time that the 16-bit counter value is equal to the reference value in the PRF register, the counter is reset to 0.For the timing signals, the start and stop edge positions are programmable with respect to the PRF period. Each signal uses a separate timer compare module that compares the counter value with preprogrammed reference values for the start and stop edges. All reference values can be set using the SPI interface. After the counter value has exceeded the stop reference value, the output signal is set. When the counter value equals the stop reference value, the output signal is reset.Figure 10: LED Transmit – Push-Pull LED Drive4.1.4 Diagnostic modeThe device includes diagnostics to detect open or short conditions of the LED and photosensor, LED current profile feedback, and cable on or off detection. The diagnostics module, whenenabled, checks for nine types of faults sequentially. The results of all faults are latched in 11 separate flags. The status of all flags can also be read using the SPI interface.4.2 Optical SensorTo measure the peripheral oxygen saturation, an optical sensor (DCM03) (see Figure 10) which has an integrated Red, IR LEDs and photodiode built in to a single module was used. Themodule has been developed by APMKorea [1]. The module works on the principle of reflective photometry. In reflectance photometry, the LEDs and photodiode are placed on the same plane as the human body part and the photodiode collects the light reflected from various depthsunderneath the skin. The sensor has been designed with optimum separation distance between the LEDs and the photodiode to achieve good quality photoplethysmogram signal.Figure 11: DCM03 Optical sensor4.3 MicrocontrollerIn this reference design (both variations), the microcontroller is used to configure the AFE4403 and process the AFE4403 information. The microcontroller MSP430F5528 is from the TexasInstruments MSP430 family of ultra-low power microcontrollers. The microcontroller architecture, combined with extensive low power modes, is optimized to achieve extended battery life inportable applications.5 Miniaturized SpO2 reference design ModulesThere are two variations of the SpO2 reference design modules. The first reference designcontains the LED and photodiode optical sensor, Analog Front End (AFE) for acquiring andconditioning the PPG signal. The second reference design contains the LED and photodiodesensor, Analog Front End (AFE) for acquiring and conditioning the PPG signal and the MCU for processing the information from the AFE.Figure 11 shows the first reference design module with the AFE and the optical sensor. Thereference design module is small and compact and has the following dimensions 0.393”(9.98mm) x 0.411” (10.44mm).Figure 12: DCM03-AFE4403 reference moduleFigure 12 shows the second reference design module with the AFE, MCU and the opticalsensor. The reference design module is small and compact and has the following dimensions0.609” (15.47mm) x 0.413” (10.49mm).Figure 13: DCM03-AFE4403-MCU reference module5.1 DCM03–AFE4403 module pin-outsThe table below shows the signal names on the DCM03- AFE4403 module pin-outs. Figure 13 shows the pin positions on the DCM03-AFE4403 module.DCM03-AFE4403 module pin-outsPin Number Signal Names1 AFE_VCC2 GND3 AFE_SPI_SOMI4 AFE_SPI_SIMO5 AFE_SPI_CLK6 AFE_DIAG_END7 AFE_XIN8 GND9 AFE_PDNZ10 AFE_ADC_RDY11 AFE_SPI_STE12 AFE_RESETZ13 LED_DRV_GND14 LED_DRV_SUPFigure 14: Pin positions on the DCM03-AFE4403 module5.2 DCM03–AFE4403–MCU module pin-outsThe table below shows the signal names on the DCM03- AFE4403-MCU module pin-outs.Figure 14 shows the pin positions on the DCM03-AFE4403-MCU module.DCM03-AFE4403-MCU module pin-outsPin Number Signal Names1 AFE_VCC2 GND3 No Connect (NC)4 No Connect5 No Connect6 EXT_SPI_STE7 EXT_SPI_SOMI8 EXT_SPI_SIMO9 EXT_SPI_CLK10 GND11 No Connect12 No Connect13 LED_DRV_GND14 LED_DRV_SUP15 JTAG_TDO16 JTAG_TMS17 JTAG_RST18 JTAG_TDI19 JTAG_TCK20 JTAG_TEST21 DVCC22 GNDFigure 15: Pin positions on the DCM03-AFE4403-MCU module6 Verification and Measured PerformanceThis section describes the measurement results of the DCM03-AFE4403 reference module.6.1 Testing conditionsAFE44x0SP02EVM was used to test the DCM03-AFE4403 reference module. The reference module was hard-wired to the MSP430 serial Peripheral Interface (SPI) on the evaluationmodule.Below were the testing conditions:In the reference module, AFE_VCC was set to 3V. LED_DRV_SUP was set to 3.3V.LED_DRV_GND and GND were shorted together. LED current was set to 5mA.Figure 15 shows the PPG waveform captured from the DCM03-AFE4403 reference module.Figure 16: PPG waveform from the DCM03-AFE4403 reference module6.2 Estimation of SpO2 percentageThis section outlines the calculation of SpO2 using PPG signals. The SpO2 estimation relies on the relationship between the baseline value (referred as DC component) to the fluctuation in the signal (referred to as AC component). SpO2 calculation is based on computing the “ratio ofratios” or Pulse Modulation ratio R which is defined as the ratio of AC/DC of red and IR LEDs as mentioned in Section 2.The PPG signal is normally contaminated with noise which could come from various sources like the power supply noise, motion artifact etc. An essential component as part of the datapreprocessing is filtering out the unwanted signal of interest. Since the DC component resides in frequencies below 0.5Hz, a low pass filter with a cutoff frequency of 5Hz can be used for theSpO2 estimation. This filtering stage is left for the user to implement.Here is an example of how to estimate SpO2 percentage based on the sample PPG data from Figure 15.The ratio of ratios R for the sample PPG data is computed below,R=(AC DC)Red(AC DC)IR=4mV(323mV)25mV(920mV)=0.455 (5)The R value is the only variable in the SpO2 estimation. The standard model for computing is defined as follows:SpO2 %=110−R∗25(6)This model is often used in the literature in the context of the medical devices. However, it relies on the calibration curves [2] that are used to make sure that this linear approximation provides a reasonable result.For the sample PPG data, % SpO2 is computed as below,SpO2 %=110−0.455∗25=98.6 %(7)TIDA-0030121Appendix A. Design ResourcesDesign Archive (ZIP File)All design files AFE4403Product Folder AFE4403EVMTools FolderTIDA-0030122Appendix B. AcronymsADC Analog-to-Digital ConverterAFE Analog Front EndDAC Digital-to-Analog ConverterHb HaemoglobinHbO2Oxygenated HaemoglobinLED Light Emitting DiodeMCU Microcontroller UnitPCB Printed Circuit BoardPPG PhotoplethysmographyRX ReceiverSPI Serial Peripheral InterfaceTI Texas InstrumentsTIA Transimpedance AmplifierTIDA-0030123Appendix C. References1./bio-device/reflectance_oximeter4.pdf 2. “A technology overview of the Nellcor OxiMax pulse oximery system,” Nellcor PuritanBennet Inc., 2003IMPORTANT NOTICE FOR TI REFERENCE DESIGNSTexas Instruments Incorporated("TI")reference designs are solely intended to assist designers(“Buyers”)who are developing systems that incorporate TI semiconductor products(also referred to herein as“components”).Buyer understands and agrees that Buyer remains responsible for using its independent analysis,evaluation and judgment in designing Buyer’s systems and products.TI reference designs have been created using standard laboratory conditions and engineering practices.TI has not conducted any testing other than that specifically described in the published documentation for a particular reference design.TI may make corrections,enhancements,improvements and other changes to its reference designs.Buyers are authorized to use TI reference designs with the TI component(s)identified in each particular reference design and to modify the reference design in the development of their end products.HOWEVER,NO OTHER LICENSE,EXPRESS OR IMPLIED,BY ESTOPPEL OR OTHERWISE TO ANY OTHER TI INTELLECTUAL PROPERTY RIGHT,AND NO LICENSE TO ANY THIRD PARTY TECHNOLOGY OR INTELLECTUAL PROPERTY RIGHT,IS GRANTED HEREIN,including but not limited to any patent right,copyright,mask work right, or other intellectual property right relating to any combination,machine,or process in which TI components or services are used. Information published by TI regarding third-party products or services does not constitute a license to use such products or services,or a warranty or endorsement e of such information may require a license from a third party under the patents or other intellectual property of the third party,or a license from TI under the patents or other intellectual property of TI.TI REFERENCE DESIGNS ARE PROVIDED"AS IS".TI MAKES NO WARRANTIES OR REPRESENTATIONS WITH REGARD TO THE REFERENCE DESIGNS OR USE OF THE REFERENCE DESIGNS,EXPRESS,IMPLIED OR STATUTORY,INCLUDING ACCURACY OR COMPLETENESS.TI DISCLAIMS ANY WARRANTY OF TITLE AND ANY IMPLIED WARRANTIES OF MERCHANTABILITY,FITNESS FOR A PARTICULAR PURPOSE,QUIET ENJOYMENT,QUIET POSSESSION,AND NON-INFRINGEMENT OF ANY THIRD PARTY INTELLECTUAL PROPERTY RIGHTS WITH REGARD TO TI REFERENCE DESIGNS OR USE THEREOF.TI SHALL NOT BE LIABLE FOR AND SHALL NOT DEFEND OR INDEMNIFY BUYERS AGAINST ANY THIRD PARTY INFRINGEMENT CLAIM THAT RELATES TO OR IS BASED ON A COMBINATION OF COMPONENTS PROVIDED IN A TI REFERENCE DESIGN.IN NO EVENT SHALL TI BE LIABLE FOR ANY ACTUAL,SPECIAL,INCIDENTAL,CONSEQUENTIAL OR INDIRECT DAMAGES,HOWEVER CAUSED,ON ANY THEORY OF LIABILITY AND WHETHER OR NOT TI HAS BEEN ADVISED OF THE POSSIBILITY OF SUCH DAMAGES,ARISING IN ANY WAY OUT OF TI REFERENCE DESIGNS OR BUYER’S USE OF TI REFERENCE DESIGNS.TI reserves the right to make corrections,enhancements,improvements and other changes to its semiconductor products and services per JESD46,latest issue,and to discontinue any product or service per JESD48,latest issue.Buyers should obtain the latest relevant information before placing orders and should verify that such information is current and complete.All semiconductor products are sold subject to TI’s terms and conditions of sale supplied at the time of order acknowledgment.TI warrants performance of its components to the specifications applicable at the time of sale,in accordance with the warranty in TI’s terms and conditions of sale of semiconductor products.Testing and other quality control techniques for TI components are used to the extent TI deems necessary to support this warranty.Except where mandated by applicable law,testing of all parameters of each component is not necessarily performed.TI assumes no liability for applications assistance or the design of Buyers’products.Buyers are responsible for their products and applications using TI components.To minimize the risks associated with Buyers’products and applications,Buyers should provide adequate design and operating safeguards.Reproduction of significant portions of TI information in TI data books,data sheets or reference designs is permissible only if reproduction is without alteration and is accompanied by all associated warranties,conditions,limitations,and notices.TI is not responsible or liable for such altered rmation of third parties may be subject to additional restrictions.Buyer acknowledges and agrees that it is solely responsible for compliance with all legal,regulatory and safety-related requirements concerning its products,and any use of TI components in its applications,notwithstanding any applications-related information or support that may be provided by TI.Buyer represents and agrees that it has all the necessary expertise to create and implement safeguards that anticipate dangerous failures,monitor failures and their consequences,lessen the likelihood of dangerous failures and take appropriate remedial actions.Buyer will fully indemnify TI and its representatives against any damages arising out of the use of any TI components in Buyer’s safety-critical applications.In some cases,TI components may be promoted specifically to facilitate safety-related applications.With such components,TI’s goal is to help enable customers to design and create their own end-product solutions that meet applicable functional safety standards and requirements.Nonetheless,such components are subject to these terms.No TI components are authorized for use in FDA Class III(or similar life-critical medical equipment)unless authorized officers of the parties have executed an agreement specifically governing such use.Only those TI components that TI has specifically designated as military grade or“enhanced plastic”are designed and intended for use in military/aerospace applications or environments.Buyer acknowledges and agrees that any military or aerospace use of TI components that have not been so designated is solely at Buyer's risk,and Buyer is solely responsible for compliance with all legal and regulatory requirements in connection with such use.TI has specifically designated certain components as meeting ISO/TS16949requirements,mainly for automotive use.In any case of use of non-designated products,TI will not be responsible for any failure to meet ISO/TS16949.Mailing Address:Texas Instruments,Post Office Box655303,Dallas,Texas75265Copyright©2014,Texas Instruments Incorporated。