布鲁克XRF荧光光谱仪说明书 2-应用SPECTRA plus作你的第一条回归曲线
XRF(SOP操作指导书)
置狀態轉至ON位置狀態。
7.X-RAY鑰匙向右旋轉後,軟體的左下方會出現可以測量,此時X射線到達安
定狀態需等待約30分鐘。
二.量测:
1.点击應用選单,再选择金属为塊體分析(FP),塑胶为塊體分析(检量线)。
2.点影像视窗。
XRF仪器操作作业指导书
仪器名称
桌上型X射线荧光光谱仪(XRF)
厂商/型号
Seiko / SEA1000A
操作步骤
一.开机:
1.打開位於儀器測量系統主機右後方的電源開關ON。
2.請按在測量系統的右下方的Power綠色開關,請確認開關確實變成綠色。
3.打開電腦螢幕和電腦的電源。
4.打開印表機的電源。
5.啟動X-ray軟體。
線關閉)訊號,此時X射線已關閉。
2.按測量系統的右上角的(結束軟體)按鈕,關閉X-ray軟體。
3.關閉電腦主机電源。
四.维护与保养:
1.每周进行对过滤棉清洗,能量校正,強度校正,分辨率校正。
2.每天进行对第二片塑胶标准片校正,误差应在范围内(“Cd、Pb 100正负15,Hg、Br、Cr 100正负30”)如超出此范围内,就必须对四片塑胶标准片重新校正。
3.按樣品室OPEN按鈕(正面的圓形按鈕)Байду номын сангаас以打開樣品室蓋。
4.將樣品放置在測量區域的中央位置,然后用手將台蓋往下壓,直到台蓋聽到卡的一声為止。
5.点击开始进行测试。
6.测试完后左下角会出现可以进行量测时,点击分析报告就会出现成份的数据作成Word档案,并且保存。
三.關機:
1.X-ray鑰匙向左旋轉後,使其成縱方向狀態OFF,軟體的左下方會出現(X射
X射线荧光光谱仪操作指导书

插入图片处
三、注意事项
1、测试过程中不能打开防护罩。 2、每次测试开机,软件将按程序运行约15分钟时间完成升压管流。 3、如果关机没有超过1小时,在选择参数时不需要勾选“慢管升压、管流” 。 4、未经许可,不要擅自修改工作区“管压”和“管流”参数 5、在预热阶段,如不需要关机的情况下,尽量不要关测试软件和电源。 6、测试样品应尽量水平放置,样品之中心位置应与画面中之十字交叉处对准。 7、如不需要长时间测试时,可将仪器关闭休息一下,避免发光管受热时间太长影响使用寿命。
二、操作步骤
1、测试之前一定要把仪器预热30分钟,再放入“银校正片”后进行初始化。根据仪器当时的状态,初 始化过程要持续几百秒的时间。初始化成功后,状态栏的结果将显示为PASS,者可以开始测试,如不是 则必须重新初始化。。 2、开启软件将按设定程序运行,约花15分钟左右的时间完成升到指定的升压管流,看到3个全部为OK, 者升压管流完成 3、根据样品选择工作曲线进行测试,样品一定要放在薄膜的中心,可以从摄像头中看到是否对准。 4、在测试时应该根据被测物品的材质和表处,选择相应的工作曲线对样品进行测试。测试时间为(200 —600s)。 5、测试人必须知道型号、材质、供应商并如实记录于测试信息栏,测试人才能测试该样品。 6、准备就序,然后点击“开始测量”,待样品测试完毕后,程序将自动报告测试结果。 7、测试完成并输出报告并存档。 8、测试完成后拿出样品,盖上防护罩。 9、关机时,先要关闭测试软件,再关闭仪器电源。
设备操作指导书
机种 规格 站别 作业名称 文件编号 MWI-00-000 版本 B/0 制作日期 2012-0-00
线荧光光谱仪
一、使用前检查
XXXXXX
IQC
布鲁克XRF荧光光谱仪说明书 8-MeasPara-测量参数
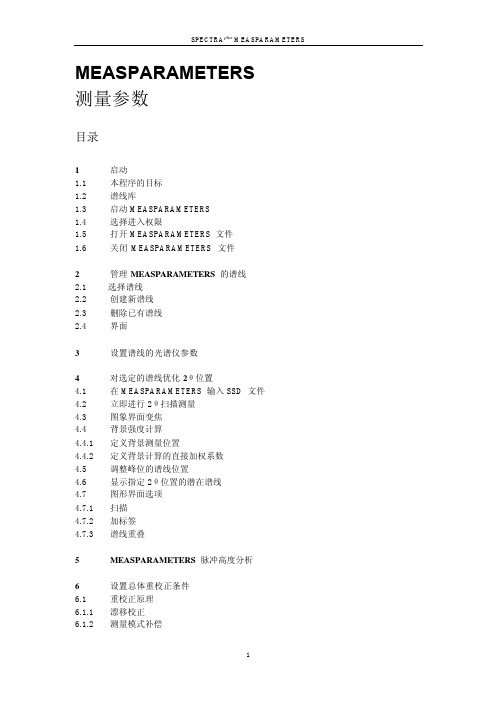
1.5
打开 MEASPARAMETERS 文件
在 MEASPARAMETERS 里工作,可以打开默认谱线库或已有的测量方法 (.MM 文件)
打开默认谱线库: 在工具栏,单击 Open default line library (此按钮是绿色)
在 MEASPARAMETERS 打开 MM 文件: 1 在工具栏,单击 Open 显示打开对话框; 2 选择需要打开的测量方法(MM 文件),然后单击 Open。
后两级权限需要在进入时就输入密码。
1 在 View 菜单,单击 Access Rights 显示选择所需进入权限对话框; 2 执行下列操作之一:
·
如果需要改变被保护谱线的峰位和背景位置:
a)
在 Password 项输入密码;
b)
单击 Change peak and background position 选项;
5
MEASPARAMETERS 脉冲高度分析
6 6.1 6.1.1 6.1.2
设置总体重校正条件 重校正原理 漂移校正 测量模式补偿
1
SPECTRAplus MEASPARAMETERS
6.1.3 6.1.4 6.2 6.3 6.4 6.5 6.5.1 6.5.2
总体重校正 兼容谱线 总体重校正逻辑 查看总体重校正条件 总体重校正选项栏里的管理参考样品 重校正数据的废除与净化 废除重校正数据 净化重校正数据
a)
在 Password 项输入密码;
b)
单击 Full control 选项;
c)
单击 OK。
注意: 最高权限的密码,在 SPECTROMETERCONFIGURATION 程序里的“Global Settings Password“里设置。
布鲁克XRF荧光光谱仪说明书 7-MeasMethod-测量方法

MeasMethod测量方法目录1 开始1.1 MEASMETHOD 的目标1.2 屏幕导向1.3 管理MEASMETHOD 文件1.3.1 启动MEASMETHOD 和创建新的测量方法1.3.2 打开和保存测量方法2 设置测量方法2.1 设置测量参数2.2 选择测量的元素2.2.1 在无标样方法2.2.2 在定量方法2.3 选择分析谱线2.4 查看和管理需要测量的谱线2.5 设置测量模式和时间2.5.1 理论知识介绍2.5.2 设置测量模式时需考虑的事项2.5.3 设置测量时间2.5.4 设置峰位测量2.5.5 设置背景测量2.5.6 设置死时间校正模式2.5.7 Scan-扫描选项的说明2.5.8 Fixed-固定选项的说明2.5.9 Optimized –优化选项的说明2.6 重校正选项索引MeasMethod1 开始1.1 MEASMETHOD 的目标MEASMETHOD保存和编辑MM文件,即定义用光谱仪测量样品时的测量参数。
这些参数包括:・光谱仪模式(vacuum-真空;vacuum with seal,真空并有真空封档,helium-氦气)・样品是否旋转・准直器面罩型号・测量模式・测量的元素及谱线・测量时间和步长・重校正样品谱线是保存在谱线库(S4-LineLibrary.fll1),并在MEASPARAMETERS 程序里编辑。
谱线由下列参数定义:X-射线管的管压、滤片、所用的准直器、分光晶体,2θ测量位置,所用的探测器、及对应的脉冲高度分析器(PHA)的窗口。
根据Siegbahn命名法则,谱线名称反映了电子的跃迁和产生(如 Fe KA1 是铁的Ka1 谱线)。
因此,同一条谱线可用于多个测量方法;可以在不同的条件(如:气氛模式、测量时间、面罩…)的测量,并可用于不同定量程序的校准。
测量条件在MEASMETHOD里定义,并补充该谱线的测量参数。
1.2 屏幕导向MEASMETHOD 屏幕包括:・标题内容有:项目说明Elements 当前方法测量的元素数Lines: Total 当前所选元素在谱线库可选的谱线总数(注意,如果没有元素被选时,也包括Compton 谱线)Total Time 如果测量是设置为Fixed,测量总时间Active 测量的谱线数Created 创建日期Last Change 最后修改・可进入6个设置选项栏。
xrf操作规程
xrf操作规程XRF(X射线荧光光谱仪)是一种常用的无损分析技术,可以用于快速、准确地分析各种材料的元素成分。
为了保障操作的安全性和分析结果的准确性,使用XRF仪器的操作人员需要遵守一定的操作规程。
以下是XRF操作规程的一些建议,供参考。
1. 实验前准备:- 确保工作区域整洁,无杂物和尘土。
- 检查XRF仪器的运行状态,确保其正常工作。
- 确保配备必要的安全设施,如防护眼镜、手套、防护衣等。
2. 样品准备:- 根据实验需求,选择适当的样品制备方法,并确保样品制备过程符合标准操作规程。
- 严格控制样品的尺寸和形状,以确保分析结果的准确性。
- 要小心处理易燃、易爆和有毒物质,采取相应的安全措施。
3. 仪器操作:- 按照仪器的使用说明书进行仪器开启和关闭的步骤和操作。
- 仪器操作人员应接受专业培训,熟悉XRF仪器的操作系统和各项功能。
- 在操作过程中,要轻拿轻放,避免对仪器造成不必要的损害。
- 严禁操作人员以外的人员接触X射线仪器,并确保工作区域的人员安全。
4. 标样校准和质量控制:- 使用标准测试样品进行校准,确保分析结果的准确性和可靠性。
- 定期检查和校正仪器的校准曲线,以确保其准确性和稳定性。
- 使用定期检测的质量控制样品进行仪器性能验证,以确保仪器处于良好状态。
5. 分析操作:- 根据实验需求选择适当的分析模式和参数设置,确保分析结果的准确性。
- 保持仪器和样品的稳定温度和湿度,以减少因环境因素引起的测试结果误差。
- 仔细记录和标记每个样品的相关信息,以便后续的数据分析和处理。
6. 实验后处理:- 在实验结束后,彻底清洁和维护XRF仪器,确保其正常工作和寿命。
- 保存样品数据和分析结果,进行数据分析和比较。
- 及时处理发现的问题和异常情况,如仪器故障或测试结果异常,确保问题得到妥善解决。
总之,遵守XRF仪器的操作规程是确保实验结果准确性和人员安全的重要措施。
操作人员应严格按照规程要求进行操作,并在操作过程中保持高度的警惕性和责任心,以确保实验的顺利进行和结果的可靠性。
X射线荧光光谱仪操作指引
1.0测试环境要求温度:10-30℃;湿度:40-70%。
2.0开机操作2.1检查液氮1)打开仪器的上盖。
2)拔出液氮罐的盖。
3)用钢尺伸进罐,若液面低于6CM(相当于1L),就要添加液氮。
4)添加液氮。
用A3纸做成一个漏斗放在罐口,或用毛巾围在罐口,戴上橡胶手套和护目镜,将液氮小心地倒入罐,在液氮快满前停止添加液氮(液氮罐深18CM或总容量为3L)。
5)等待30分钟,冷却检测器。
注意:①液氮为一种极低温液体(-196℃),用来冷却检测器,添加时要防止冻伤;②若测试过程发现液氮不够,必须关闭仪器,并关闭仪器的电源才能添加液氮。
2.2依次打开UPS电源、变压器电源、EDX主机、计算机和EDX软件。
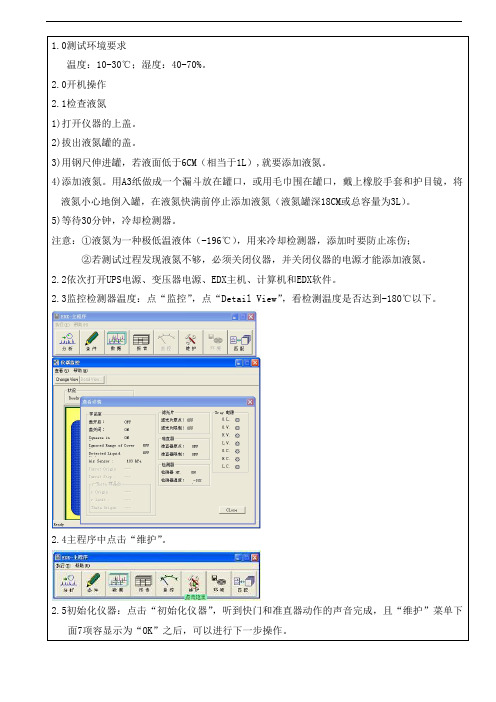
2.3监控检测器温度:点“监控”,点“Detail View”,看检测温度是否达到-180℃以下。
2.4主程序中点击“维护”。
2.5初始化仪器:点击“初始化仪器”,听到快门和准直器动作的声音完成,且“维护”菜单下面7项容显示为“OK”之后,可以进行下一步操作。
注意:如果3天以上没开机,就要做“光管老化”,自“2.5初始化仪器”以后做,做完后直接到“2.8仪器点检”。
光管老化操作:1)点击主程序“维护”。
2)点击“仪器设置”,将Xray的电压、电流分别输入5kV、5uA,点击“执行启动”约一分钟,关闭窗口(注意不能点击“保存启动条件”)3)放样品A750,点击“分析”→“分析组选择”→“定量”→“Set-up X-ray-tube”→“OK”→“开始”。
此过程将自动进行老化,约75分钟。
2.6启动X光管及检测器:点击“仪器设置”,再点击“执行启动”。
2.7预热30分钟:等待30分钟为预热X光管,让仪器处于稳定工作状态。
2.8仪器点检:用定性定量easy测试组别测试A750。
1)按EDX主机“OPEN”键打开样品室,将样品A750放在样品室测试孔上,并点击EyeXRF2k程序打开摄像头确认对准测试部位。
2)主菜单里点击“分析”。
xrf荧光光谱分析仪的使用流程
xrf荧光光谱分析仪的使用流程英文回答:XRF fluorescence spectroscopy is a widely used analytical technique for the qualitative and quantitative analysis of various materials. The instrument used for XRF analysis is called an XRF fluorescence spectrometer. Here is a step-by-step guide on how to use an XRF fluorescence spectrometer:1. Sample preparation: Prepare the sample by grinding it into a fine powder. The sample should be homogeneous and representative of the material being analyzed.2. Instrument setup: Turn on the XRF fluorescence spectrometer and allow it to warm up for the recommended time. Ensure that the instrument is properly calibrated and all necessary safety precautions are followed.3. Sample loading: Carefully load the prepared sampleinto the sample cup or tray of the XRF fluorescence spectrometer. Ensure that the sample is evenly distributed and covers the entire surface area of the cup or tray.4. Measurement configuration: Select the appropriate measurement configuration based on the nature of the sample and the elements of interest. This includes selecting theX-ray tube voltage, current, and filter settings.5. Measurement procedure: Start the measurement procedure by initiating the X-ray source. The X-ray beam will excite the atoms in the sample, causing them to emit characteristic X-ray fluorescence radiation.6. Data acquisition: The XRF fluorescence spectrometer will detect and measure the intensity of the emitted X-ray fluorescence radiation. This data is then used to determine the elemental composition and concentration of the sample.7. Data analysis: Analyze the acquired data using specialized software or algorithms. The software will compare the measured intensities with a calibration curveor a pre-determined database to determine the elemental composition and concentration of the sample.8. Interpretation and reporting: Interpret the results obtained from the analysis and report the elemental composition and concentration of the sample. Thisinformation can be used for quality control, material identification, or research purposes.中文回答:XRF荧光光谱分析仪是一种广泛应用于各种材料的定性和定量分析的分析技术。
XRF操作指引
XRF操作指引X射线荧光光谱仪(XRF)是一种非破坏性的分析仪器,广泛应用于材料分析、环境检测、地质勘探、工业生产等领域。
本文将为您介绍XRF 操作指引,以帮助您正确、高效地操作这一仪器。
一、准备工作1.确认XRF仪器的工作状态,检查电源和仪器各部件是否正常。
2.准备待分析的样品,并将其拆解成小颗粒。
如果样品是固体,可使用研磨机对其进行研磨;如果样品是液体,可进行溶解处理。
3.初始化仪器并校准。
校准仪器前需要使用标准样品进行测试,确保仪器能够准确分析样品。
二、操作步骤1.打开XRF仪器电源,等待仪器初始化完成后,将待测试样品放入样品槽中。
2.选择合适的分析程序,不同样品需要选择不同的程序,确保分析的元素和参数正确。
3.根据样品类型和尺寸,调整XRF仪器的参数,如电压、电流、分析时间等。
确保参数的选择足够精确,以保证测量结果的准确性。
4.点击“开始测量”按钮,仪器开始工作。
这个过程中需要保持样品的稳定性,避免样品的颗粒移动或高温熔化等情况发生。
5.等待测量过程完成,仪器会自动显示分析结果,包括样品中各元素的含量及相对误差。
根据实际需要,可将结果存储到计算机或打印出来。
三、注意事项1.在操作XRF仪器前,必须佩戴防护眼镜、手套等个人防护设备,以确保使用安全。
2.仪器需要定期维护和保养,及时清理样品槽和探测器表面等部件,防止杂质积聚影响测量结果。
3.在使用XRF仪器时,应避免将样品暴露在高温、高湿度等环境下,以免对样品造成损害。
4.样品的制备过程需要注意,避免样品中掺杂杂质对测量结果的干扰。
若样品复杂,建议进行预处理,如溶解、稀释等。
5.长时间连续使用仪器会产生一定的热量,为避免过热,应定时进行冷却、休息。
四、故障处理1.若XRF仪器出现异常,如无法正常启动、测量结果异常等,应首先检查仪器电源、参数设置等是否正确。
总结:通过正确操作XRF仪器,我们可以得到准确的样品分析结果,为科研、生产等领域提供有力的数据支持。
布鲁克傅里叶变换红外光谱仪显微镜说明书
简介 . . . . . . . . . . . . . . . . . . . . . . . . . . . . . . . . . . . . . . . . . . . . . . . . . . . . 25 冷却探测器 . . . . . . . . . . . . . . . . . . . . . . . . . . . . . . . . . . . . . . . . . . . . . . . 25 检查信号强度 . . . . . . . . . . . . . . . . . . . . . . . . . . . . . . . . . . . . . . . . . . . . . 27 观察模式下样品的摆放 . . . . . . . . . . . . . . . . . . . . . . . . . . . . . . . . . . . . . . 29 透过模式下的测量 . . . . . . . . . . . . . . . . . . . . . . . . . . . . . . . . . . . . . . . . . 31 反射模式下的测量 . . . . . . . . . . . . . . . . . . . . . . . . . . . . . . . . . . . . . . . . . 32 使用 FPA 探测器进行测量 . . . . . . . . . . . . . . . . . . . . . . . . . . . . . . . . . . . 33
对该仪器的任何部件所做的任何维修调整和校准都必须严格按照当地国家的相关安全标准进行
布鲁克器EMX-Plus X带电子参磁共振(EPR)光学仪器操作指南说明书
O PERATING I NSTRUCTIONS FOR THEE LECTRON P ARAMAGNETIC R ESONANCE (EPR)S PECTROMETER(M ODEL B RUKER EMX-P LUS)Location –BRWN5106Revised on – 2/2022A.I NTRODUCTIONThe Bruker EMX-Plus EPR is a general-purpose X band spectrometer that can be outfitted with a wide variety of sample cavities (resonators). Among the cavities available in addition to the standard cavity are: 1) an ER 4119 HS that is a high sensitivity cavity suitable for general use, 2) an ER 4116 DM useful in investigating forbidden EPR transition, 3) and ER 4123 DL for performing power saturation experiments on high dielectric samples. Many of these cavities will accommodate dewar inserts for temperature control.Due to the different needs of each research group and the variety of sampling techniques, each user is responsible for providing his/her sample preparation materials and notifying Research Instrumentation Center (RIC) staff when instrument reconfiguration is needed.The instrument is completely software driven using the WinEPR acquisition package provided by Bruker. There are no physical buttons or knobs. Fortunately, the user interface follows familiar Windows conventions. The figure below is a screen shot of the WinEPR Acquisition main window. This interface window can be divided into the five main areas described below.Menu Bar – Like all Windows programs, there is a Menu Bar at the top of the window used to access all other program features. All of the features listed in the other areas of the interface are directly accessible via the menu bar.Button Bar – This bar is located just below the Menu and can be toggled visible/invisible using the View option in the Menu bar. It is highly recommended to leave it visible since all spectrometer functions needed for data acquisitions are most easily accessed from the tool pallet. The table below shows each icon and lists its “tip strip”. The specif ic functions of many are discussed in the relevant sections below.New Spectrum Duplicate Spectrum Open Spectrum Save Spectrum Print Spectrum ExperimentalParametersExperimental OptionsComment ParametersRun / Stop ScriptRun AcquisitionStop AcquisitionStop Acquisition atEnd ScanTimes 2 Divide by 2 Expand Contract Change Center Fieldand Sweep WidthChange Center FieldChange Static FieldInteractive ReceiverLevelSend Spectrum toWinEPRSend Spectrum toSimfoniaReset Display Rectangular Zooming Cursor Moving Microwave Fine Tune Microwave Bridge ControlInteractive Spectrometer ControlInstrument Monitor – This area is located just below the Button Bar and shows the status of the microwave bridge and signal channel. The displays can be toggled visible/invisible by using the View option in the Menu bar.Data Area – This area fills the center of the screen and is populated by various windows. The windows can be any combination of spectra, parameters, and instrument control windows. Status Line – This is located at the bottom of the window and displays current instrument status and messages.B.O PERATION:S TARTUPFollow the procedure below to insure proper instrument operation. Although spectra can be obtained immediately after startup, waiting at least an hour for the magnet and electronic components to thermally stabilize before taking spectra is recommended.EMX S TARTUP1.Nitrogen Purge – Open the gas supply valve on the liquid nitrogen dewar. This will purgethe EPR cavity, waveguide, and microwave bridge of water vapor which absorbsmicrowave energy and oxygen which gives a signal since it is paramagnetic2.Cooling water – Open the two chilled water valves on the wall to the right of the computerdesk.3.Heat Exchanger –Use the rotary switch labeled “Heat Exchanger” located on the controlbox above the water filter. Be careful to not mistakenly push the Main power button.4.Magnet power supply – The magnet power supply not only controls current in the electromagnet but powers the console and microwave bridge as well. It is powered on in atwo-step process as detailed below.a.Press the ELECT. ON (Electronics) button in far left, upper corner. Wait for the fivered LED-warning lights on far right to extinguish before continuing. If the LEDs donot extinguish, confirm that the cooling water is on and repeat this step.b.Press POWER ON, which is located to the immediate right of the ELECT. ON switch.5.Console Power – Press the round button located in the lower, center of the cabinet. Thisalso provides power for the Microwave Bridge located on the top, left corner of the shelf above the electro magnet. The console houses: 1) Signal Channel – A phase sensitivedetector measuring the EPR signal by comparison with a signal of known frequency.2) Magnetic Field Controller – Controls both the magnitude and sweep rate of themagnetic field during a scan. 3) Modulation Amplifier – This unit provides the modulated reference signal for detection in the signal channel.NOTE –The console houses ~$150,000 of electronics.DO NOT set samples or your coffee on itC OMPUTER L OGONThe computer is usually left on and can be awakened by pressing any key on the keyboard. If the screen does not respond within 30 seconds of pressing a key, press the power button on the front of the case. At the Logon prompt e nter your “User Name” and “Password”. The “Domain” entry should be set to BoilerAD.Once logged on, WinEPR shortcuts are visible in the upper right-hand corner of the desktop. “WinEPR Acquisition” is the application used to run the spectrometer and obtain data. “WinEPR Processing” and “WinEPR SimFonia” are for analysis and simulation, respectively. This training document focuses only on the acquisition software and basic instrument operation.Launch the WinEPR Acquisition by double clicking its icon. It takes about 90 seconds for the software to fully launch. Once the window opens, click the Interactive Spectrometer Control button and click the “Calibrated” check box in the upper right of the window that opens.C. O PERATION:L OADING S AMPLESInserting / Changing Samples(Room Temperature)1.If the Microwave Bridge Controller window is not open, click on the Microwave Bridgebutton on the tool bar.2.Select the STANDBY or TUNE mode. See the image below.3.To avoid contaminating the cavity, clean the outside of the sample tube with a ChemWipe.4.Center the sample tube in the collet (loosen the collet ring if necessary) and gently slide itdown until either the sample is centered in the cavity or the tube is resting on the pedestal.Tighten the collet ring just enough to prevent the sample tube from moving.(Helium Variable temperature)1.If the Microwave Bridge Controller window is not open, click on the Microwave Bridgebutton on the tool bar.2.Select the STANDBY or TUNE mode. See the image below.3.Position the sample tube in the top-hat using the cavity gauge drawing to center the samplein the cavity. Tighten the top-hat ring so that the sample tube is snug.Notes – Do not over loosen or remove the upper portion of the top-hat.– The sample should be located in the center of the cavity for the best response.– Samples must be frozen prior to inserting them in the cavity!4.To avoid contaminating the cavity, clean the outside of the sample tube with a ChemWipe. Be sure to remove any frost.5.In as smooth and rapid a motion as possible remove the top-hat currently on the VT cavityand replace it with the new sample by carefully sliding the sample tube straight down into the cavity. Once the top-hat contacts the vent tube, apply gentle but firm pressure until the top-hat snaps into place.6.Tune the cavity and set parameters to the instrument as usual.7.Wait for the sample to thermally equilibrate (~10 minutes).Tuning the Microwave Cavity and Bridge1.If the Microwave Bridge Controller window is not open, click on the Microwave Bridgebutton on the tool bar.2.Select the TUNE mode. See the image below.e the pairs of up/down arrow keys set the attenuation to 25dB. The leftmost pairchanges in units of 10dB and the rightmost pair changes in 1dB units.e the right/left arrow buttons of the Frequency slider to center the tuning dip as shownabove. The system takes long fractions of a second to respond so do not click too fast.Use the right/left arrow buttons on the Signal Phase slider to adjust phase until the tuning dip is symmetrical as shown above. The system takes long fractions of a second torespond so do not click too fast.5.Either click the Up or Down arrow to start the cavity auto-tune process. The autotuneroutine will then adjust the frequency, phase, bias, and iris coupling for optimalperformance. Wait for this process to complete as indicated by the three green indicators in the left of the Instrument Monitor window.Note – If auto-tune fails, follow the procedure in Appendix C.6.Click the Microwave Bridge button to close the window.D. O PERATION:T AKING S PECTRASetting ParametersInstrument parameters may be loaded from disk by opening an existing spectrum, or set manually as described below. Whichever method is chosen it is important to verify that the cavity calibration file is loaded and is being used.1.Setting parameters manuallya.Click the New Spectrum button to ensure that a previously open spectrum is notaccidentally overwritten.b.Click the Experimental Parameters button and enter the desired parameters.Notesa)If looking for radicals centered around g = 2, check the box just above the “CenterField” numeric to automatically set the “Center Field” parameter.b)Microwave power – The range is 1 to 200 mW. Usual values are 1 to 20 mW.c)Modulation Amplitude – The range is 0.1 to ~20 (dependent on cavity) gauss. 5 to10 gauss is typical. The amplitude should be no higher than the width of thenarrowest line (in gauss) in the spectrum. See page 2-19 in the Bruker WinEPRacquisition manual for a discussion of over modulation.d)Receiver Gain – Typical range 100 to 5000.e)Conversion Time – This is the time allotted for the A/D process and directlyinfluences resolution in the Y-axis. This value multiplied by Resolution in X (# ofpoints collected across spectrum) yields the sweep time for the spectrum.f)Time constant – This value should be less than one tenth the time needed to scanthe narrowest line in the spectrum. See page 2-20 in the Bruker WinEPRacquisition manual for a discussion of using an excessively long time constant.g)If a single scan does not yield spectra with reasonable signal-to-noise, either of thetwo options below can help.a.Repetitive scanb.Increased time constant with either increased conversion time and/or Xresolution to slow the scan through the signal2.Loading/Verified cavity calibrationa.Click the Interactive Spectrometer Control button.b.Verify that the “Calibrated” check box in the upper right is checked.c.Click the “SCT Options” button at the lower right to open the Signal Channel Optio nsdialog shown below.d.Verify that the loaded calibration file in use matches the name of the cavity currentlyinstalled. See the table below for the calibration file names. If necessary, click the“Change File” button and select the proper file.Resonator Name Calibration FileER 4102 ST ST 0203.calER 4103 TM TM 9304.calER 4119 HS HS 0716.calER 4116 DM DM 0708.calER 4123 D D 0247.calAcquiring DataAfter setting the scan parameters, click the Run button to initiate data collection. Acquisition can be terminated immediately using the Stop Acquisition button or at the end of the current scan via the button. This latter operation is useful during averaging operations if the desired spectral quality has been achieved.E. I NSTRUMENT O PERATION:S HUTDOWN1.Set Microwave Bridge controller to STANDBYa.If the Microwave Bridge Controller window is not open, click on the MicrowaveBridge button on the tool bar.b.Select the STANDBY mode.2.Exit the WinEPR software.3.“Sign Out …” - Right click on your name at the top of the Windows “Start” menu.4.Remove the sample from the cavity and replace the cap.5.Power down in this order.a.Turn off the console by pressing the lit button in the center of the unit.b.Turn off the magnet power supply (PWR first and then ELECT).6.Turn off the Heat Exchanger – Be careful not to mistakenly push the Main power button.7.Close the chilled water valves.8.Close the nitrogen gas valve.9.Sign the logbook.F.C ONTACTSAdvance Methods Consultation Training and ServiceDr. Michael Everly Dr. Hartmut HedderichAmy Faculty, Director Snr. Instrumentation SpecialistDepartment of Chemistry Department of ChemistryOffice: BRWN 4151 Office: BRWN 4151Phone: 49-45232 Phone: 49-46543E-mail : ******************E-mail : *******************Appendix A – V ARIABLE T EMPERATURE O PERATION (C OLD E DGE) Using high purity helium as a coolant, sample temperature can be varied from 150 K to~5 K. This is done by flowing helium gas at the desired temperature through a dewar assembly installed within the cavity that surrounds the sample. The cold gas is generated by passing99.999% helium at room temperature through a heat exchanger connected to a Sumitomo closed-loop compressor system. This eliminates the need for using liquid helium and reduces the cost of operation by a factor of 10.Due to the extreme low temperatures, great care must be taken when inserting samples not to thermally stress the sample/cavity, contaminate the cavity with room temperature air, or crush the heater and thermocouple that sit just below the sample. To reduce the thermal shock, which usually results in broken sample tubes, all samples MUST be frozen in liquid nitrogen before placing them in the cavity. Prefreezing samples also greatly reduces the time needed for temperature equilibration. Sample tubes MUST be rigorously cleaned to avoid cavity contamination. Wash your sample tubes between uses with an appropriate solvent and wipe them off with a ChemWipe before inserting them in the cavity. System maintenance due to contamination by a carless user may be billed to the PI at a cost of $60/hr with a 4-hour minimum!P ROCEDURES–The procedures below are intended to be used as needed and are not listed sequentially.S TARTUP,C OOL-D OWN,S HUTDOWNDue to the complexity of the ColdEdge VT system, center staff will perform these operations. Users will need to coordinate startup and shutdown times with center staff.S ETTING T EMPERATUREThe Oxford Instruments Cryostat and LakeShore controller combination uses a heater to warm the flowing cold helium gas to the desired temperature. To set the temperature press the “Setpoint” button and enter the desired temperature and hit “Enter”. If you find that you have entered an incorrect value or menu that you didn’t want, simpl y press the cancel button.C HANGING/I NSERTING S AMPLES1.Place the Microwave Bridge Controller in STANDBY mode.2.With one hand, remove the sample/cap from the cavity. With the other hand, insert thenew sample.Notes – This must be done as quickly as possible to prevent room temperature air from entering the cavity.– Samples must be frozen prior to inserting them in the cavity!3.Tune the cavity and set parameters to the instrument as usual.4.Wait for the sample to thermally equilibrate (~10 minutes) and fine-tune the cavity.Appendix B – M ANUAL T UNING THE M ICROWAVE C AVITY In case the automatic tuning operation (in Part V. of the training outline) fails to properly tune the cavity and bridge, a message indicating this failure will be shown in the mode indicator in the center of the microwave bridge controller display.Some samples may be somewhat "lossy," i.e., the sample or solvent changes the conditions in the cavity to decrease the cavity absorption dip. If this effect is only minimal, it may still be possible to manually tune the cavity and bridge by the following procedure.If the sample is very "lossy," it may be impossible to observe a sufficient cavity dip for lock-on by the control system. If the control system cannot be stabilized as indicated by inability to center the LOCK OFFSET meter or the DIODE CURRENT meter, then a different (aqueous) cavity will need to be installed. Contact RIC staff to make this change.Manually Tuning Procedure (Summarized from section 5.1of the WinEPR acquisition manual)1.If the Microwave Bridge Controller window is not open, click on the Microwave Bridgebutton on the tool bar.2.Select the TUNE mode. See the image below.e the pairs of up/down arrow keys set the attenuation to 25dB. The leftmost pairchanges in units of 10dB and the rightmost pair changes in 1dB units.e the right/left arrow buttons of the Frequency slider to center the tuning dip as shownabove. The system takes long fractions of a second to respond so do not click too fast.5.The dip should cover come about 2/3 of the way to the baseline. If the dip is too small orlarge, decrease or increase, respectively the attenuation in 1dB steps.e the right/left arrow buttons of the Signal Phase slider to adjust phase until the tuningdip is symmetrical as shown above and is as deep as possible. If the dip points up, the phase is 180 degrees off. If it has positive and negative lobes, it is ~90 degrees off. The system takes long fractions of a second to respond so do not click too fast.7.Select the Operate mode and then fine-tune the Frequency to center the AFC indicator inthe Instrument Monitor window. Readjust as needed if the AFC drifts during subsequent steps.8.Set attenuation to 50dB and use the right/left arrow buttons of the Bias slider to center theDiode Current meter (200 µA) in the Instrument Monitor Window9.The steps below adjusting the iris (critical coupling) are iterative in nature.a.Lower the attestation by 10dB.e the Up/Down keys of the Iris, bring the diode current back to center.c.Repeat the steps above until reaching 10dB.Note – If the AFC lock drifts, center it by adjusting the frequency.10.While at 10dB of attenuation, adjust phase to achieve maximum Diode current.11.Cycle through 10, 20, 30, 40, 50 dB to verify that the Diode current remains constant. Ifnot, repeat the tuning process.12.Click the Microwave Bridge button to close the window.Page B2。
- 1、下载文档前请自行甄别文档内容的完整性,平台不提供额外的编辑、内容补充、找答案等附加服务。
- 2、"仅部分预览"的文档,不可在线预览部分如存在完整性等问题,可反馈申请退款(可完整预览的文档不适用该条件!)。
- 3、如文档侵犯您的权益,请联系客服反馈,我们会尽快为您处理(人工客服工作时间:9:00-18:30)。
应用SPECTRA plus作你的第一条校准曲线目录应用SPECTRA plus作你的第一条校准曲线简介建立校准曲线了解校准曲线工具箱开始作校准曲线Si KA1 HS-Min的校准曲线如何检查计算的浓度是否被接受P KA1-HS-Min 的校准曲线S KA1 HR-Min的校准曲线V KA1-HS-Min的校准曲线Cr KA1-HS-Min的校准曲线Mn KA1-HR-Min的校准曲线V KA1 HS-Min的校准曲线Ni KA1-HS-Min的校准曲线Cu-KA1-HS-Min的校准曲线漂移校正/重校正低合金未知样品的测量使用Results Monitor功能监视分析结果查询结果转移结果再评估测量数据结论简介本教学课程包括下列内容,以便使你熟悉制作校准曲线的过程:l建立校准曲线l组织材料l输入标准浓度到数据库l定义测量方法l了解校准曲线工具l校准已测量的低合金样品l用低合金曲线测量未知样品l使用结果管理器按照这一部分的介绍,你可以一步一步地制作你的第一条校准曲线。
使用一套BCS低合金标样,SPECTRA plus谱线库中预定义的谱线及扫描测量模式,你的任务是绘制低合金样品的校准曲线。
由于所有的样品已经在德国Bruker AXS 公司测量过,不需要在你的仪器上进行实际的测量。
为了得到所显示的相同结果,必须仔细地按照所有步骤进行。
建立校准曲线从SPECTRA plus程序或桌面打开Quantification Editor (FQuant) 程序。
图 1 桌面上的Spectra Plus程序文件夹选择 File > New.选择左侧(引导窗口一侧) "Materials" 。
在右侧出现一个对话框,并列出一个或多个预定义的材料。
图 2 材料页在"Material Groups" 材料组窗口中,选择"Tutorial"教学材料组(如果它不存在的话,请输入Tutorial并且点击新文件按钮(红圈), 见下面注解)。
注解: "Tutorial" 教学材料组应该已经在你的数据库中(并且出现在列表中)。
如果是这样,只需要点击它来选择它。
如果Tutorial组不在列表中,请参考附件“安装教学文件”来查看教学文件是否已经被正确安装。
从材料列表中选择材料"tutor-low-alloy" 低合金教学材料(如果它不存在的话,请输入tutor-low-alloy-steel作为“新材料”,然后点击新文件按钮(红圈)来创建此材料,使其在列表中出现。
图 3 输入新材料步骤1图 4 输入新材料步骤2按“Next”下一步键。
出现"Elements Oriented" 元素导向对话框。
确认没有按下"Oxide"氧化物按钮。
选择要测量的元素,按照右面的列表显示,按照这样的顺序选择元素有利于以后浓度的输入。
图 5 选择被测量的元素按“Next”下一步键两次。
"Standard Materials" 标准材料对话框出现。
这里你可以输入标准样品的名字及它们的浓度。
图 6 往数据库中输入标样浓度如果没有标样显示的话(见图6),在“New standard material”新标准材料的地方输入标样的名字,并且按下新文件按钮(红圈)。
重复此过程,将所有的标样名输入。
确信使用与附录中低合金标样完全相同的名字。
一旦输入完所有的标样名,开始按下面介绍的输入浓度值。
提示:如果你习惯于将所有标样中某一元素的浓度全部输完的话,请按下Bottom按钮,在你输入浓度值并按<Enter>键之后,光标将向下移动。
由于没有Fe的分析值,我们将它处理为平衡元素(余量)。
鼠标右键点击Fe元素列,从属性菜单中选择“Column Balance”平衡列按钮(图7)图 7 选择Fe作为平衡项结果如图8显示图 8 输入所有低合金标样按“Next”下一步键,出现下列窗口。
选择“Yes”, 标准样品的名字及浓度将被存在数据库中(FLUO.MDB)。
图 9 检查制样方法确认"Preparation" 制样为“Solid”及"Method" 方法为“Solid”(这些是预先定义的制样方法)按“Next”下一步键直到光标移到左边的"Standard Samples"标准样品位置。
图 10 创建标准样品通过选择"All standard materials",选择"Short names",然后按"Automatically create all standard samples" 自动创建所有标准样品按钮(红圈)。
注:在这一部分,在数据库中输入的浓度与一个样品的实际制样方法有关,为了区别同一个标样不同的制样方法,你可以选择长样品名。
在此SS_401-1 样品将被称为SS_401-1-solid(样品名-制样方法)。
这时要将"Short names"复选框清除。
(推荐选择长样品名)图11 所有标准样品已被创建按“Next”键两次图 12 测量方法按“Launch”调入按钮,击活“Measurement Method”测量方法程序。
你将在“Measurement Method”测量方法中选择测量谱线、测量时间等。
图13 创建低合金测量方法:设置参数选择"Vacuum"真空模式及"34mm" 准直器面罩点击“Elements”按钮,检查SPECTRA plus是否选择了要测量的元素。
图 14 创建低合金测量方法:元素选择注意Fe没有被选择,因为我们将Fe作为平衡元素。
点击“Line Selection”按钮图15 创建低合金测量方法:谱线选择选择“Use precalibrated lines“,使用预校准线选择"One Line", "Highest Intensity" 及"Thick sample" (这些是默认选择). 这些信息连同所选择的元素将使SPECTRA plus为你作出正确的谱线选择。
点击“Apply-应用”按钮点击“Modes/Times”按钮图 16 创建低合金测量方法:模式及测量时间选择按“Run Scan Measurement”按钮分别用于峰值测量及背景测量。
如不想选择,再一次按相同按钮即可。
选择强度“Intensity reduction”及“Automatic calibration”控制扫描测量,确保计数率在计数器的线性范围之内。
(参考关于计数器死时间的理论介绍部分)。
比较图16中的设置注:所选设置为“GLOBAL”全局设置,在所选谱线峰位左右扫描+/- 10倍的准直器角度,步长为准直器角度的10%。
扫描时间为扫描角度范围内测100秒。
扫描模式可以使你不用确定一个或多个背景位置而能计算出净强度。
(通常采用“Peak/Background”峰/背景模式,可以使测量时间缩短)。
点击“Lines”按钮,从下拉窗口中选择S。
可以看出在左边"S KA1 HS Min" 的谱线已经被选择。
HS 代表高灵敏度(High Intensity)Min 代表微量组分本教学数据对S和Mn选择高分辨率谱线,所以预先选择的谱线必须更换。
用HR-Min谱线代替SPECTRA plus选择的HS-Min谱线来测量S和Mn,以便和测量的数据条件一致。
用另外的谱线(KA1-HR-Min line)代替所选的谱线需要进行如下操作:选择左边的"S KA1-HS-Min" 谱线点击“Remove”移动键选择右边的"S KA1-HR-Min" 谱线(所有的谱线都在那里显示)。
点击“Add”按钮。
图 17 创建低合金测量方法:移动谱线图18 创建低合金测量方法:添加谱线选择结果如图18所示对Mn进行同样的步骤(选择"Mn KA1-HR-Min" 谱线)。
结束之后,点击"File"/"Exit",退出测量方法编辑图19 退出测量方法编辑程序点击“Yes”保存新的或修改过的测量方法。
按“Next”键两次("Measurement Standards" 光标跳到引导窗口的测量标准样品按钮(左侧)。
图 20 击活“Loader”模拟进样器测量标样按“Launch”击活“LOADER”图 21 选择“Import from Database”从数据库引入点击一个位置(这里显示为D1)选择“Standards" - "Import from Database"。
图 22 从数据库查询引入的标样检查“Material”材料是否为“tutorial-low-alloy”及“Preparation”制样是否为“solid”按“Search from database”从数据库搜索按钮按“Import at current position ”从当前位置引入按钮图 23 引入了样品的模拟进样器,准备进行测量!要测量样品(本例中不能这样做!),按“Send all samples ”全部送入样品按钮,开始测量。
为了检查测量进程,看窗口底下的样品列表,或移动鼠标的光标到带有圆点闪烁蓝色图标的样品上。
返回到仍在运行的“Quantification editor”程序按“Next”键图 24 调入结果输出格式程序“results formatting”按“Launch”按钮,定义打印及显示格式图25 在“Results Manager”结果管理中更新设置在tutor-low-alloy同一行后面按“Update”键。
这将选择默认的设置(在前面"Standards" 那一页定义的元素顺序及小数点位数)选择File>Exit图 26 保存结果输出格式输入“tutor-low-alloy”,然后按“Save”键按“Next”键两次图27 校准方法本页你可以看到选择了哪一种材料及制样方法以及对于这种材料定义了多少标样。
图28 标准样品此功能为删除没有测量的标样。
你可以看出如果所有的标样都测量了,在标有"File"的那一列有"Exist"文字,表明可以进行校准。
图 29 校准曲线现在你将准备进行校准:但是在校准之前,看一看校准曲线工具箱了解校准曲线工具箱在这一部分,你将了解校准曲线画面及工具箱。