虚拟示波器使用手册
mplab data visualizer中文手册
mplab data visualizer中文手册MPLAB Data Visualizer是一款由Microchip Technology开发的数据可视化工具,旨在帮助开发人员更好地分析、监视和调试嵌入式系统中的数据。
本文将为您提供关于MPLAB Data Visualizer的详细介绍,以及如何使用它来优化您的项目。
一、简介MPLAB Data Visualizer是Microchip官方提供的一款免费工具,可与多种Microchip开发板、调试器和仿真器配合使用。
它提供了一种直观且强大的方式,用于可视化您的嵌入式系统中的数据流,并能与MPLAB X IDE集成,为您提供全面的开发环境。
二、安装和配置要开始使用MPLAB Data Visualizer,您需要首先下载并安装MPLAB X IDE。
在安装MPLAB X IDE之后,您可以通过以下步骤来添加Data Visualizer插件:1. 打开MPLAB X IDE,并在菜单栏中选择"Tools"(工具)> "Plugins"(插件)。
2. 在Plugins窗口中,选择"Available Plugins"(可用插件)选项卡。
3. 在搜索框中输入"MPLAB Data Visualizer",然后找到相应的插件。
4. 单击"Install"(安装)按钮,然后按照提示完成安装过程。
安装完成后,您可以在MPLAB X IDE的工具栏中找到MPLAB Data Visualizer的图标,单击它即可打开该工具。
三、主要功能和用法MPLAB Data Visualizer提供了一系列强大的功能,帮助您更好地理解和分析嵌入式系统中的数据。
以下是一些常用功能:1. 虚拟示波器:MPLAB Data Visualizer内置了一个虚拟示波器,可以实时显示来自开发板的模拟和数字信号。
虚拟示波器使用手册范本
虚拟示波器使用手册一、软件安装说明软件安装包括USB数据采集卡驱动程序安装和虚拟示波器软件安装。
1、安装USB数据采集卡驱动程序本虚拟示波器使用前必须先正确安装USB数据采集卡驱动程序。
其安装步骤如下:(1)将USB通信电缆的方形接口插入数据采集卡,USB通信电缆的另一端插入计算机的USB 通信口。
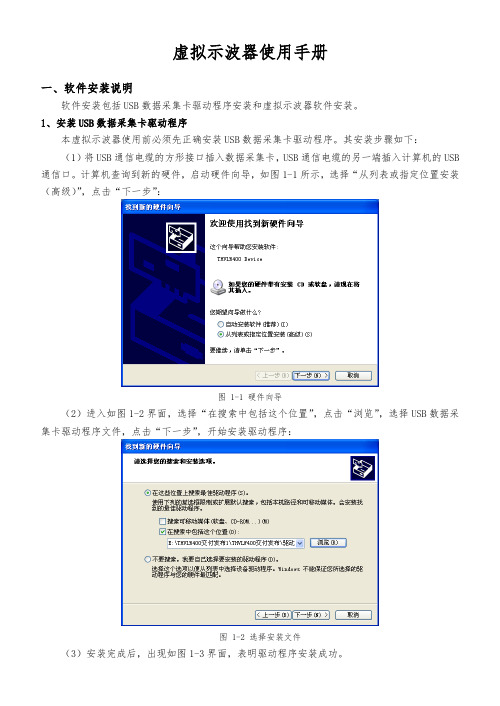
计算机查询到新的硬件,启动硬件向导,如图1-1所示,选择“从列表或指定位置安装(高级)”,点击“下一步”:图 1-1 硬件向导(2)进入如图1-2界面,选择“在搜索中包括这个位置”,点击“浏览”,选择USB数据采集卡驱动程序文件,点击“下一步”,开始安装驱动程序:图 1-2 选择安装文件(3)安装完成后,出现如图1-3界面,表明驱动程序安装成功。
图 1-3 安装完成如果在使用虚拟示波器过程中,出现数据采集不正确现象,应卸载已经安装的USB数据采集卡驱动程序,将USB通信电缆插入计算机的其他USB通信口,重新安装USB数据采集卡驱动程序。
2、安装虚拟示波器软件(1)点击文件夹“虚拟示波器软件安装包”,选择“setup.exe”安装程序,进入如图1-4界面:图 1-4 软件安装向导(2)第一步完成后,进入如图1-5界面:图 1-5 选择目标路径(3)选择好安装位置后,点击“下一步”,进入如图1-6界面:图 1-6 许可协议(4)选择“我接受该许可协议”,点击“下一步”,进入如图1-7界面:图 1-7 准备安装(5)点击“下一步”,进入如图1-8界面:图 1-8 开始安装(6)程序开始安装,安装完成后进入如图1-9界面,表明程序安装成功。
图 1-9 安装完成安装过程中尽量采用默认安装。
安装完成之后,系统如果提示需要重新启动电脑,请保存好各类文档,然后重新启动。
二、软件操作说明1、软件介绍虚拟示波器软件是专门为传感器系列实验台教学实验开发的辅助软件。
它配有USB数据采集卡,完成采集和测试功能。
本软件具有操作简单,界面友好,简单易用等优点。
虚拟示波器使用手册

• 描绘放大器和滤波器的频率响应曲线图(波特图) PCS500 虚拟示波器使用手册
时基刻度有线 性或对数两种 选择
运行原理 : FFT ( 快 速 傅 立叶变换)
FFT 解析度 : 2048 线
FFT 输 入 通 道 : CH1 或 CH2
缩放功能 对频率和振幅
PCS500 虚拟示波器使用手册
第 4 页/共 11 页
浙江天煌科技实业有限公司
•
当新的示波器工作一个小时后,这个选项将被使用。这个选项操作如下:在不同
的电压
•
/每格和时间/每格范围内,轨迹 Y 轴位置(偏移)的精细调整。
•
设置轨迹标志(在屏幕的左边)以校正轨迹 GND 电平。
•
设置触发电平标志以校正触发电平。
矩型窗
-13 dB
窄
巴特勒特窗
-25 dB
平均
海宁窗
-31 dB
平均
汉宁窗
-41 dB
平均
布莱克曼窗
-57 dB
宽
2)FFT 选项 最大值
在运行模式中每个频率最大值被显示。
这个选项能被作为一个频率功能(波特图示)用于记录信号电平。你能使用电子数据表
显
示包含着频率标签的频率响应曲线。在文件菜单中,单击保存 FFT 数据输出数据到电 子数据表。
进行标注测量
最小采样数 : 1 点 / 20s
对时基和振幅进 行标注
缩放功能 在屏幕上记录和
显示 数据格式 :
ASCII
第 3 页/共 11 页
浙江天煌科技实业有限公司
• 显示记录逐点频率的电压值或分贝值
• 频率刻度有线性或对数两种选 择
picoscope示波器使用方法
picoscope示波器使用方法
PicoScope示波器是一种常用的电子测试仪器,用于捕捉和分析电信号。
下面是PicoScope示波器的使用方法:
1. 连接设备:将PicoScope示波器与电脑连接,通过USB接口或者其他连接方式进行连接。
2. 打开软件:在电脑上打开PicoScope示波器软件,并根据需要选择对应的设备型号和通道数。
3. 设置垂直参数:调整垂直缩放、偏移和增益等参数,以便正确显示电压信号。
4. 设置水平参数:设置时间基准和采样率,以便适当捕捉所需的信号波形。
5. 选择触发器:根据需要选择触发器类型和触发电平,以便自动触发信号捕捉。
6. 捕捉信号:点击“开始”按钮,示波器将开始捕捉并显示所需的信号。
7. 分析信号:使用示波器软件提供的测量工具,如幅值、频率、相位等计算来分析捕捉到的信号特征。
8. 存储和导出数据:根据需要,可以将数据保存为文件或导出为其他格式,以备后续分析和处理。
9. 断开连接:使用完毕后,及时断开示波器与电脑的连接。
请注意,以上是一般的使用方法,具体步骤和操作界面可能因不同型号和软件版本而有所不同。
建议用户在使用前仔细阅读使用手册或参考相关的操作指南。
虚仪科技 VT DSO-2810R 使用说明书
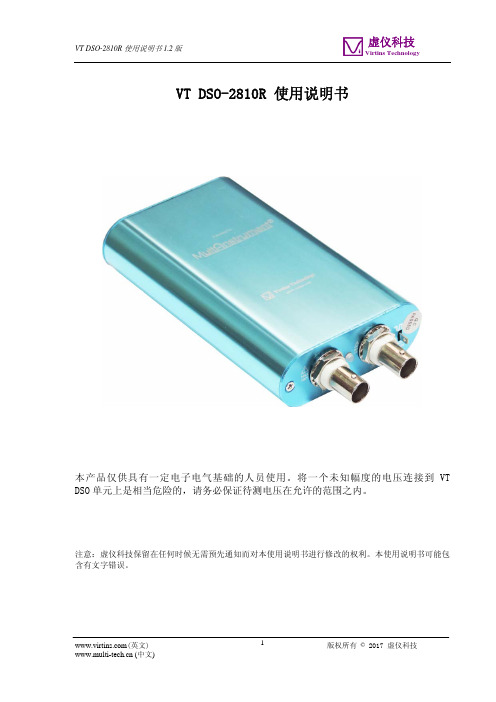
VT DSO-2810R 使用说明书本产品仅供具有一定电子电气基础的人员使用。
将一个未知幅度的电压连接到VT DSO单元上是相当危险的,请务必保证待测电压在允许的范围之内。
注意:虚仪科技保留在任何时候无需预先通知而对本使用说明书进行修改的权利。
本使用说明书可能包含有文字错误。
目录1 安装及快速上手指南 (3)1.1系统组成 (3)1.2安装M ULTI-I NSTRUMENT软件 (4)1.3安装硬件驱动程序 (4)1.3.1 安装步骤 (4)1.3.2 安装验证 (10)1.4启动M ULTI-I NSTRUMENT软件 (11)1.5调零 (11)1.6探头校准 (12)1.7硬重置 (13)1.8独有特性 (13)1.8.1 示波器的基于硬件DSP的位分辨率增强 (13)1.8.2 示波器的普通帧模式、记录模式和滚动模式 (15)1.8.3 示波器的数字触发和触发频率抑制 (17)1.8.4 示波器的余辉模式 (17)1.8.5 外触发信号输入通道作为数字输入通道(不适用于本型号) (18)1.8.6 频谱分析仪的抗混滤波器 (18)1.8.7 信号发生器的DDS和数据流模式(不适用于本型号) (18)1.8.8 信号发生器的DDS插值算法(不适用于本型号) (19)1.8.9 数据采集和数据输出可同时进行(不适用于本型号) (19)1.8.10 校准和重新校准(不适用于本型号) (19)1.8.11 可升级的软件、固件和基于硬件的DSP算法 (21)1.9非例行应用 (21)1.9.1 频率响应测试 (21)1.9.2 失真、噪声电平和窜扰测量 (23)1.9.3 测量派生量 (24)1.9.4 一些预配的测试的参数设置 (24)2 性能指标 (27)2.1VT DSO-2810R硬件性能指标 (27)2.2P6060示波器探头硬件性能指标 (30)2.3M ULTI-I NSTRUMENT软件性能指标 (30)2.4二次开发接口指标 (36)3 MULTI-INSTRUMENT软件使用许可证信息 (38)3.1软件使用许可证类别 (38)3.2软件使用许可证升级 (38)3.3同级软件升级 (38)4 MULTI-INSTRUMENT软件的扩展使用 (39)5 测试实例 (40)6 安全指示 (42)7 产品质保 (42)8 免责声明 (42)1 安装及快速上手指南这是一款由Virtins Technology(虚仪科技)设计和研发的第二代USB虚拟示波器。
虚拟仪器使用说明书

EzDSO系列多功能示波器用户手册Ver 1.12006.8目录首页:目录: (1)示波器篇第一章:系统介绍 (3)1.1特点介绍 (4)1.2性能参数 (4)1.3应用领域介绍 (6)1.4开箱检查 (6)第二章:仪器的安装、连接2.1检查电源电压 (7)2.2操作环境 (7)2.3电脑系统要求 (7)2.4仪器的接口 (7)2.5仪器与电脑、测试线的连接 (8)第三章:软件的安装3.1安装驱动程序 (9)3.2安装应用软件 (10)3.3拷贝仪器调整参数文件到安装目录 (12)第四章:软件与仪器的使用4.1为仪器上电 (13)4.2启动程序 (13)4.3主程序界面 (14)4.3.1菜单区域介绍 (14)4.3.2快捷键区域介绍 (18)4.3.3显示区域介绍 (19)4.3.4仪器控制面板区域介绍 (22)第五章:快速操作指南 (25)逻辑分析仪篇第六章:逻辑分析仪介绍6.1 ezLA逻辑分析仪外观 (26)6.2 ezLA逻辑分析仪性能参数 (26)6.3 ezLA逻辑分析仪对系统要求 (27)第七章:软件介绍7.1 软件的安装 (28)7.2 软件功能介绍 (30)第八章:操作向导8.1 时钟信号测量 (37)8.2 总线测量 (38)8.3 逻辑电平测量 (39)信号发生器篇第九章:信号发生器介绍 (40)附录一:如何校准仪器 (45)附录二:技术支持 (47)第一章:系统介绍承蒙您选购ezDSO系列多功能示波器!其功能强大、结构小巧,一定会成为您研发、查错、维修中的最佳助手!该仪器包含两个测量通道,支持多种触发方式以及测量模式。
最高采样频率可以达到100Msps,存储深度最大可到256K。
部分型号还包含任意信号发生器,逻辑分析仪器。
相对于普通的模拟示波器,其功能更加强大、多样,结构更加简洁、小巧,方便携带。
适用于一般的电子产品\设备的研发、维修、测试等领域。
同时也非常适合应用在教育以及职业培训中,比如建设信号与处理实验室、EDA实验室、单片机实验室等等。
虚拟仿真示波器的调节与使用
虚拟仿真示波器的调节与使用一、实验目的1.学习虚拟双踪示波器的基本结构与工作原理,学习基本的操作使用方法。
2.学习虚拟函数信号发生器的操作使用方法。
3.利用虚拟双踪示波器观察虚拟函数信号发生器的各种周期性信号(正弦波、三角、方波、锯齿波)的波形图,测量电压信号的周期、峰值、有效值和峰峰值。
4.利用虚拟双踪示波器观察李萨如图形,测量未知正弦信号频率实验原理相互垂直正弦信号合成李萨如图三、实验仪器:虚拟双踪示波器,虚拟信号发生器四、实验内容及数据记录1.虚拟仪器的使用1)启动计算机,打开虚拟示波器软件,阅读帮助文件,了解基本的软件使用方法。
2)点击电源开关按钮,打开模拟示波器电源以及模拟信号发生器电源,然后改变信号发生器的波形设置,分别输出正弦波、方波、三角波,并改变输出电压和频率,使用虚拟仪器测量电压,调整各种参数设置,掌握各参数的作用。
(1)将模拟信号器产生的正弦信号输入到示波器CH1(或CH2输入端;(2)调节“垂直位移”及“水平位移”旋钮找到信号;(3)调节CH1通道的“垂直偏转系数旋钮”和“扫描时基系数旋钮”,使一个周期以上的正弦波信号显示在荧光屏内;(4)选择未知信号输入通道CH2(或CH1 ,使波形稳定用示波器测量电压时,一般是测量其峰峰值「「「,即从波峰到波谷之间的值,如图所示。
实验时利用荧光屏前的刻度标尺分别读出与电压峰峰值对应的垂直方向的距离匚及一个周期波形所对应的水平方向距离:,则亠(V/格)'-■ 「三二卄(秒/格)2..数据记录信号发生器示波器测量结果频率(Hz)电压(V)输岀衰减(dB)Y周灵敏度mV/格Y格扫描速度格/秒X格U P PVTmsFHz1000250023.观察李萨如图把两个正弦信号分别加到垂直与水平偏转板,则荧光屏上光点的运动轨迹是两个互相垂直的谐振动的合成。
当两个正弦信号频率之比为整数之比时,其轨迹是一个稳定的闭合曲线。
例如,垂直方向信号的频率二是水平方向信号频率「的2倍时,合成结果得到如图3所示的闭合曲线。
HT6000BC虚拟示波器使用手册
USER’S MANUALHANTEK 6000BC/HANTEK 6000BDV1.0.0ContentGeneral Safety Summary (3)Chapter 1 Getting Start (4)1.1 System Requirement (5)1.2 Install Software (6)1.3 Install Driver (8)1.4 General Features (14)1.5 General Check (15)1.6 Function Check (17)1.7 Self Calibration (18)1.8 Accessories (19)Chapter 2 Operating Basics (20)2.1 The User’s Interface (21)2.2 The Menu System (22)1.3 The Vertical System (24)2.4 The Horizontal System (26)2.5 The Trigger System (26)2.6 Input Connector (27)Chapter 3 Oscilloscope Functions (29)3.1 Setup the Oscilloscope (30)3.2 Set Vertical System (31)3.3 Setup Horizontal System (37)3.4 Set Trigger System (38)3.5 Save/Load (43)3.6 Utility Function (44)3.7 Measure Signal (49)3.8 The Display System (54)3.9 Zoom In/Out and Drag Waveforms (58)3.10 Interpolation (59)3.11 Acquisition Modes (62)3.12 Print And Print Preview (62)Chapter 4 Application Example (64)4.1 Simple Measurement (65)4.2 Capturing a Single-Shot Signal (66)4.3 The Application of the X-Y Operation (66)4.5 Taking Cursor Measurements (68)4.7 Waveform Generator (71)Chapter 5 Appendix (78)Appendix A: Specifications (79)Appendix B: Accessories (81)Appendix C: General Maintenance (82)General Safety SummaryReview the following safety precautions carefully before operate the device to avoid any personal injuries or damages to the device and any products connected to it.To avoid potential hazards use the device as specifi ed by this user’s guide only.■To Avoid Fire or Personal Injury■Use Proper Power Cord. Use only the power cord specified for this product and certified for the country of use.■Connect and Disconnect Properly. Do not connect or disconnect probes or test leads while they are connected to a voltage source.■Connect and Disconnect Properly. Connect the probe output to the measurement device before connecting the probe to the circuit under test. Disconnect the probe input and the probe reference lead from the circuit under test before disconnecting the probe from the measurement device.■Observe All Terminal Ratings. To avoid fire or shock hazard, observe all ratings and markings on the product. Consult the product manual for further ratings information before making connections to the product.■Use Proper Probe. To avoid shock hazard, use a properly rated probe for your measurement.■Avoid Circuit or Wire Exposure. Do not touch exposed connections and components when power is on.■Do Not Operate With Suspected Failures. If suspected damage occurs with the device, have it inspected by qualified service personnel before further operations.■Provide Proper Ventilation. Refer to the installation instructions for proper ventilation of the device.■Do not operate in Wet/Damp Conditions.■Do not operate in an Explosive Atmosphere.■Keep Product Surfaces Clean and Dry.Chapter 1 Getting StartThe oscilloscope is small, lightweight, no external power required, portable oscilloscopes! The oscilloscopes is ideal for production test, research and design and all of the applications involving analog circuits test and troubleshooting, as well as education and training.In addition to the list of general features on the next page, this chapter describes how to do the following tasks:◆System Requirements◆Install Software◆Install Driver◆General Features◆General Check◆Function Check◆Self Calibration◆Accessories1.1 System RequirementTo run the oscilloscope software, the needs of computer configuration are as follows: Minimum System RequirementsOperating SystemWindow XP/Vista/Win7ProcessorUpwards of 1.00G processorMemory256M byteDisk Space500M disk free spaceScreen resolution800 x 600Recommended ConfigurationOperating SystemWindows XP SP3 Syst emProcessor2.4G ProcessorMemory1G Byte MemoryDisk Space80G Disk SpaceScreen resolution1024 x 768 or 1280 x 1024 resolutionDPI SettingNormal Size (96DPI)1.2 Install SoftwareCaution: You must install the software before using the oscilloscope.1. While in Windows, insert the installation CD into the CD-ROM drive.2. The installation should start up automatically. Otherwise in Windows Explorer, switchto the CD-ROM drive and run Setup.exe.3. The software Installation is started. Click 'Next' to continue.4. Choose a destination directory. Click 'Next' to continue.5. Check the setup information. Click Next to start copying of files.6. This Status dialog is displayed during copying of files.7. Updating Your System Configuration.8. The installation is complete.1.3 Install DriverExample: HANTEK 6000B1.Connect the A-Type Plug of USB c able to your PC’S USB port.2.Connect the other A -Type Plug of USB cable to the device’s USB port.3.New hardware is found.4.Click right mouse and select “Manage”.Hantek 6000BC/Hantek 6000BD Digital Oscilloscope5.Click right mouse and select “Update Driver Software”.Hantek 6000BC/Hantek 6000BD Digital Oscilloscope6.Select “Browse my computer for driver software”.7.Select the right driver path, click “Next”.8.Click “Install this driver software anyway”.9.Installing driver software…10.Hantekxxxx USB has been successfully installed.follows1.4 General FeaturesProduct Features:■Four Channels, Max Bandwidth:250MHz/200MHz/100MHz/70MHz■Maximum real-time sample rate:1GSa/s■Memory depth:64K /CH■Automatic setup for ease of use (AUTOSET);■Built-in Fast Fourier Transform function(FFT);■20 Automatic measurements;■Automatic cursor tracking measurements;■Waveform storage, record and replay dynamic waveforms;■User selectable fast offset calibration;■Add, Subtract and Multiply Mathematic Functions;■Selectable 20 MHz bandwidth limit;■Waveform average;■Adjustable waveform intensity, more effective waveform view; ■User interface in several user-selectable languages;1.5 General CheckPlease check the instrument as following steps after receiving an oscilloscope:Check the shipping container for damage:Keep the damaged shipping container or cushioning material until the contents of the shipment have been checked for completeness and the instrument has been checked mechanically and electrically.Check the accessories:Accessories supplied with the instrument are listed in "Accessories" in this guide. If the contents are incomplete or damaged, please notify the franchiser.Check the instrument:In case there is any mechanical damage or defect, or the instrument does not operate properly or fails performance tests, please notify the franchiser.Probe CompensationPerform this function to match the characteristics of the probe and the channel input. This should be performed whenever attaching a probe to any input channel at the first time.■From the “Probe” menu, select attenuation to 1:10. Set the switch to “X10” on the probe and connect it to CH1 of the oscilloscope. When using the probe hook-tip, insert the tip onto the probe firmly to ensure a proper connection.■ Attach the probe tip to the Probe Compensator and the reference lead to the ground connector, select CH1, and then press the “AUTOSET“ button into the menu or the toolbar.■ Check the shape of the displayed waveform.Correctly CompensatedOver CompensatedUnder Compensated1. I f necessary, use a non-metallic tool to adjust the trimmer capacitor of the probe for the fattest square wave being displayed on the oscilloscope.2. Repeat if necessary.WARNNING: To avoid electric shock while using the probe, be sure the perfection of the insulated cable, and do not touch the metallic portions of the probe head while it is connected with a voltage source.1.6 Function CheckPerform this functional check to verify that your oscilloscope is operating correctly.■Connect the oscilloscopeYou should connect the A-Type Plug of USB cable to your PC USB port and connect the other A-Type Plug of USB cable to oscilloscope USB port.■Input a signal to a channel of the oscilloscopeThe oscilloscope is equipped with two channels plus external trigger.Please input signal in the following steps:1. Set the attenuation switch on the probe as 10X and connect the probe on the oscilloscope with CH1. Aim the slot in the probe connector at the faucet on BNC of CH1 and insert, then, turn right to lock the probe. Finally, attach the tip of probe and ground nip to the Connector of Probe compensator.2. Set the CH1 probe attenuation of the oscilloscope to X10. (The default is X1).USER’S MANUAL 173. Attach the tip of probe and ground nip to the Connector of Probe compensator. Click thebutton. A square wave will be displayed within a several seconds. (Approximately 1 kHz, 2V, peak- to- peak).4. Inspect CH2 with the same method. Repeat steps 2 and 3.1.7 Self CalibrationThe self calibration routine lets you optimize the oscilloscope signal path for maximum measurement accuracy. You can run the routine at any time but you should always run the routine if the ambient temperature changes by 5v or more. For accurate calibration, power on the oscilloscope and wait twenty minutes to ensure it is warmed up. To compensate the signal path, disconnect any probes or cables from the input connectors. Then, access the “Utility -> Calibratio n” option and follow the directions on the screen. The self calibration routine takes about several minutes.1.8 AccessoriesAll the accessories listed below are standard accessories for the oscilloscope: HANTEK 6000BC:◆ Probe x 2 (1.5m), 1:1(10:1), Passive Probes◆ A USB cable◆ QuickGuide◆ A software installation CDHANTEK 6000BD:◆ Probe x 2 (1.5m), 1:1(10:1), Passive Probes◆ A USB cable◆ QuickGuide◆ A software installation CD◆ A BNCTOBNCHANTEK 6000BE:◆ Probe x 2 (1.5m), 1:1(10:1), Passive Probes◆ A USB cable◆ QuickGuide◆ A software installation CD◆ A HT25Chapter 2 Operating Basics ◆The User’s Interface◆The Menu System◆The Vertical System◆The Horizontal System◆The Trigger System◆Input Connectors2.1 The User’s InterfaceClick the software icon on the desk after you finished the software setting and equipment connecting. Then a user interface will be showed as follows:In addition to displaying waveforms, the display area is filled with many details about the waveform and the oscilloscope control settings.1. The Main Menu:All settings can be found in the main menu.2. The Toolbar3. Displays the trigger information:Displays the edge trigger slope, source and level.4. The DDS Panel (HANTEK 6000BD)5. The Horizontal Panel:The user can change Time/Div, format in the panel.6. The Vertical Panel: The user can turn on/off the CH1/CH2/CH3/CH4. Also the usercan change the CH1/ CH2/CH3/CH4 volt/div, coupling and probe attenuation.7. The Trigger Panel: In this panel, the user can change the trigger mode, sweep, sourceand slope.8. Displays the system time.9. Marker shows Edge trigger level11. Displays the CH1/CH2/CH3/CH4 information:Readouts show the coupling of the channels.Readouts show the vertical scale factors of the channels.A “B” icon indicates that the channel is bandwidth limited12. Connect13. The markers show the CH1/CH2/CH3/CH4 reference points of the displayedwaveforms. If there is no marker,the channel is not displayed.14. Marker shows horizontal trigger position15. Trigger status indicates the following:AUTO: The oscilloscope is in auto mode and is acquiring waveforms in the absence of triggers.Trig’D: The oscilloscope has seen a trigger and is acquiring the post trigger data. STOP: The oscilloscope has stopped acquiring waveform data.RUN: The oscilloscope is running.2.2 The Menu SystemThe Main Menu:1.File: Load or Save data, setup2.View: Change the user interface3.Setup:Setup setting4.Display:Change wave display type5.Cursor: Set Cursor measure type6. Measure: Set measurement parameters7.Acquire: Run ,Stop or other operation setting8. Utility: Utility setting9.Vehicle:10. Window: Window setting11.Help: Turn on help file1.3 The Vertical SystemClick “Setup->Vertical”The following figure shows the vertical Setup window. It shows the vertical parameters setting.1.Select channel: User can select the channel by clicking the Combo box.2.Select channel: User can select the channel by clicking the Combo box.3.VOLTS/DIV: Set the selected channel voltage range.4.Coupling: Set the selected channel to DC/AC.5.Probe: Set the Select one according to the probe attenuation factor to ensure correct vertical scale reading6.BW Limit: Reject the frequency component higher than 20MHz.7.Invert: Invert the selected wave.2.4 The Horizontal SystemClick “Setup->Horizonta l”The following figure shows the Horizontal System window. It shows the horizontal parameters settings.1. Time/DIV:leads the setting of the time base parameters2. Format: leads the setting of the horizontal format parameters2.5 The Trigger SystemClick “Setup-> Trigger”The following figure shows the trigger system control.Trigger:1.Trigger Mode: Sets the trigger mode2.Trigger Sweep: Selects the trigger sweep mode to AUTO, NORMAL or SINGLE3.Trigger Source: Selects the trigger source to CH1, CH2, CH3, CH44.Trigger Slope: Selects the edge trigger slope to Positive or Negative slope 2.6 Input ConnectorCH1/CH2/CH3/CH4: Input connectors for waveform display.Other Connector:GND.: A ground terminalUSB PORT: Connect the USB cable to this port. CAL.: Probe compensation output.Chapter 3 Oscilloscope Functions ◆Set Oscilloscope◆Set Vertical System◆Set Horizontal System◆Set Trigger System◆Save/Load◆Utility Function◆Measure Signal◆Zoom In/Out Waveforms◆Acquire Signal◆Print3.1 Setup the OscilloscopeUsing “AU T OSET” to display a signal automatically.Auto setup functions one time each time you push the “AUTOSET” button. The function obtains a stable waveform display for you. It automatically adjusts the vertical scale, horizontal scale and trigger settings. Auto setup also displays several automatic measurements in the graticule area, depending on the signal type.Connect a signal to the CH1 input:1. Connect a signal to the oscilloscope as described above.2. Click the “Acquire -> Autoset” button.The oscilloscope will change the current settings to display this signal.Save SetupThe oscilloscope software saves the current setup before you close the oscilloscope software. The oscilloscope recalls this setup the next time you run the software. You can use the “Save Setup” menu to permanently save up to several different setups.Load SetupThe oscilloscope can recall the last setup before the oscilloscope software was running, any saved setups, or the factory setup. You can use the “Load Setup” menu to permanently recall a setup.Factory SetupThe oscilloscope software is set up for normal operation when it is shipped from the factory. This is the factory setup. To recall this setup, push the “Factory Setup” menu.3.2 Set Vertical SystemSet ChannelClick “Vertical” in “Setup” menu.The Channel SelectionThe Channel Control Panel in sidebarThe Vertical function:Turn ON/Off: Turn on/off the channelVolt/DIV: Select the channel voltage/divCoupling: Select the channel couplingProbe: Select the channel probe attenuationInvert: Turn on/off the invert function.Change Volt/DIVYou can click “volt/Div” in” vertical Setup” window to select the voltageYou can also change the selected channel voltage in sidebarSet Channel CouplingClick “Coupling” in “Vertical Setup” windowIn the sidebar, you can change the channel coupling too.You can set the coupling to DC, AC or GND. If you set the coupling to DC, it blocks the AC component of the input signal.Probe Attenuation SettingSelect the attenuation factor for the probe. To check the probe attenuation setting, toggle the probe menu to match the attenuation factor of the probe.This setting remains in effect before you changed again.Click “Probe” in Vertical Setup window to select the probe attenuationThe probe setting window in the sidebarNote: The attenuation factor changes the vertical scale of the oscilloscope so that the measurement results refect the actual voltage levels at the probe tip.Set MathClick “MATH”in Channel menu to set MATH channel.The MATH Setup window:ON/OFF: Turn On/Off the MATH Channel.Source A/B: Set the sources of the math channel.Operate: Set operates type of the math channel.Volt/DIV: Set the resolution of the math channel.Probe: Set the math channel probe attenuation.Invert: Turn on/off the invert functionThe mathematic functions include addition, subtract, multiply and FFT for CH2. Source A/BSource A and Source B MenuOperateFour Types:A +B Add source A and source BA -B Subtract source B from source AA xB Multiply source A by source BA /B Divide source A by source BFFT Convert a time-domain signal into its frequency components (spectrum).In this function, use the addition, subtraction, multiplication and FFT function to operate and analyze the waveform.Select the operate type in the Operate menu. Select source A and B. Then adjust the vertical scale and offset to view the math channel clearly. The mathematic result can be measured by the measure and the cursor.The Math Function DisplayInvertThe invert function turns the displayed waveform 180 degrees, with respect to the ground level. When the oscilloscope is triggered on the inverted signal, the trigger is also inverted. Click “Invert” in MATH.The following picture shows the waveform before inversion:The following picture shows the waveform of inversion:Set ReferenceClick “REF” in “Setup” menu to set REF channel.The Reference Channel Function:On/Off: Turn on/off the reference channel.Volt/DIV: Channel the resolution of the reference channel.Load: Load the reference waveform from the “.rfc” f ile from your computer.Save: Save the current referenc e waveform to your computer as “.rfc” format.Save Reference: Save the current referenc e waveform to your computer as “rfc” format. You can change the vertical scale of a waveform. The waveform display will contract or expand relative to the reference level.LoadClick “Load” to load the “*.rfc” file that was selected. The load file window will appear. SaveClick “Save” to save the waveform to *.rfc file. The saved source window appears.The save file window will appear after you selected the saved source.The Reference Waveform Display Window:Note:If you turn on the “Reference” channel, the load f ile window will appear. 3.3 Setup Horizontal SystemChange Time/DivThe “Time/Div”S elects the horizontal Time/DIV (scale factor) for the main or the window time base The Horizontal PanelClick the blue knob can change Time/Div.If the waveform acquisition is stopped, Time/Div control expands or compresses the waveform.Change FormatClick “Time/Div” you can set the Time base in Horizontal Setup window.In the “Format” item, set the waveform display format (Y-T, X-Y).Y -T: Show the relative relation between vertical voltage and horizontal timeX -Y: Show CH1 value at X axis; CH2 value at Y axisChange Horizontal PositionDouble click the channel button to set the trigger point to the horizontal center of the screen.Horizontal position changes the displayed waveform position, relative to the trigger point. The user can drag on screen to change the horizontal position.3.4 Set Trigger SystemClick “Setup->Trigger”, you can configure the trigger.The user can also click in the toolbar to set Trigger.1. Set TriggerEdge TriggerT he trigger determines when the oscilloscope starts to acquire data and display a wave- form. When a trigger is set up properly, it can convert unstable displays or blank screens into meaningful waveforms. If the oscilloscope wants to acquire a waveform, it collects enough data so that it can draw the waveform to the left of the trigger point. The oscilloscope continues to acquire data while waiting for the trigger condition to occur. The oscilloscope continues to acquire enough data so that it can draw the waveform to the right of the trigger point after it detects a trigger.The Edge trigger determines whether the oscilloscope finds the trigger point on the risingMode: Select the trigger mode.Sweep: Set the sweep mode to Auto, Normal or Single.Auto: Acquire waveform even no trigger occurredNormal: Acquire waveform when trigger occurred.Single: Acquire waveform when trigger occurred then stopSource: You can use the trigger source options to select the signal that the oscilloscope uses as a trigger. The source can be any signal connected to a channel BNC.CH1: Select CH1 as trigger signalCH2: Select CH2 as trigger signalCH3: Select CH2 as trigger signalCH4: Select CH2 as trigger signalSlope: Set the slope to Rising (+) or Falling (-).Rising: Trigger on rising edgeFalling: Trigger on falling edgeThe user can also change the trigger setting on trigger panel in sidebar.Set Pulse TriggerPulse trigger occurs according to the width of pulse. The abnormal signals can be detected through setting up the pulse width condition.Mode:Sweep:Source:Pulse Width: The Pulse Width adjust range is 10ns~10s. When the condition is met, it will trigger and acquire the waveform.The user can also change the trigger setting on trigger panel in sidebar.When alternative trigger is on, the trigger sources come from two vertical channels. This mode can be used to observe two non-related signals. You can choose two different trigger modes for the four vertical channels.Mode: Select the trigger mode.Hantek 6000BC/Hantek 6000BDDigital OscilloscopeSweep:Source: Set the Trigger Channel to CH1,CH2,CH3,CH4.Trigger Sync:Trigger Standard:Set ALT SystemMode : Select the trigger mode.Trigger Channel : Set the Trigger Channel to CH1,CH2,CH3,CH4.Trigger Type : Set the Trigger Type to Edge or Pulse .PW Condition : Set the PW Condition to the following condition.+More : +Pulse width more than selecting pulse condition. +Less : +Pulse width less than selecting pulse condition.+Equal: +Pulse width equal to selecting pulse condition.-More: -Pulse width more than selecting pulse condition.-Less: -Pulse width less than selecting pulse condition.-Equal: -Pulse width equal to selecting pulse condition.Pulse Width: The Pulse Width adjust range is 10ns~10s. When the condition is met, it will trigger and acquire the waveform.The user can also change the trigger setting on trigger panel in sidebar.High Frequency RejectionSelect “HF Rejection” in “Trigger Setup” windowThe user can turn on “HF Rejection” to eliminate trigger higher-frequency (20M above)3.5 Save/LoadSaveClick “File” in main menu to save waveform, setups and screen.1.Save DataSave waveform data as a type file2. Save SetupSave the current oscilloscope setup to file3.Save ImageSave the software display window as a .bmp or .jpg fileLoadClick “File” in main menu to recall saved waveform, setup1. Load DataLoad the waveform that had saved as a type file2. Load SetupLoad the instrument that had saved3.6 Utility Function3.6.1 RecordThe following picture shows the Record Interface.The dialog box of record is shown on the lower right corner of the screen.This function can record input waveform form CH1, CH2, CH3, CH4.Storage: Record waveform and save it as “.dfr” file.“Play Back” button: Click this button to start playing back waveform.“Start” button: Start to record waveforms. After you start to record waveforms, this window will disappear. Please click “Utility->Record” to open the window again. Click “Stop” to stop recording waveforms.File Information:Writing: Recording data.Reading: Playing back data.data.0.drf: the name of the recorded file. The Max. length of this file is about 1GB. When recording data length is more than 1GB, it will create next file named data.1.drf, and so on. When click play back button, it will play back data from the first file (data.0.drf) to the last file. If you want to read an arbitrary file, please delete the data.drf, and then play back. 3.6.2 Pass/FailClick “Pass/Fail” in “Utility” menu.The Pass/Fail window appears:The Pass/Fail function monitors changes of signals and outputs pass or fail signals by comparing the input signal with the pre-created mask.Control SettingSource: Select the Pass/Fail channelOutput: Select the Pass/Fail output condition.Stop When Output: If it was checked, the Pass/Fail will stop when output.Mask SettingV ertical: Set the vertical limit rangeHorizontal: Set the horizontal limit range“Create” button: Click this button to create Pass/Fail area according to the mask“Save” button: Click this button to save the setups to file“Load” button: Click this button to load the saved setups fileInformation DisplayFail: It shows the fail waveform numberPass: It shows the pass waveform numberTotal: It shows the l total Pass/Fail waveform number OperationClick “Start” button to start the Pass/Fail test.Click “Stop” button to stop the Pass/Fail test.The Pass/Fail function displayNOTE: Pass/Fall function is unavailable in X-Y mode.3.6.3 Factory SetupClick “Factory Setup” in “Utility” menu to load default setupsWhen you click the Factory Setup in Utility menu, the oscilloscope displays the CH1 and CH2 waveforms and removes all other waveforms.The oscilloscope set up for normal operation when it is shipped from the factory and can be recalled at anytime by user.The Factory Setup function does not reset the following settings:■ Language option■ Date and time3.6.4 LanguageClick “Language” in “Utility” menuThere are four languages in “Language” menu. The default language is English.3.7 Measure Signal3.7.1 Cursor MenuClick “Cursor” in main menu.This method allows you to take measurements by moving the cursors1.SourceThe user can set the source to CH1, CH2, CH3, CH4 and MATH.When you use cursors, be sure to set the Source to the waveform on the display that you want to measure.2.TypeThere are four types of cursors: Cross, Trace, Vertical and Horizontal1) CrossThe Cross cursors appear as cross lines on the display and measure the vertical and horizontal parameters.The Cross cursor display window:The Cross measure result displays on status bar2) TraceThe Trace cursors appear as vertical lines on the display and measure the waveform amplitude at the point the waveform crosses the cursor.The Trace cursor display windowThe Trace cursor measure result display on status bar3) Vertical。
仿真示波器使用说明
仿真示波器使用说明:目录1.软件使用指南2.示波器面板介绍3.示波器使用前调节4.机内信号观察5.输入信号观察6.结束语一、软件使用指南1、开关使用将鼠标移到周围时,周围会出现绿色的感应圈,此时用左键单击便可改变开关状态,其左边的指示灯指示此刻开关状态,黑色为关闭,红色为开启。
2、旋钮使用将鼠标移到周围时,周围会出现绿色的感应圈,此时按下鼠标左键并保持,然后沿着感应圈移动鼠标就可以转动旋钮。
此旋钮可以连续转动。
3、旋钮使用将鼠标移到周围时,周围会出现绿色的感应圈,此时按下鼠标左键并保持,然后沿着感应圈移动鼠标就可以转动旋钮。
此旋钮只能转动到特定位置。
二、示波器面板介绍1、辉度调节旋钮——用来调节图像亮度。
2、聚焦调节旋钮和辅助聚焦调节旋钮——两者配合使用,使图像更加清晰。
3、竖直位移旋钮和水平位移旋钮——用来调节图像在竖直方向和水平方向上的位置。
4、Y增益旋钮和X增益旋钮——用来调节图像在Y方向和X方向上的幅度。
5、扫描微调旋钮——使扫描电压的频率在选定范围内连续变化。
6、衰减调节旋钮——有1、10、100、1000四个档,“1”档不衰减,其余各档分别可使加在竖直偏转电极上的信号电压按照上述倍数衰减,使图像在竖直方向上的幅度依次减为前一档的十分之一。
最右边的正弦符号档不衰减,而是由机内自行提供竖直方向的按正弦规律变化的信号。
7、扫描范围旋钮——用来改变扫描电压的频率范围,有四个档,左边第一档是10Hz-100Hz,向右每升高一档,扫描频率增加10倍。
最左边是“外X”档,使用这一档时机内没有加扫描电压,水平方向的电压可以从外部输入。
8、“Y输入”,“X输入”,“地”——分别是对应方向的信号输入电压接线柱和公共接地的接线柱9、“交直流选择开关”——置于“DC”位置时,所加信号输入电压是直接输入的;置于“AC”位置时,所加信号电压是通过一个电容器后输入的,可以让交流信号通过而隔断直流成分。
三、示波器使用前调节1、打开示波器开关。
小巧不可小瞧Pico便携虚拟示波器操作演示
小巧不可小瞧Pico便携虚拟示波器操作演示•产品概述与特点•硬件组成与连接•软件安装与操作指南目录•示波器功能演示•实际应用案例展示•总结回顾与未来展望01产品概述与特点该示波器采用先进的虚拟仪器技术,通过计算机接口与上位机软件实现信号采集、处理和分析等功能。
Pico便携虚拟示波器具有体积小、重量轻、易于携带等特点,适用于现场测量、实验室研究、教育教学等多种场景。
Pico便携虚拟示波器是一款高精度、高便携性的测量设备,旨在为用户提供快速、准确的电子信号分析。
Pico便携虚拟示波器简介主要功能及性能参数主要功能实时波形显示、信号参数测量、数据存储与回放、自动测量与统计等。
性能参数高带宽、高分辨率、低噪声、高精度等,确保信号的准确捕获与分析。
独特设计与优势分析独特设计采用模块化设计,支持多种扩展模块,可根据用户需求进行功能定制和扩展。
优势分析高集成度、低功耗、强抗干扰能力,确保在各种环境下都能获得稳定的测量结果。
适用范围及市场需求适用范围电子工程、通信工程、自动化控制、航空航天等领域中的信号测量与分析。
市场需求随着电子技术的不断发展,对高精度、高便携性示波器的需求不断增加。
Pico 便携虚拟示波器凭借其卓越的性能和便捷的操作,满足了市场日益增长的需求,成为电子工程师和科研人员的理想选择。
02硬件组成与连接Pico示波器主机探头电源适配器USB数据线主要硬件部件介绍小巧轻便,高性能的示波器主机,用于接收和处理信号。
为Pico示波器提供稳定的电源供应。
用于连接被测电路和示波器,将电路中的信号传输到示波器中进行显示和分析。
用于连接Pico示波器与电脑或其他设备,实现数据传输和远程控制。
将探头插头插入Pico 示波器主机上的对应接口,确保连接稳固。
探头连接电源连接USB 连接将电源适配器插头插入Pico 示波器主机的电源接口,另一端接入电源插座。
使用USB 数据线将Pico 示波器与电脑连接,确保数据传输畅通。
- 1、下载文档前请自行甄别文档内容的完整性,平台不提供额外的编辑、内容补充、找答案等附加服务。
- 2、"仅部分预览"的文档,不可在线预览部分如存在完整性等问题,可反馈申请退款(可完整预览的文档不适用该条件!)。
- 3、如文档侵犯您的权益,请联系客服反馈,我们会尽快为您处理(人工客服工作时间:9:00-18:30)。
虚拟示波器使用手册一、软件安装说明软件安装包括USB数据采集卡驱动程序安装和虚拟示波器软件安装。
1、安装USB数据采集卡驱动程序本虚拟示波器使用前必须先正确安装USB数据采集卡驱动程序。
其安装步骤如下:(1)将USB通信电缆的方形接口插入数据采集卡,USB通信电缆的另一端插入计算机的USB 通信口。
计算机查询到新的硬件,启动硬件向导,如图1-1所示,选择“从列表或指定位置安装(高级)”,点击“下一步”:图1-1硬件向导(2)进入如图1-2界面,选择“在搜索中包括这个位置”,点击“浏览”,选择USB数据采集卡驱动程序文件,点击“下一步”,开始安装驱动程序:图1-2选择安装文件(3)安装完成后,出现如图1-3界面,表明驱动程序安装成功。
图1-3安装完成如果在使用虚拟示波器过程中,出现数据采集不正确现象,应卸载已经安装的USB数据采集卡驱动程序,将USB通信电缆插入计算机的其他USB通信口,重新安装USB数据采集卡驱动程序。
2、安装虚拟示波器软件(1)点击文件夹“虚拟示波器软件安装包”,选择“setup.exe”安装程序,进入如图1-4界面:图1-4软件安装向导(2)第一步完成后,进入如图1-5界面:图1-5选择目标路径(3)选择好安装位置后,点击“下一步”,进入如图1-6界面:图1-6许可协议(4)选择“我接受该许可协议”,点击“下一步”,进入如图1-7界面:图1-7准备安装(5)点击“下一步”,进入如图1-8界面:图1-8开始安装(6)程序开始安装,安装完成后进入如图1-9界面,表明程序安装成功。
图1-9安装完成安装过程中尽量采用默认安装。
安装完成之后,系统如果提示需要重新启动电脑,请保存好各类文档,然后重新启动。
二、软件操作说明1、软件介绍虚拟示波器软件是专门为传感器系列实验台教学实验开发的辅助软件。
它配有USB数据采集卡,完成采集和测试功能。
本软件具有操作简单,界面友好,简单易用等优点。
2、软件主要功能说明虚拟示波器软件主要功能包括:双通道信号输入(连续采集和单点采集)、通道控制、触发控制、时基控制、幅值控制、参数自动测量、光标测量、波形显示、波形平移、数据处理、波形记录与回放、DIDO测试、电机控制等。
3、软件界面说明(1)将USB通信电缆的方形接口插入数据采集卡,USB通信电缆的另一端插入计算机的USB 通信口。
(2)打开仪器电源。
(3)从桌面快捷方式或任务栏“开始”菜单里启动虚拟示波器软件,进入如下图2-1所示的主界面:图2-1主界面如果USB采集卡驱动没有装好或者USB线没有连接,启动时都会弹出警告对话框,如图2-2所示界面。
此时应关闭软件,连接好USB电缆后,再重新启动软件。
图2-2错误警告在该软件界面中,最上面是帮助和关闭菜单,菜单栏的下边是一个选项卡,包括虚拟示波器和波形数据回放。
虚拟示波器界面介绍虚拟示波器界面中,左边栏是示波器显示窗口,右面是参数设置和操作区,下面是参数显示窗口。
用户可以通过菜单,操作区按钮,完成对虚拟示波器的控制。
①菜单帮助:打开虚拟示波器软件使用手册。
关闭:关闭软件。
②AD参数设置其控件含义说明如下:首通道(0-7):采集时,首通道的通道号,总共有8个通道号可选;末通道(0-7):采集时,末通道的通道号,总共有8个通道号可选;采集模式:包括连续采集和单点采集;通道选择:包括单通道和双通道。
当选择单通道时,软件自动默认首通道和末通道为同一个通道;当选择双通道时,软件自动默认首通道号在末通道号之前。
注意:采集时为了达到最佳显示效果,在选择双通道采集时,首通道和末通道应选择相邻的两个通道;③波形显示参数设置其控件说明如下:首通道电压/每格:首通道电压幅值档位选择(分别有0.05V、0.25V、0.5V、1V、1.5V、2.5V、5V);末通道电压/每格:末通道电压幅值档位选择(分别有0.05V、0.25V、0.5V、1V、1.5V、2.5V、5V);时间/每格:时基刻度选择(分别有10us、50us、100us、0.2ms、0.5ms、2ms、5ms、10ms、15ms、25ms、50ms、100ms、200ms、500ms、1s);Y1基准:首通道电压平移;Y2基准:末通道电压平移;基准复位按钮:点击该按钮,首通道和末通道电压复位到原位置;④按钮操作区其控件说明如下:开始采集按钮:采集开关。
当选择连续采集时,点击“开始采集”按钮,开始连续采集数据并显示在示波器窗口,直到点击“停止采集”按钮;当选择单点采集时,点击一次该按钮,采集一个数据点并显示在示波器窗口上;记录数据按钮:将示波器显示窗口的数据信号保存成lvm格式的文件,以便将来用于回放和分析数据;显示/隐藏游标按钮:显示或隐藏游标按钮,当点击“显示游标”时,在示波器显示窗口显示两条游标跟踪线,用户用鼠标拖动游标跟踪线,示波器显示窗口的下方会实时显示跟踪线和波形交叉点的坐标位置。
其中,黄色跟踪线与X1、Y1对应,红色跟踪线与X2、Y2对应,当X1、X2刚好对应一个波形时,△X为波形的周期,1/△X为波形的频率。
DIDO按钮:点击该按钮,弹出如图2-3所示界面。
其中,第一栏为DO输出状态,用户用鼠标点击布尔开关改变输出状态;第二栏为DI结果显示;点击退出按钮,退出该界面;图2-3DIDO测试电机控制按钮:用于THSRJ-2型的步进电机和限位开关实验。
点击该按钮,弹出如图2-4所示界面。
其中,第一栏为设置单位步长的输入框,设置的最小值为5ms,步长时间越短,电机转动速度越快,步长时间越长,电机转动速度越慢;第二栏为选择控制方式,包括步进电机和限位开关;点击启动按钮,启动电机,电机开始运动直到再次点击该按钮;点击退出按钮,退出该界面;触发按钮:波形触发开关,软件触发模式,触发源为CH1,触发类型包括上升沿触发和下降沿触发,用户可以用鼠标拖动触发电平滑动杆修改触发电平;图2-4电机控制数据处理按钮:点击该按钮,弹出如图2-5所示界面;在拟合数据表格里填入需要拟合的数据或者点击打开按钮,选择已经保存好的表格数据文件,导入到表格中,根据需要选择不同的拟合方式,点击曲线拟合按钮,得到拟合前曲线和拟合后曲线图。
其中拟合方式有线性拟合、多项式拟合、指数拟合、对数拟合。
点击保存图像按钮,将波形图当前图像保存成BMP格式文件。
点击返回按钮,退出该界面,返回主界面。
图2-5数据处理⑤测量参数显示区其控件说明如下:CH1:显示首通道的频率、周期、峰峰值、有效值;CH2:显示末通道的频率、周期、峰峰值、有效值。
⑥示波器显示窗口其控件说明如下:示波器显示窗口显示采集所得的波形曲线,如图2-6所示。
窗口最上方显示电压/每格、时间/每格的参数,当游标开关处于开启状态时,窗口最下方显示的是跟踪线和波形交叉点的坐标位置参数,窗口右上方显示的是CH1和CH2的曲线图例,鼠标点击曲线图例,打开曲线图例菜单,用户在该菜单可以设置曲线的颜色、线条样式、线条宽度、点样式等参数。
右键点击示波器显示窗口,弹出快捷菜单。
当选择连续采集时,弹出的菜单包括:清除图形、导出图像、打印。
当选择单点采集时,弹出的菜单包括:清除图形、保存数据点、导出图像、打印。
各项菜单说明如下:清除图形:示波器显示窗口清屏;导出图像:将当前示波器显示窗口的波形曲线保存成BMP格式的文件;保存数据点:将当前示波器显示窗口的数据点保存到文本文件或Excel表格中,以便将来用于数据处理和分析;打印:打印当前示波器显示窗口的波形曲线;图2-6示波器显示窗口波形数据回放界面介绍选择波形数据回放选项卡,进入波形数据回放界面,如图2-7所示。
波形数据回放界面上方是波形回放路径和记录时间,中间是波形回放示波器显示窗口,下面是参数显示和操作区。
用户可以通过操作区按钮,完成对波形数据的回放和分析。
图2-8是波形回放的结果显示界面。
图2-7图2-8回放数据按钮:点击该按钮,弹出选择回放文件的对话框,选择以前保存的lvm文件,回放该文件;显示游标按钮:显示/隐藏游标开关;基准复位:CH1和CH2电压复位到原位置;CH1基准:CH1电压平移;CH2基准:CH2电压平移;CH1测量:显示CH1的电压最大值、最小值、峰峰值和信号频率;CH2测量:显示CH2的电压最大值、最小值、峰峰值和信号频率;回放路径输出:显示回放文件的路径;记录时间:显示该文件的记录时间;波形回放示波器显示窗口:显示波形回放的曲线,当游标处于开启状态时,用户用鼠标拖动游标,窗口最下方实时显示游标测量参数,用户可以手动修改Y轴的显示范围。
是示波器显示窗口的工具,分别是游标选取工具、缩放工具、手型工具。
在使用某个工具前,必须先用鼠标激活该工具。
例如,在用鼠标拖动游标之前,必须先用鼠标激活游标选取工具;利用手型工具,在示波器显示窗口拖动曲线,以便观察;缩放工具:按照从左到右,上到下的顺序,分别是:矩形缩放:按住鼠标左键在显示区域内拉出方框,框内的图线将被放大;水平缩放:波形只在水平方向上被放大,垂直方向上保持不变;垂直缩放:波形只在垂直方向上被放大,水平方向上保持不变;自动缩放:自动调整图形使其充满显示区;连续放大:连续放大鼠标点击的区域;连续缩小:连续缩小鼠标点击的区域。