China's target-setting scenario requires flex
C-NCAP(中国新车评价规程)路线图介绍
03 遵循中国道路交通事故实际状态
Follow the actual state of road traffic accidents in China
3
C-NCAP 路线图回顾Roadmap Review
Protocol version Assessment items
X
Dummy layout adjustment:female dummy and Q3 child dummy are randomly placed on 2nd row
impact form adjustment:MPDB(frontal impact with 50% overlap against moving progressive deformable barrier )
Development of Intelligent and Networked Technology
• Driving assistance and automatic driving
• Security function based on C-V2X
Expand the range of vehicle models
C-NCAP 路线图-行人保护 Roadmap,Pedestrian Protection
头型
HEAD FORM
主动弹起式发动机罩测评方法更新assessment method update of active pop-up engine hood
风窗玻璃区域头型试验评价方法更新windshield area assessment method update
Learn from the development achievements of other NCAP and integrate with the other NCAP
China daily(中文日报双语版)

《China daily》实用词汇及短语总结4.10 Deleterious 有害的, bricks-and-mortar stores 实体店,IED, immune, She got tied up at work.Hunt and peck 二指弹touch typing 盲打fiendishly凶猛的,刁钻的。
Get a better education ,savor 品尝,broth 肉汤,paleolithic 原始的company 陪伴myriad,无数的interact strongly 有极大关系self-reported happiness 自我满意度savannah 无树大草原struggle aspiring to greater goals 追求更大目标hold sway:统治,支配‘iPhone6 Legs’i6thighs 大腿in the last couple of decades 过去二十年diabetes 糖尿病deputy chief副主任sharp rise 大量增长incurable 无法治愈Insulin胰岛素revise her manuscript修改手稿drip drip形容坏事缓慢发生的过程chop-chop 快;赶快pooh-pooh 蔑视stealth call 逃避电话insiders 知情人feign假Ukrainian乌克兰的satirical有讽刺意味的patriotisim爱国主义temperament脾性breastfeed哺乳cuddle:搂抱,拥抱import value-added 进口环节增值税tariff关税maxim美信commission委托sail帆erratically摇摆不定aloft在…之上have a stiff upper lip 咬紧牙关Point blanc 白点Carry your heart on your sleeve 轻易表露感情kangaroo court潦草,不公正的法庭SDHC(secure digital high capacity) 4.11 dementia痴呆症,the behavior of a gentleman绅士手etiquette 绅士,礼仪chivalry 绅士风度take/feel one’s pulse把脉geek达人separate the wheat from the chaff 把糠从小麦里筛出来fly by the seats of your pants没有计划,只凭感觉做事。
全球2℃温升目标与应对气候变化长期目标的演进——从联合国气候变化框架公约到巴黎协定
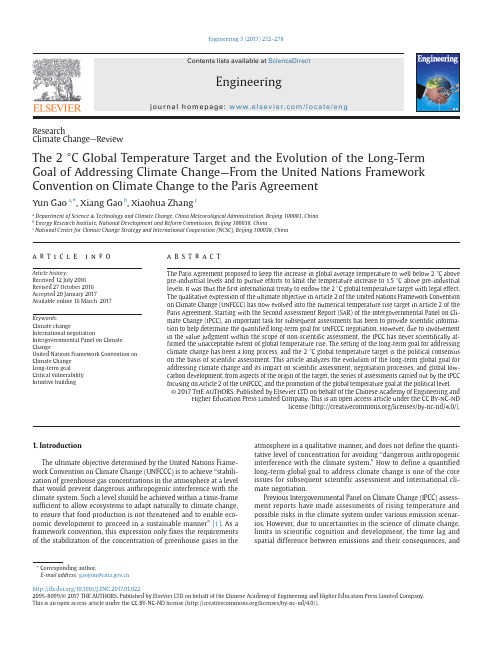
Engineering 3 (2017) 272–278ResearchClimate Change—ReviewThe 2 °C Global Temperature Target and the Evolution of the Long-Term Goal of Addressing Climate Change—From the United Nations Framework Convention on Climate Change to the Paris AgreementYun Gao a ,*, Xiang Gao b , Xiaohua Zhang caDepartment of Science & Technology and Climate Change, China Meteorological Administration, Beijing 100081, China bEnergy Research Institute, National Development and Reform Commission, Beijing 100038, China cNational Center for Climate Change Strategy and International Cooperation (NCSC), Beijing 100038, Chinaa r t i c l e i n f oa b s t r a c tArticle history:Received 12 July 2016Revised 27 October 2016Accepted 20 January 2017Available online 16 March 2017The Paris Agreement proposed to keep the increase in global average temperature to well below 2 °C above pre-industrial levels and to pursue efforts to limit the temperature increase to 1.5 °C above pre-industrial levels. It was thus the first international treaty to endow the 2 °C global temperature target with legal effect. The qualitative expression of the ultimate objective in Article 2 of the United Nations Framework Convention on Climate Change (UNFCCC) has now evolved into the numerical temperature rise target in Article 2 of the Paris Agreement. Starting with the Second Assessment Report (SAR) of the Intergovernmental Panel on Cli-mate Change (IPCC), an important task for subsequent assessments has been to provide scientific informa-tion to help determine the quantified long-term goal for UNFCCC negotiation. However, due to involvement in the value judgment within the scope of non-scientific assessment, the IPCC has never scientifically af-firmed the unacceptable extent of global temperature rise. The setting of the long-term goal for addressing climate change has been a long process, and the 2 °C global temperature target is the political consensus on the basis of scientific assessment. This article analyzes the evolution of the long-term global goal for addressing climate change and its impact on scientific assessment, negotiation processes, and global low- carbon development, from aspects of the origin of the target, the series of assessments carried out by the IPCC focusing on Article 2 of the UNFCCC, and the promotion of the global temperature goal at the political level.© 2017 THE AUTHORS. Published by Elsevier LTD on behalf of the Chinese Academy of Engineering andHigher Education Press Limited Company. This is an open access article under the CC BY-NC-NDlicense (/licenses/by-nc-nd/4.0/).Keywords:Climate changeInternational negotiationIntergovernmental Panel on Climate ChangeUnited Nations Framework Convention on Climate Change Long-term goalCritical vulnerability Intuitive building1. IntroductionThe ultimate objective determined by the United Nations Frame-work Convention on Climate Change (UNFCCC) is to achieve “stabili-zation of greenhouse gas concentrations in the atmosphere at a level that would prevent dangerous anthropogenic interference with the climate system. Such a level should be achieved within a time-frame sufficient to allow ecosystems to adapt naturally to climate change, to ensure that food production is not threatened and to enable eco-nomic development to proceed in a sustainable manner” [1]. As a framework convention, this expression only fixes the requirements of the stabilization of the concentration of greenhouse gases in the atmosphere in a qualitative manner, and does not define the quanti-tative level of concentration for avoiding “dangerous anthropogenic interference with the climate system.” How to define a quantified long-term global goal to address climate change is one of the core issues for subsequent scientific assessment and international cli-mate negotiation.Previous Intergovernmental Panel on Climate Change (IPCC) assess-ment reports have made assessments of rising temperature and possible risks in the climate system under various emission scenar-ios. However, due to uncertainties in the science of climate change, limits in scientific cognition and development, the time lag and spatial difference between emissions and their consequences, and* Corresponding author.E-mail address: gaoyun@/10.1016/J.ENG.2017.01.0222095-8099/© 2017 THE AUTHORS. Published by Elsevier LTD on behalf of the Chinese Academy of Engineering and Higher Education Press Limited Company.This is an open access article under the CC BY-NC-ND license (/licenses/by-nc-nd/4.0/).Contents lists available at ScienceDirectjo ur n al h om e pag e: w w /locate/engEngineering273 Y. Gao et al. / Engineering 3 (2017) 272–278necessary value judgment other than scientific assessment for de-fining danger levels, the IPCC has never scientifically affirmed the indices that indicate “dangerous anthropogenic interference with the climate system,” and thus cannot define the unacceptable extent of global temperature rise based purely on science.Scientific research into the 2 °C temperature rise started a long time ago; however, the 2 °C global temperature target was not con-sidered as the action goal until the decision of the Council of the European Union (EU) conference in 1996 [2]. After the Copenhagen Climate Change Conference in 2009 and the Cancún Climate Change Conference in 2010, limiting the global temperature rise to below 2 °C above pre-industrial levels became the consensus of the in-ternational community. In 2008–2014, the IPCC’s Fifth Assessment Report (AR5) made a comprehensive assessment of the climate system change, risks, emission budget, and mitigation pathway choice of 2 °C global warming on the basis of the research results available. After scientific assessment and a series of political push-es, one of the three goals reached at the 2015 Paris Climate Change Conference was stated as “Holding the increase in the global average temperature to well below 2 °C above pre-industrial levels and pur-suing efforts to limit the temperature increase to 1.5 °C above pre- industrial levels” [3]. Thus, the long-term goal of addressing climate change has evolved from a qualitative expression of stabilizing the greenhouse gas concentration in the atmosphere, in Article 2 of the UNFCCC, to a global temperature target with specific value, in Article 2of the Paris Agreement.This article analyzes the evolution of the long-term goal for ad-dressing climate change, and the related impact on future scientific assessments, negotiation processes, and global low-carbon develop-ment, from the aspects of the origin of the 2 °C global temperature target, the related IPCC conclusion for Article 2 of the UNFCCC, and the promotion of the global temperature goal at the political level. 2. Early scientific research related to the 2 °C targetStudies regarding the 2 °C temperature rise can be traced back to the 1970s, when an explorative study was carried out in the European natural and social sciences to push decisions related to climate change. According to the overview given by Randalls [4] on the history of the EU’s temperature control goal, the proposal for the global temperature control goal was very strongly related to the scientific study of climate sensitivity. Equilibrium climate sensitivity (ECS) quantifies the response of the climate system to constant radiative forces on multi-century timescales. It is defined as the change in the global mean near-surface air temperature at equilibrium that is caused by a doubling of the atmospheric carbon dioxide (CO2) concentration [5]. If the ECS is 2 °C, then the doubling of the CO2 concentration (generally taken as 550 ppm) will result in a global average temperature rise of 2 °C [6]. In 1967, Manabe and Wetherald [7] used a heat balance model and estimated a tempera-ture response of approximately 2 °C to doubling CO2 concentrations; in subsequent climate change science, and particularly in the esti-mation of the climate system model, the doubling of CO2 has been taken as the core scenario for calculation. Initially, the ECS value was estimated by experts, and in the subsequent IPCC’s First to Third As-sessment Reports, it was taken as 1.5–4.5 °C. In the IPCC’s Fourth As-sessment Report, ECS was determined as 2.0–4.5 °C [8]. However, on the basis of many subsequent studies, the IPCC’s Fifth Assessment Report (AR5) made an elaborate analysis of this issue, considering it to be 1.5–4.5 °C, that is, extremely unlikely to be less than 1 °C and very unlikely to be greater than 6 °C [5]. With respect to mitigation, countermeasures and actions to address climate change involve a series of estimations and policy analyses on social and economic costs. In 1977, Nordhaus [9] made an explorative cost-benefit analy-sis of climate change using the CO2 concentration-doubling scenario; subsequent cost-benefit analyses of addressing climate change be-gan to take the doubling of CO2 or the 2 °C scenario as the starting point of exploration, reaching many research conclusions [10].In the 1980s, before the IPCC’s First Assessment Report (FAR) was released, climate change studies mostly focused on the relationship between increased anthropogenic greenhouse gas emission and greenhouse gas concentration in the atmosphere, and the global average temperature, calling attention to possible threats from an-thropogenic factors. However, there was insufficient basis to deter-mine the indices that should be chosen and the specific figure that would be used as the global ultimate objective in addressing climate change. In addition, since addressing climate change involves com-plex fields, discussion at the political or policy level tends to give a relatively prudent expression of proposed reductions of greenhouse gas emissions, and to wait for further scientific research results [4]. At that time, some scholars proposed a study of the threshold value of climate change from wider perspectives, in order to determine the level at which climate change can be accepted or avoided; that is, they hoped to make a systematic assessment of various risks that may result from climate change, instead of paying attention only to carbon emission [11].3. IPCC’s First and Second Assessment Reports and decision of the European CouncilIn 1990, the IPCC released its FAR. Based on the progress of study in that period, the FAR pointed out that the emissions from human activities resulted in an obvious increase of the concentration of greenhouse gases in the atmosphere, aggravated the greenhouse effect, and caused the global near-surface air temperature to rise, thus inciting the international community to immediately effect political progress and discuss how to take action to deal with global climate change. In this report, the assessment was made under the “business-as-usual” emissions scenario (Scenario A), along with other scenarios with progressively increasing levels of the controls (Scenarios B, C, and D); these scenarios held that in around 2025, 2040, 2050, and 2100, respectively, the equivalent CO2 would be two times that of pre-industrial-revolution levels, and the global average temperature would rise by 0.1–0.3 °C per decade. In order for the concentration to remain stable at the level of that period (1990), it would be necessary to immediately reduce the anthropogenic emis-sion of greenhouse gases (mainly CO2) by 60%, and reduce methane by 15%–20% [12]. The IPCC’s FAR placed emphasis on the rising tem-perature effect due to the anthropogenic emission of greenhouse gases; the scientific basis was insufficient at that time to formulate suggestions for a specific goal. Considering that addressing climate change involves wide and complex fields, the UNFCCC was formed under the encouragement of the FAR, and established the qualitative expression of the ultimate objective.As an important scientific support for the UNFCCC’s negotiation process, the IPCC included an examination of approaches to the realization of Article 2 of the UNFCCC in the Second Assessment Report following a resolution of the Executive Council of the World Meteorological Organization. In addition, the IPCC specifically for-mulated a synthesis report to present information on the scientific and technical issues related to interpreting Article 2 of the UNFCCC [13]. In fact, since the IPCC’s Second Assessment Report (SAR), providing scientific information to assist the quantification of the long-term goal for the UNFCCC’s negotiation has been an impor-tant task in the IPCC’s scientific assessments. According to the SAR published in 1996, the scientific, technical, economic, and social science literature does suggest ways to move toward the ultimate objective of the UNFCCC, but uncertainties remain for the judg-ment of what constitutes dangerous anthropogenic interference with the climate system and what needs to be done to prevent such274Y. Gao et al. / Engineering 3 (2017) 272–278and risk. Since both the magnitude and rate of climate change are very important, the basis for determining what constitutes “dan-gerous anthropogenic interference” would vary in different regions, depending on local characteristics, as would the consequences, ad-aptation, and mitigation capacity of the impact of climate change.Notably, the TAR introduced five “reasons for concern,” thus con-ceptually expressing the reasons for emphasizing the risks of climate change (Fig. 1) [14]. These five reasons include: ① risks to unique and threatened systems; ② risks from extreme climate events; ③ dis-t ribution of impact; ④ aggregate impact; and ⑤ risks from future large-scale discontinuities. In Fig. 1, the global average annual tem-perature represents the magnitude of climate change; however, it is pointed out that future impacts will be a function of the magnitude and rate of global and regional changes in mean climate, climate variability, extreme climate phenomena, socioeconomic conditions, and adaptation, depending on multiple aspects. The TAR also stat-ed that in the setting of the strategy, goal, and timetable to avoid “dangerous anthropogenic interference with the climate system,” it is necessary to consider inertia and uncertainty in the climate, eco-logical, and socioeconomic systems; assess possible risks of climate change from more comprehensive and intuitive perspectives; and relate the risks with global mean near-surface air temperature. As shown in Fig. 1, although the TAR did not define which kind of tem-perature rise should become the index of “dangerous anthropogenic interference with the climate system,” it showed that global warm-ing above 4 °C would pose extremely large risks. These five reasons for concern have been used consistently in subsequent IPCC assess-ments.In 2007, the IPCC released its Fourth Assessment Report (AR4), stating that the five “reasons for concern” identified in the TAR re-main a feasible framework for considering critical vulnerabilities. In the AR4, many risks are affirmed with higher confidence. For example, the report stated that regarding “unique and threatened systems,” observed climate change has had an impact on the polar and high mountain communities and ecosystems; if the global aver-age temperature becomes 1.5–2.5 °C higher than that in 1980–1999, approximately 20%–30% of the plant and animal species assessed so far are likely to face increased risks of extinction; and an increase of about 1–3 °C in the sea surface temperature would result in moreinterference. In the SAR, the conclusions related to the 2 °C temper-ature rise are that for the mid-range IPCC emission scenario (IS92), assuming the “best estimate” value of climate sensitivity and includ-ing the effects of future increases in aerosol concentrations, models project an increase in the global mean near-surface air tempera-ture relative to 1990 of about 2 °C, an increase in sea level of about 50 cm, a greater risk for small islands and low-lying coastal areas, and extensions of the geographical range and season for vector or-ganisms by 2100.The clear proposition that the global average temperature should not exceed 2 °C above the pre-industrial level was first raised in the decision of the European Council’s conference in 1996 [2]. Based on the IPCC’s SAR and the IS92, and after considering the possible risks of climate change, the European Council held that global greenhouse gas emissions should be halved from the 1990 figure, and that CO 2 concentration in the atmosphere should be stabilized at approxi-mately 550 ppm (twice the pre-industrial level), so as to realize the target of limiting the global average temperature rise to 2 °C above pre-industrial levels (the goal for global mitigation cooperation). The EU did not give a reason for this decision, and its definitive ex-pression did not find support in the IPCC’s SAR. The proposition does not currently receive wide international recognition.4. IPCC’s Third and Fourth Assessment Reports and promotion at the G8 SummitIn 2001, the IPCC released its Third Assessment Report (TAR), which provided newer and stronger evidence to prove that most of the warming observed over the last 50 years is attributable to human activities (probability > 66% but < 90%). The impacts of cli-mate change include both advantages and disadvantages, but the larger and quicker the change, the more obvious the leading posi-tion of adverse impacts. In the Synthesis Report of the IPCC’s TAR [14], Question 1 pointed out that the natural, technical, and social sciences can provide essential information and evidence needed for decisions on what constitutes “dangerous anthropogenic interfer-ence with the climate system.” However, such decisions are value judgments determined through sociopolitical processes that consid-er development, equity, and sustainability, as well as uncertainties Fig. 1. IPCC’s TAR: Corresponding figures for assessment and impact risks. SRES : Special Report on Emissions Scenarios ; A1Fl, A1B, A1T, A2, B1, and B2 are alternative development paths and related greenhouse gas emissions scenarios provide in SRES ; IS92a: Scenario a in IPCC emission scenario 1992. Source: Ref. [14], Fig. SPM-2 in Summary for Policymakers , Climate Change 2001: Impacts, Adaptation, and Vulnerability .275 Y. Gao et al. / Engineering 3 (2017) 272–278frequent coral bleaching and widespread mortality. Regarding ex-treme weather, the projected droughts, heat waves, floods, and their adverse impacts would increase. Regarding the distribution of im-pacts, regions with the weakest economies are often the most vul-nerable to climate change, and the low-latitude and less-developed regions face increasing risks. Regarding aggregate impacts, the net cost of impacts with increased warming would increase as time goes on. And finally, regarding the risks of large-scale singularities, global warming lasting for many centuries would result in a rise in the sea level, which would be much larger than that observed in the 20th century; melting of the Greenland and Antarctic ice sheets could oc-cur on century timescales.The IPCC’s reports should be neutral with respect to policy; thus, the IPCC only provides comprehensive, objective, open, and transparent assessment reports, and leaves readers to make their own judgments. It does not define “dangerous anthropogenic in-terference with the climate system.” Compared with the previous three assessment reports, the AR4 provided a clearer and more intuitive explanation and expression of risks, as shown in Fig. 2[15]. The important progress at this stage is that the scientific commu-nity has confirmed the importance of risk assessment and value judgment of climate change for the determination of the long-term goal, thus pushing the discussion of a global temperature goal into the political process.In February 2005, at the request of the European Council, the European Commission reported on a cost-benefit analysis of the medium- and long-term emission reduction strategy and goal [16]. This report assumed that, until 2100, the global average temperature would rise by 1.4–5.8 °C compared with that in 1990, and the Euro-pean temperature would rise by 2.0–6.3 °C. If the temperature rise could be controlled to within 2 °C, the benefits would be sufficient to offset the cost of the mitigation policy; if the temperature rose over 2 °C, it would probably result in quicker and more unpredict-able climate response, and even irreversible and disastrous conse-quences. Based on this report, European Parliament reiterated the 2 °C target in the same year, and held that the TAR’s conclusion had indicated the necessity to strengthen emission reduction and limit global risks [17]. In July 2005, the British Prime Minister Tony Blair asked the Gleneagles G8 Summit to list climate change as one of two priority themes, as the UK served as the rotating president of the G8 Summit. However, the G8 did not reach consensus on a global tem-perature goal.In 2006, Sir Nicholas Stern (the economic consultant for the Brit-ish Prime Minister) published The Economics of Climate Change: The Stern Review, in which he wrote that if no timely actions were tak-en in the following decades, climate change would result in the loss of 5%–20% of global GDP; however, if immediate and powerful global mitigation actions were taken to stabilize the concentration of greenhouse gases in the atmosphere at 500–550 ppm, the cost could be controlled at about 1% of global GDP per year [18]. After the publication of the IPCC’s AR4, climate change became one of the key topics of the G8 Summits in Heiligendamm (Germany) in 2007, in Toyako (Japan) in 2008, and in L’Aquila (Italy) in 2009. The final declaration made by the L’Aquila G8 Summit expressed willingness to limit the global temperature rise to within 2 °C of pre-industrial levels along with other countries, so that the global greenhouse gas emissions would be reduced by 50% before 2050, and so that devel-oped countries should reduce emissions by 80% or more by 2050. Although the scientific significance of taking a 2 °C temperature rise as the goal was unclear [19], a strong push from the EU at theFig. 2. IPCC’s AR4: Impact examples related to rising global average temperature. Source: Adapted from Ref. [15], Fig. 3.6 in Climate Change 2007: Synthesis Report.276Y. Gao et al. / Engineering 3 (2017) 272–278political level extended the discussion of the global temperature goal from the scientific level to the international political and diplo-matic levels.5. From the Copenhagen Climate Change Conference to the Paris Climate Change ConferenceThe 35th G8 Summit in July 2009 and the subsequent Major Economies Forum on Energy and Climate (MEF) were held just be-fore the Copenhagen Climate Change Conference, attracting world-wide attention. The leaders of the 17 participating members of the MEF delivered a joint declaration requiring that the results of the Copenhagen Climate Change Conference comply with the UNFCCC’s goal and scientific requirements, thus unanimously recognizing that the global average temperature rise shall not be over 2 °C higher than pre-industrial levels [20]. It was the first time that a consen-sus had been reached between the main developed and developing countries regarding the 2 °C target. This MEF Summit delivered a strong political signal to the Copenhagen Climate Change Conference at the end of the same year. Thanks to the efforts of major powers, the 2 °C global temperature target was written into the Copenhagen Accord. Since the Copenhagen Accord was not unanimously rec-ognized by all parties, it did not have legal effect. Part I—“A shared vision for long-term cooperative action”—of the Cancún Agreements formulated at the 2010 Cancún Climate Change Conference stated that nations should work together in “… reducing global greenhouse gas emissions so as to hold the increase in global average tempera-ture below 2 °C above pre-industrial levels, and that Parties should take urgent action to meet this long-term goal … strengthening the long-term global goal on the basis of the best available scientific knowledge, including in relation to a global average temperature rise of 1.5 °C” [21]. The 2 °C global temperature target was a global political consensus from then on.Since 2009, the political consensus of the 2 °C global tempera-ture target has had a major impact on the international scientific community. Corresponding climate change trend simulation, impact assessment, and emission reduction path studies have taken it as the object of scenario studies. Since the IPCC assessment is based on peer-reviewed scientific research, the AR5 of the IPCC fully assessed the scientific research related to the 2 °C global temperature target in 2014. A report from the AR5 Working Group I made the first quan-titative assessment on the cumulative emission space under the 2 °C global temperature target. The global average surface warming in the 21st century and subsequent period would mainly depend on the cumulative emission of CO2. In this report, transient climate response to cumulative carbon emissions (TCRE) is defined as the global mean near-surface air temperature change per 1000 GtC (the shorthand for gigatons of carbon) emitted into the atmosphere. It quantifies the transient response of the climate system to cumu-lative carbon emissions. According to the AR5, TCRE is likely to fall within the range of 0.8–2.5 °C per 1000 GtC; this applies for cumu-lative emissions up to about 2000 GtC, until the time temperatures peak. Limiting the warming caused by anthropogenic CO2 emissions alone with a probability of > 33%, > 50%, and > 66% to less than 2 °C since the period between 1861 and 1880 will require cumulative CO2 emissions from all anthropogenic sources to stay between 0 and about 1570 GtC (5760 GtCO2), 0 and about 1210 GtC (4440 GtCO2), and 0 and about 1000 GtC (3670 GtCO2) since that period, respec-tively; however, an amount of 515 (445–585) GtC (1890 (1630–2150) GtCO2), had already been emitted by 2011 [5].Based on the assessment of different sectors, regions, and key risks, the AR5 Working Group II pointed out that in case of a temperature rise of 1 °C or 2 °C compared with pre-industrial levels, the risks incurred by the world would be on the medium to high level, and in case of a temperature rise over 4 °C or even higher, the risks would be high or very high [22]. The AR5 Working Group III provided the most viable scenario to achieve the goal of keeping the global temperature rise until 2100 within 2 °C compared with the pre- industrial level: to limit the greenhouse gas concentration to 450 ppm CO2e (the shorthand for carbon dioxide equivalents). It will be necessary to reduce the global greenhouse gas emissions until 2030 to 50 Gt CO2e, to reduce global greenhouse gas emissions in 2050 by 40%–70% compared with the 2010 level, and to limit green-house gas emissions to net zero in 2100. The Report also assessed the development and technical choice in sectors such as energy, transport, building, human settlements, infrastructure, and spatial planning under this goal [23].In summary, the IPCC’s AR5 Synthesis Report defined the rela-tionship between cumulative anthropogenic emissions of CO2, glob-al average temperature change, and the potential risks to the climate system until 2050. As shown in Fig. 3[24], the risk level indicated by any given global temperature rise and the five major reasons corre-sponds to the cumulative anthropogenic emissions of CO2 within a certain range.The AR5 did not clearly define the indices and values constituting “dangerous anthropogenic interference with the climate system.” In fact, since it is highly sensitive for parties to consider the related information about Article 2 of the UNFCCC, when the AR5 Synthesis Report was reviewed and adopted at the IPCC’s 40th Session in Oc-tober 2014, the textbox providing information related to Article 2 of the UNFCCC was finally abandoned, and only the Preface of the Syn-thesis Report stated that the Report included information related to Article 2 of the UNFCCC. Nevertheless, the assessment conclusions drawn by the AR5 regarding the 2 °C global temperature target, as well as the scientific information required for decision-making (in-cluding emission budget, pathway, and technical choice) strength-ened the scientific basis for this political consensus.In 2011, the Durban Climate Change Conference established the Ad Hoc Working Group on the Durban Platform for Enhanced Action (hereinafter referred to as the Durban Platform). It launched the negotiation for an international mechanism applicable to all parties after 2020, and decided to strive for an ambitious global emission reduction goal with the timeframe for global greenhouse gas emis-sion peaking before 2050, taking into account reports such as the IPCC’s AR5 [25].From the launch of the Durban Platform to the conclusion of the Paris Agreement at the Paris Climate Change Conference, parties held different views about the expression of the UNFCCC’s prin-ciples, the scope of the agreement, and the legal form of the final results; however, the 2 °C global temperature target seemed indis-putable. The bilateral joint declarations delivered by China with the US, France, and the EU before the Paris Climate Change Conference had mentioned that it was required to “consider a global temper-ature goal within 2 °C.”† To a certain extent, this represented the consensus of China and the developed countries with respect to this issue. Based on scientific assessment and a series of political pushes, the Paris Agreement finally considered “holding the increase in the global average temperature to well below 2 °C above pre-industrial levels and pursuing efforts to limit the temperature increase to 1.5 °C above pre-industrial levels,” as one of three goals of the Agreement, and the 2 °C global temperature target was formally included in the international treaty with legal effect. During the 2016 Opening for the Signature of the Paris Agreement, held at the United Nations Headquarters in New York on 22 April, 175 parties (174 countries†US-China Joint Presidential Statement on Climate Change on November 12, 2014, in Beijing, China; EU-China Joint Declaration on Climate Change on June 29, 2015, in Brussels, Belgium; France-China Joint Presidential Statement on Climate Change on November 2, 2015, in Beijing, China.。
用英语描述中国特色的风景区作文
用英语描述中国特色的风景区作文China is a vast and diverse country filled with a wide variety of stunning landscapes and scenic spots. From towering mountains and deep forests to picturesque lakes and ancient towns, each region of China offers its own unique charm and beauty. In this essay, I will introduce some of the most famous and representative scenic spots in China, each with its own special features that showcase China's distinctive cultural and natural heritage.One of the most iconic and recognizable scenic areas in China is the Zhangjiajie National Forest Park in Hunan Province. Known for its towering sandstone pillars, lush forests, and breathtaking views, Zhangjiajie is often referred to as the inspiration for the floating mountains in the movie Avatar. The park is a UNESCO World Heritage Site and is home to a diverse range of plant and animal species, making it a paradise for nature lovers and outdoor enthusiasts.Another must-visit destination in China is the Li River in Guilin, Guangxi Province. Renowned for its stunning karst limestone formations and crystal-clear waters, the Li River is often considered one of the most beautiful rivers in the world. A leisurely cruise down the river offers visitors a unique perspectiveon the region's stunning scenery, as they pass by traditional villages, rice paddies, and limestone peaks that seem to rise out of the water.Moving to the southwest of China, we come to Jiuzhaigou Valley in Sichuan Province. Known for its vibrant turquoise lakes, cascading waterfalls, and snow-capped mountains, Jiuzhaigou is a paradise for photographers and nature lovers. The valley is home to a diverse array of plant and animal species, including the elusive giant panda, and is a UNESCO World Heritage Site due to its exceptional natural beauty and ecological significance.In addition to its natural wonders, China is also home to a rich cultural heritage that is reflected in its historic towns and ancient villages. One such town is Lijiang in Yunnan Province, a UNESCO World Heritage Site famous for its well-preserved traditional architecture, cobbled streets, and picturesque canals. Lijiang is inhabited by the Naxi minority group, who have their own unique language, customs, and traditions that date back centuries.Finally, no discussion of China's scenic spots would be complete without mentioning the Great Wall. Stretching over 13,000 miles across northern China, the Great Wall is an iconic symbol of China's rich history and cultural legacy. Built overthousands of years to protect against invasions from northern tribes, the Great Wall is a testament to the ingenuity and determination of the Chinese people and is a must-visit destination for anyone interested in world history and culture.In conclusion, China's scenic spots are as diverse andawe-inspiring as the country itself. From the towering mountains of Zhangjiajie to the tranquil waters of the Li River, each region of China offers its own unique beauty and charm that reflects the country's rich cultural and natural heritage. Whether you are a nature lover, history buff, or simply a curious traveler, China's scenic spots have something to offer everyone and are sure to leave a lasting impression on all who visit.。
China’s_Clear_Climate_Targets

China’s Clear Climate TargetsBy staff reporter CHEN JUNDESPITE the ongoing COVID-19 pandemic and complicated geopolitical issues across the world, the 2021 United Nations (UN) Climate Change Conference, also known asCOP26, convened in Glasgow, Scotland, in early No-vember, has put climate change back in the spotlight. Tackling global issues is important to China and at the Climate Ambition Summit 2020, Chinese Presi-dent Xi Jinping made three proposals for the future of global climate governance and announced four fur-ther commitments for 2030, scaling up the country’s determined contributions. This means China has even clearer targets in responding to climate change.Active Global ParticipationClimate change is a challenge facing humanity. As the world’s largest developing country, China has been active in participating in global climate gover-nance. From the Kyoto Protocol to the Copenhagen Accord and the Paris Agreement, China has been making concrete moves to build a community of a shared future for humanity.The Kyoto Protocol, adopted in 1997, is the first legally binding global document for climate change mitigation. It entered into force in 2005. The Chinese government signed the protocol in May 1998, and ratified it in August 2002.Under the principle of “common but differentiated responsibility and respective capabilities,” the docu-ment sets binding emission reduction targets for de-veloped countries, but no such targets for developing economies. China, despite being a developing coun-try, has long recognized the importance of environ-mental protection and rolled out a slew of policiesand measures to lower greenhouse gas emissions.China’s carbon intensity went down 45.8 percent in 2018 from the 2005 level. Thus it, ahead of schedule, fulfilled its commitment of reducing carbon intensity by 40 to 45 percent by 2020 from the 2005 level.A view of several wind turbines of the Yangjiang Shapa Offshore Wind Farm in south China’s Guangdong Province oper-ated by China Three Gorges Renewables (Group) Co., Ltd.Carbon Neutrality Research Center at the Institute of Atmospheric Physics is inau-gurated in Beijing on December 24, 2020, to serve the nation’s majorneeds and provide a sci-tech platform for the country to achieve its carbon peak and neutral-ity goals.2The measures include formulating and implementing a strategy for sustainable development, which covers responding to climate change, the use of new energy and renewable energy, and forestation campaigns. These actions have helped climate change mitigation and adaptation.The world has also met setbacks in tackling cli-mate change. In 2009, the UN Climate Change Con-ference held in Copenhagen, Denmark, met with a backlash from some developed countries, resulting in just a voluntary agreement on future action. Despite reiterating climate targets, the Copenhagen Accord was not mandatory.Nevertheless, the Chinese government pledged an emission reduction target by 2020, shortly after the Copenhagen Accord was adopted in 2009. It an-nounced that the country would reduce the carbon emission intensity, namely emissions for per unit of GDP, by 40 to 45 percent from the 2005 level by 2020. Notably, the Communist Party of China included ecological progress into its overall plan for advanc-ing socialism with Chinese characteristics at its 18th National Congress held in 2012. The philosophy ofgreen development has since been fully implementedin China’s social and economic development, and thecountry has been taking stricter measures in carbonemission reduction.According to the report “Climate Change – A RiskAssessment,” jointly produced by experts from theUnited Kingdom, China, the United States, and Indiain 2015, with a series of measures, China had contin-ued the downward trend of carbon emission since2005. By the end of 2014, the growth rate of China’scarbon emissions had approached zero, and the car-bon intensity decreased 33 percent compared withthe 2005 level. The report recognized China’s achieve-ments in carbon emissions.The Paris Agreement adopted in December 2015once again brought people hope on tackling climatechange with joint global efforts. The legally bindinginternational treaty on climate change made ar-rangements for post-2020 climate actions. It enteredinto force on November 4, 2016. In setting the nation-ally determined contribution (NDC) targets, Chinapledged to peak carbon emissions by 2030, or evenearlier, with the utmost capacity, and to reduce theGDP per unit of carbon emissions by 60 to 65 percentby 2030 compared with thelevel of 2005.To achieve the targets,China made great efforts infighting pollution during the13th Five-Year Plan period(2016-2020) and introducednine restrictive indicators inthe ecological and environ-mental field. China’s Ministryof Ecology and Environment(MEE) released a 2019 reporton China’s policies and actions on climate change onNovember 27, 2019. According to the report, China’scarbon intensity went down 45.8 percent in 2018from the 2005 level. China had, ahead of schedule,fulfilled its commitment of reducing carbon intensityby 40 to 45 percent by 2020 from the 2005 level, saidZhao Yingmin, vice minister of the MEE.A Clearer PathwayA staunch supporter of global environmentalgovernance, China has been making active moves toimplement the Paris Agreement. As early as Septem-A staunch supporterof global environmen-tal governance, Chinahas been making activemoves to implement theParis Agreement.ber 2020, China announced that it would scale up its NDC and introduce more vigorous policies and measures to peak carbon emissions by 2030 and go carbon neutral by 2060.At the Climate Ambition Summit 2020, Presi-dent Xi announced further commitments for 2030: China will lower it carbon dioxide emissions per unit of GDP by over 65 percent from the 2005 level, increase the share of non-fossil fuels in primary energy consumption to around 25 percent, increase the forest stock volume by 6 billion cubic meters from the 2005 level, and bring its total installed capacity of wind and solar power to over 1.2 billion kilowatts.Antonio Guterres, secretary-general of the United Nations, spoke highly of China’s commitment. He said Xi’s speech gave a direction for the world of how to get out of the woods in climate governance and that it boosted the confidence and ambition of the international community and strengthened solidar-ity to tackle climate change.China’s commitments also offered a roadmap to carbon emission peaking and carbon neutrality. The two targets showed China’s determination to fully implement the Paris Agreement, said Lin Boqiang, director of the China Institute for Studies in Energy Policy, Xiamen University. The commitments rep-resent a Chinese solution to improving the system for international climate governance. Increasing the share of non-fossil fuels in primary energy consump-tion to around 25 percent is undoubtedly a major way to achieve targets for global climate change response.According to statistics of the National Develop-ment and Reform Commission and the MEE, the share of non-fossil fuels in primary energy consump-tion was 15.3 percent in 2019, and its increment rep-resented 40 percent of the total increment in primary energy consumption. China’s energy mix had become cleaner and greener.Lin Boqiang said that China needs to devote greater effort to transforming its energy mix into a low-carbon one so as to achieve the 25-percent tar-get. On the one hand, it should further limit fossil fuel consumption particularly that of coal, contain the scale of coal-burning power generation, and manage the use of coal for non-industrial purposes. On the other hand, it should encourage the devel-opment of non-fossil fuel industries, in particularwind and solar power.How to Achieve the 25-Percent TargetIn the phase-two offshore wind plant owned byChina Three Gorges Corporation in Xinhua Bay,southeast China’s Fujian Province, the country’s first10-megawatt offshore wind turbine generator unithas been running smoothly for five months. It hasgenerated power totaling 13 million kilowatt hours.Independently developed by China, it is the largest inthe Asia-Pacific Region and the second largest in theworld. Compared with coal-burning power genera-tors, the generator unit saves 430,000 tons of stan-dard coal, and reduces 750,000 tons of carbon dioxideand sulfur dioxide emissions.Kubuqi Desert in north China’s Inner MongoliaAutonomous Region houses the country’s largestbase for centralized photovoltaic power generation.With a planned capacity of two million kilowatts,phase one of the base was put into operation on De-cember 10, 2018, and phase two started constructionaround one year later. According to its spokesperson,the base will be capable of generating four billionkilowatt hours of power annually, an output worthmore than RMB 1.5 billion. In the meantime, it willhelp reverse desertification trends on 8,000 hectaresof land, and reduce carbon emission by 3.2 milliontons annually.China’s invest-ment in renew-able energytotaledRMB2.5 trillion.China’s installedcapacity of re-newable energyfor electricitygenerationaccountedfor around30 percent ofthe world’s total.A photovoltaicpower plant in theKubuqi Desert inInner MongoliaAutonomousRegion.RMB2.5trillionThese achievements provide a prime example of China’s efforts in promoting non-fossil fuels. Statis-tics show that during the 13th Five-Year Plan period (2016-2020), China’s investment in renewable energy totaled RMB 2.5 trillion. China ranked first in the world in the number of patents related to renew-able energy, total investment in the sector, installed capacity and the volume of power generated by renewable energy. China’s investment in renewable energy has surpassed US $100 billion for five years in a row. China’s installed capacity of renewable energy for electricity generation accounted for around 30 percent of the world’s total. These laid a solid founda-tion for China to realize the target of increasing the share of non-fossil fuels in primary energy consump-tion to around 25 percent.Lin said of the main types of renewable energy, hydropower has limited potential, and nuclear power needs a long construction cycle and sophisticated safety facilities. In comparison, wind and solar power generation is a cost-effective option to increase the use of non-fossil fuels.“Despite rapid development over the last decade,China’s photovoltaic industry contributed only asmall share of 3.9 percent of national power genera-tion and could be increased greatly,” said Lin.Lin called for more supportive policies for thewind and solar power sectors, and encouraged theprivate sector to invest in the sectors and build upstrong industrial chains for the sectors. Starting fromthe 14th Five-Year Plan (2021-2025), China should setout emission reduction targets for each five-year planand give supportive policies.In fact, “green development” has been includedin China’s 14th Five-Year Plan, in which the countrypledged to boost low-carbon development, efficientand safe use of clean energy, reduce carbon intensity,and support localities to peak carbon emissions asearly as possible.“It is both a challenge and opportunity for China’seconomy to go carbon neutral in the following 40years. Increasing the share of non-fossil fuels inprimary energy consumption is an inherent require-ment of high-quality development,” said Lin. CYouth representa-tives at the 2021Sino-AmericanYouth Dialogueheld on October 8at Tsinghua Uni-versity in Beijingare reading a jointproposal of youthto address climatechange and pro-tect biodiversity inthe context of thecarbon neutralitygoals.。
scenario例句

scenario例句【释义】scenarion.设想,可能发生的情况;(电影、戏剧等的)剧情梗概;(艺术或文学作品中的)场景复数scenarios【短语】1scenario planning情景规划;情景设定和突发计划2usage scenario使用场景;使用方案;使用方式情节3scenario writer scenarist剧作家;剧作家放映4scenario writer电影电影剧本作者;剧作家;剧本作家;剧本作者5baseline scenario基线情境;基线情景;基准情景;基准线情景6Scenario testing基于场景的测试方法;场景测试;情景测试7Scenario Status场景运行状态8Test scenario测试场景;测试方案;系统称为测试方案【例句】1The worst-case scenario is an aircraft will crash if a bird destroys an engine.如果小鸟毁坏了一部发动机,最坏的情形是飞机坠毁。
2Then he came up with a scenario that combined some hunting by humans with some environmental stress.然后他提出了一个结合人类捕猎和环境压力的场景。
3We developed an example integration scenario that could be enabled by any of the myriad of coexistence mechanisms.我们开发了一个示例集成场景,该场景可以由无数的共存机制所支持。
4A year from now(or less if you're not such a scaredy-cat like I was),you just might not be imagining that loving the morning scenario anymore.一年之后(也许会更短,如果你不是像我一样的胆小的话),你可能再也不会想象自己热爱早晨的场景了。
中国未来建筑设计英语作文
中国未来建筑设计英语作文China's Future Architectural Design。
In recent years, China's economy has grown rapidly, and the construction industry has also developed rapidly. With the improvement of people's living standards, the demandfor high-quality buildings and living spaces has become increasingly urgent. Therefore, the future of China's architectural design is full of opportunities and challenges.Firstly, the development of green architecture will be the trend of the future. With the increasing awareness of environmental protection, the design concept of "green,low-carbon and sustainable" has become the mainstream of architectural design. Buildings should not only meet the functional requirements of people's lives, but also minimize the negative impact on the environment. For example, the use of renewable energy sources, the adoption of rainwater harvesting systems, and the application ofgreen roofs can all effectively reduce the energy consumption and carbon emissions of buildings.Secondly, the integration of technology andarchitecture will become more and more common. With therapid development of technology, the application of new materials, new technologies and new equipment inarchitectural design will become more and more extensive. For example, the use of 3D printing technology can greatly improve the efficiency and accuracy of building construction, and the application of smart home systems can bring people more convenient and comfortable living experiences.Thirdly, the design of public buildings will pay more attention to cultural heritage and regional characteristics. As a country with a long history and rich cultural heritage, China's architectural design should not only meet the functional needs of the building itself, but also reflectthe cultural characteristics of the region and the nation.In the future, the design of public buildings such as museums, libraries and cultural centers should be based onthe protection and inheritance of cultural heritage, and the integration of traditional and modern elements should be achieved.Finally, the development of urbanization will bring new challenges to architectural design. With the rapid development of urbanization, the demand for high-density, high-rise buildings will increase. Therefore, the design of urban buildings should focus on the balance between functionality and aesthetics, and strive to create a harmonious living environment for people.In conclusion, the future of China's architectural design is full of opportunities and challenges. The development of green architecture, the integration of technology and architecture, the attention to cultural heritage and regional characteristics, and the challenges brought by urbanization will all promote the innovation and progress of architectural design in China. As a designer, we should always adhere to the concept of sustainable development, and strive to create more high-quality,comfortable and environmentally friendly living spaces for people.。
职场实用英语交际教程(中级)教师用书_Unit 8
Teacher’s Book for Unit 8Unit 8 Advertise a productMotivatingAbout the unitAdvertising is crucial to every business as it provides the opportunity to make the target market aware of their product or services. It builds a connection between products or services and customers. Effective advertising not only attracts new customers, but also promotes repeat business as well. It helps companies to remain competitive and gain more sales. Depending on the scale of business, companies either have their own publicity department or hire a professional advertising agency to create an attractive and appealing advertisement. Common advertising media available to an advertiser include: direct mail, newspaper and magazines, television advertising, radio advertising, film advertising, outdoor advertising, window display, fairs and exhibition.This unit mainly focuses on writing advertising copy. In “Inputting”, Ss will learn the content and the necessary words and expressions to describe an advertised product, as well as how to structure and write the advertisement successfully, before they complete the production task in “Outputting”. “Extending” will help Ss learn the advantages and disadvantages of different advertising media and better understand the distinct features of language in advertising. After studying this unit, Ss will be able to write an advertisement and understand the importance of advertising in the business world.Teaching objectivesUpon completion of this unit, the T is expected to enable Ss to:●list the words and expressions concerning advertising (Listening & Reading:Form)●identify the selling points of a product (Listening & Reading: Content)●describe the structure of an advertisement (Structuring)●list three ways of advertising (Listening & Reading: Content)●write an advertisement based on information gathered about a product(Outputting)Teaching suggestionsA production-oriented approach is suggested here. By adopting this approach, the T needs to make clear the unit setting, the production task and the learning objectives in “Motivating”. With the content, language and structure learned in “Inputting”, the T can help Ss get prepared for the production task in “Outputting”. “Extending” is the final stage where a follow-up listening and reading are carried out.Sections TipsMotivating Period 1 (Warming-up)• Present the scenario of communication to Ss.(Trying-out)• Ask Ss to try out the communicative task.• Help Ss realise their gap to complete the task and arouse their interest in learning.(Taking aim)• Explain the learning objectives and the output task.• Make sure Ss can distinguish between the communication and the language objectives.• Make sure Ss are clear about the type and content of the output task.Inputting Periods 1-3(Listening)• Play the audio for Ss to listen to for the first time and to do Task 1 to get topics discussed about Bella & Flora’s products; check the answers and offer help to Ss if necessary.• Play the audio for Ss to listen to and to finish Task 2 to get further details about the products, such as fabrics, target customers, etc.; check answers and offer help to Ss if necessary.• Explain the Language Points (The T may explain the language points before the first listening).• Explain the Cultural Point and the Business Point.• Lead Ss to summarise the language that can be used to complete the output task.(Reading)• Guide Ss to read and understand the passage by finishing the two tasks of “Content” (Task 2 might be finished before Task 1 if necessary) toget details about the company’s new seasonal wear; check answers and provide assistance when necessary.• Explain the Language Points, the Cultural Point and the Business Point and any part of the passage that might be necessary for Ss.• Guide Ss to finish the three tasks of “Form” (some of the tasks such as Task 3 might also be finished flexibly while the language is being explained); check answers and provide assistance when necessary. • Lead Ss to note down more information of the new product and collect more language structures that are useful for the output task. (Structuring)• Explain the structure of an advertisement copy.• Guide Ss to grasp the structure of an advertisement by finishing the Task; check answers and provide assistance when necessary.• Make sure Ss have grasped the structure of an advertisement before moving to the next part of the unit.Outputting Period 4 • Describe the output task so that Ss are clear about each step of the task and relevant requirements of each step.• Guide Ss to finish the output task step by step and carry out the self-assessment.• Assess Ss’ performance by working with them together (construct the assessment criteria with Ss in advance and make a timely assessment inside or outside the class according to the time available).• Provide assistance when necessary.Extending (outside class) (Listening & Reading)• Assign Ss to finish the tasks and provide the channel through which Ss can check answers; provide assistance when necessary.• If time permits, the T can also guide Ss to finish the tasks inside the class and roughly follow the procedures of “Listening” and “Reading” in “Inputting”.Inputting2.1 ListeningLanguage focus1.No wonder we always have a good word of mouth advertising.no wonder: not surprising; not unusual难怪;不足为怪e.g. He has been learning French for several years. No wonder he has noproblem communicating with the locals.2.Our competitors are trying to grab our market share by undercutting their price.1)market share: the percentage of an industry’s sales that a particularcompany owns市场份额e.g. They claim to have a 20% worldwide market share.2)undercut: v.to offer goods or services at a lower price than (one’scompetitors) 以低于(他人)的价格出售e.g. They are undercutting us by 20 p a packet.3.Maybe that’s something to run the advertising campaign around.campaign: n. series of planned activities to gain a special object (宣传)活动e.g. It will cost a lot of money to run a political campaign.Reference answersTask 1☑quality☑ market share☐design☑price☑ target customers☐production process☑ advertising strategy☑ contact numberTask 21.silk2.green3.454.fashion5.middle6.quality7.identity8.familyScripts:Natalie:Mr Reefs, do you have a minute? I’m planning an ad for our new seasonal wear and I’d like to talk about it with you.Paul:Sure.Natalie:It’s perfect that our products are of the highest quality in the market.Paul:Yes, especially our fabrics which are of top quality—silk from China, fibre from India, and linen from Russia.Natalie:And our fabrics are all natural and green. No wonder we always have a good word of mouth advertising.Paul:Yes, but we’re facing strong competition at the moment. Our competitors are trying to grab our market share by undercuttingtheir price.Natalie:That’s true. But our target customers are those aged between 25 and 45 who live in cities. They are a fashion-conscious group, whoare educated and fall in the middle-class category. So, fortunately,they often have a relatively high income.Paul:Yes. I believe they are willing to pay more for comfortable, quality products.Natalie:And most of them are married. Therefore, our advertising should create a strong message emphasising the importance of family.When they wear our clothes, they will feel a sense of identity andcommunity.Paul:That’s true. Maybe that’s something to run the advertising campaign around. We hope our customers can associate our brandwith positive feelings such as happiness, family and love. Anadvertising campaign based on that idea could help keep us the topbrand in this area.Natalie:Absolutely.Paul:All right,if you have any further questions, please call me. Or you can also call 0040-2073689627, which is to be used as the contactnumber in the ad we have talked about.2.2 ReadingLanguage focus1.For this year’s spring and summer wear, Bella & Flora is devoting itself toproviding customers with new products based on simple but comfortable designs.1)devote oneself to: to give (one’s time, energy, etc) to sb/sth; to dedicate致力于;献身于e.g. The scientist devotes himself to the exploration of outer space.2)base on: to use sth as grounds, evidence, etc for sth else使建立在……基础上e.g. I base my hopes on the good news we had yesterday.2.The latest collection of Bella & Flora features a wide range of different whitecotton shirts for both men and women.feature: v. to give a prominent part to sth; to be characterized as... 以……为特色e.g. Chinese cuisine features a wide variety of tastes.3.We use organic cotton that is naturally grown in healthy soil, free of harmfulchemicals.free of: not harmed by sth dangerous; not spoiled by sth unpleasant免于……的影响或伤害e.g. I want to have a holiday free of all anxieties.4.The shirts made of these soft and comfortable fabric are suitable for bothworkdays and weekends.suitable for: right or appropriate for a purpose or an occasion适合的;适宜的e.g. You’d better buy some clothes suitable for cold weather.5.Their simple design can fulfill different purposes on different occasions.fulfill: v. to perform sth or bring sth to completion实现;履行e.g. Once you’ve made a promise, you need to fulfill it.6.For example, free-size wear is designed with a symbolic A-shape and loose-fitting cuttings, suitable for casual wear.casual: a. not formal 随便的;非正式的e.g. Please don’t wear casual clothes to the office.7.Apart from the basic colors of black and white, light blue has been added tobring a fresh feeling to the collection.apart from: leaving on one side; besides除了……之外(还);不止e.g. Apart from global warming, is there any other reason for the weatherchange in this area?8.Since Bella & Flora is a lifestyle brand, the concept of family is held at the coreof the business.core: n. most important part of sth 核心;最重要的部分e.g. The technicians are trying their best to protect the core of the computerfrom the invading virus.This sentence contains an adverbial clause of reason “since Bella & Flora is a lifestyle brand”, starting with the subordinator “since”. It indicates why Bella & Flora holds family as the most important part of its business.This sentence can be paraphrased as: Bella & Flora is a lifestyle brand, so it holds the concept of family as the most important part of its business.Reference answersContentTask 11. D2. C3. B4. ATask 21. D2. D3. B4. B5. CFormTask 11.casually2. chemistry3. sleeves4. fulfilling5. featuringTask 21.based on2. apart from3. suitable for4. free of5. devoted himself toTask 3Model 11.The little girl saved by the firemen in the earthquake became a doctor.2.The pizza bought from the roadside bakery can be shared by four kids.Model 21.Since the necklace was a gift from her father, she cherished it very much.2.Since it was a complicated story, the man spent one hour explaining it.2.3 StructuringStructure extensionIn order to keep your advertising relevant and effective, it is very important to identify your target audience before you start writing an advertisement. You can first form a profile of your typical customer. For instance, if you sell gym equipment, you can logically assume your typical customer is either someone who owns a fitness facility store or an athlete who wants to exercise at home. Once you have correctly identified your target audience, you need to connect them with your brand. One of the most direct and most common ways is by telling them a story. Stories communicate messages in highly specific and emotionally impactful ways. They’re memorable, and they give us something to identify with and hold on to. Linking a brand with a good story allows customers to connect with the product on an emotional level, to be more receptive to its message and therefore more likely to buy it.An advertising slogan is a catchy tagline or phrase that is used by a company for advertising. It’s a short and sweet reminder of the value a brand offers to their customers. Almost every branding strategy involves the creation and use of an advertising slogan. The followings are some examples of the most popular slogans of all time: “Just Do It”--- Nike“Think Different”--- Apple“Impossible Is Nothing”--- Adidas“Open Happiness”--- Coca-Cola“Have It Your Way”--- Burger King“Go Beyond”--- Land Rover“I'm Lovin’It”--- McDonald's“Anytime, Anywhere”--- WalmartHere are some basic rules for creating an advertising slogan:1.Keep it short and simpleConsumers are more likely to remember brief statements or advertisements. Limit your slogan to no more than 10 words.2.Be consistentMake sure your business slogan complements your existing logo, company name and projected image.3.Focus on what makes you differentFigure out what your unique selling proposition is and use it.Reference answersHeadline:By asking the reader a question and using “special” three times to draw the attention.Body of the copy:a.The special occasions include a special moment with a friend, the end of a longday or the time after a delicious dinner.b.Sipsome travels the world to find the finest ingredients for the tea.Slogan:a.Sipsome tries to sell the concept of love to its customers.b.Alliteration is used in the slogan.c.It makes the language rhythmical and leaves the reader with a deep impression.Call-to-action:They can call at 1-800-457-0789.OutputtingSuggestions for evaluationContent Does the advertisement include the distinct selling pointsof the product?Structure Is the advertisement completely and logically organised?Language Are word choice and sentence structures appropriate?Communication Strategy Is the advertisement written clearly and effectively to the reader?SampleWe Take Care of Our Customers as We Take Care of Our FamilyAfter the launch of Basic Daily Wear, Bella & Flora brings you the new Seasonal Wear Series.This year’s spring and summer collection endeavors to explore themes of building a fashion family. We take you and your loved ones outdoors to enjoy the fragrance of spring and freshness of early summer. Whether you go hiking or havea picnic in the park, Bella & Flora gives you the same comfortable experience asalways. Being soft, yet strong and supple, our cotton wear allows you to move at your will and enjoy nature to your heart’s content. You no longer need to worry about sweaty shirts, because the airy texture of our organic cotton allows your skin to breathe thoroughly. Our loose-fit clothes are comfortable and casual, and are especially designed for outdoor activities. And don’t frown upon your kids’ muddy pants, because they are easy to wash and dry. So let them run in the woods as freely as happy birdies.With a neutral color palette, our new series is simple, basic and universal. The featured new color, light blue, gives you the sense of a cool breeze and a look of stylish simplicity.We offer a wardrobe for the whole family in this season. When you are wearing our products with your loved ones, we want you to have a sense of love and togetherness, because we believe in:the Best Quality for the Most Loved OnesContact: for further inquiry about our products, please call us at 0040-2073689627.ExtendingReference answers4.1 Listening1.B2. A3. B4. A5.A4.2 Reading1.positive impression2.argue3.depth4.Verbs and adverbs5.connotationsScripts:Tim:Hi, Natalie. I’ve heard that you are promoting our next season’s wear.Natalie:Yes. I have written an advertisement for the Family magazine.Tim:That’s great! But why don’t you use TV commercials? With the colourful scenes and sound, would it be more exciting andimpressive?Natalie:Yes, it would. But it is incredibly expensive. We couldn’t afford it.It normally costs about $300,000 to produce a high quality 30-second ad. We have an advertising budget of only $80,000, whichis rather tight, I’m afraid.Tim:Oh, I see. Well, I have always thought that TV has a very big audience.Natalie:But we may run the risk of spending a lot of money advertising to people who’ll never buy our products. We chose Family magazinebecause it has a subscription of over six million, yet its ads costonly one-third of TV ads. Besides, we can advertise directly to ourtarget customers.Tim:OK. That sounds good. We have to maximise the reach to our target users at the lowest possible cost.Natalie: Yes, you are right. Next time, we may try to advertise on somesocial media platforms as they are becoming very popular thesedays...。
宜居城市 - 城市的宜居与可持续发展
CONTEXT 背景
|OPPORTUNITY & CHALLENGE |机遇与挑战
Additional inhabitants per hour 世界大城市每小时居住人数量变化
CONTEXT 背景
|OPPORTUNITY & CHALLENGE |机遇与挑战
Decisions cities make today will impact many generations to come.
WATER 水
Water-Energy Nexus in Wastewater Sector in Chengdu 成都污水处理中的水-能关联
• Water and Energy are closely related. Creating energy consumes enormous quantities of water while the treatment and moving of water also take a significant amount of energy. • 水资源和能源密切相关,能源的获取需要水,水的生产和 污水处理的整个过程也需要大量的能源。 • Purpose of the study : enhancing energy efficiency of wastewater system and reducing GHG emission while ensuring achieving pollutant reduction targets. • 目的:在实现污染物减排目标的前提下,提高成都污水处 理系统能效,降低能耗,并减少温室气体的排放,获得污 染物减排和污水处理系统低碳可持续发展的双赢。
•
SLC in CHINA | POLICY PLATFORM 中国项目 | 政策平台
给外国人介绍中国特色主题公园作文英语
给外国人介绍中国特色主题公园作文英语Here is a 1,000-word essay introducing a unique Chinese theme park to foreign readers:China is a country with a rich cultural heritage spanning thousands of years. From the awe-inspiring natural landscapes to the bustling modern cities, there is so much for visitors to explore. One of the most fascinating ways to experience authentic Chinese culture is by visiting a theme park that showcases the country's distinct traditions and customs.One such park that offers a immersive look into the heart of China is the Splendid China Folk Culture Village located in Shenzhen. As the world's largest miniature park, Splendid China presents 116 of the country's most iconic landmarks and cultural sites in intricate 1:15 scale models spread across 118 acres. Guests can stroll through meticulously recreated scenes depicting the architectural styles, lifestyles, and rituals of China's diverse ethnic minority groups.Stepping into Splendid China is like embarking on a whirlwind tour of the entire country. The journey begins in the north with the Great Wall of China, one of the most famous man-made wonders of theworld. The 1/15 scale model spans over 2,000 meters, allowing visitors to truly appreciate the sheer scale and engineering feats of this massive fortification. As you walk along the wall, you can almost imagine the troops stationed here centuries ago, vigilantly guarding the borders against invaders.Continuing south, the next stop is the Forbidden City in Beijing, the grand imperial palace that served as the center of Chinese government for over 500 years. The attention to architectural detail in the model is truly astounding, from the intricate rooftop designs to the symmetrical layout of the courtyards. It's easy to get lost exploring the maze of throne rooms, temples, and living quarters that would have been off-limits to common citizens in imperial times.Further south, you'll encounter the karst landscape of Guilin, famous for its towering limestone mountains and winding rivers. The model village replicates the tranquil Li River, complete with bamboo rafts gliding across the glassy water and fishermen casting their nets from the banks. It's easy to find a serene spot to sit and take in the natural beauty, just as countless traditional Chinese artists and poets have done throughout history.One of the most vibrant and colorful sections of Splendid China celebrates the diverse cultures of the country's 56 recognized ethnic minority groups. From the Tibetan monasteries of the Himalayanplateau to the stilt houses of the Tujia people in the misty Wuling Mountains, each meticulously crafted model transports you to a different corner of China. Visitors can watch performances of traditional music and dance, sample regional cuisines, and even participate in cultural workshops to gain a deeper appreciation for this rich tapestry of traditions.No visit to Splendid China is complete without exploring the stunning gardens and architecture of southern China. The park features detailed replicas of landmarks like the Temple of Heaven in Beijing, the Leshan Giant Buddha, and the ancient watertown of Zhouzhuang. Wandering through these serene, picturesque settings, it's easy to understand why classical Chinese landscape painting is so renowned worldwide.In addition to the incredible model displays, Splendid China also offers a wide variety of live performances and interactive exhibits that allow visitors to fully immerse themselves in the culture. Acrobatic troupes, martial arts demonstrations, and traditional tea ceremonies provide glimpses into the day-to-day lives of ordinary Chinese people. Children and adults alike can also participate in calligraphy workshops, try on authentic ethnic costumes, and even learn to play ancient instruments.What makes Splendid China such a unique and valuable experienceis its ability to condense the sheer vastness and diversity of China into a single, cohesive destination. Rather than just passively observing scale models, guests are encouraged to engage with the cultural elements on display and create their own personal connections. Whether you're marveling at the intricate architecture, getting lost in the serene natural landscapes, or connecting with local artisans, there's something to captivate every visitor.Of course, no theme park can fully encapsulate the richness and complexity of an entire civilization. However, Splendid China comes remarkably close, offering a rare opportunity for international tourists to gain a deeper understanding and appreciation of Chinese heritage. By presenting the country's most iconic landmarks and cultural traditions in such an accessible and immersive format, the park sparks curiosity and wonder, inspiring guests to explore more of this fascinating country. As you leave Splendid China, you'll not only have incredible memories and photos, but a genuine sense of having experienced the essence of China for yourself.。
- 1、下载文档前请自行甄别文档内容的完整性,平台不提供额外的编辑、内容补充、找答案等附加服务。
- 2、"仅部分预览"的文档,不可在线预览部分如存在完整性等问题,可反馈申请退款(可完整预览的文档不适用该条件!)。
- 3、如文档侵犯您的权益,请联系客服反馈,我们会尽快为您处理(人工客服工作时间:9:00-18:30)。
<div class="article_tit"> China£§s target-setting scenario requires flexibility </div> <span>×÷Õß : ±¾¿¯±à¼-²¿</span> <p> ¡¡¡¡Macro-control Research Group of Institute of Economics, <br>¡¡¡¡Chinese Academy of Social Sciences <br/>¡¡¡¡ <br/>¡¡¡¡Abstract: <br/>¡¡¡¡This report is in four parts: Part I reviews the guidelines and targets of the 11th Five-year Plan Outline on Socioeconomic Development of the People's Republic of China (hereinafter ¡°11th Five-year Plan¡±); Part II explains the achievement of macrocontrol targets; Part III proposes policy recommendations for growth targets of the 12th Five-year Plan period; and Part IV provides calculations and analysis for the policy recommendations. <br/>¡¡¡¡ <br/>¡¡¡¡Key Words: <br/>¡¡¡¡ 11th Five-Year Plan, 12th Five-Year Plan, macro-control objectives, economic growth objective <br/>¡¡¡¡ <br/>¡¡¡¡This report aims to assess the implementation of macroeconomic control during the 11th Five-year Plan period (2006-10) and provide policy recommendations and analysis for growth targets in the 12th Five-year Plan period (2011-15). This report is in four parts: Part I reviews the guidelines and targets of the 11th Five-year Plan Outline on Socioeconomic Development of the People's Republic of China (hereinafter ¡°11th Five-year Plan¡±); Part II explains the achievement of macrocontrol targets; Part III proposes policy recommendations for growth targets of the 12th Five-year Plan period; and Part IV provides calculations and analysis for the policy recommendations. <br/>¡¡¡¡ <br/>¡¡¡¡I. Guidelines and targets of macroeconomic control for the 11th Five-year Plan <br/>¡¡¡¡ <br/>¡¡¡¡Chapter I of the 11th Five-year Plan includes six guidelines. The first is on macroeconomic control, calls for ¡°stable and fast economic growth¡± and requires that ¡°changes in economic trends should be well-managed to keep stable supply and demand, avert wild swings in the economy, and achieve rapid and sound development.¡± <br/>¡¡¡¡The 11th Five-year Plan proposed nine sets of socioeconomic targets. The first is on ¡°stable macroeconomic operation.¡± This includes four targets: (1) two economic growth targets: annual average GDP growth of 7.5% and per capita GDP annual growth of 6.6%, an aggregate twofold increase over 2000; (2) three employment targets: new urban employment, relocation of 45 million agricultural laborers and registered urban unemployment kept below 5%;(3) price: stable overall price levels; and (4) basic equilibrium in international balance of payments. <br/>¡¡¡¡The 11th Five-year Plan includes 22 indicators, of which 14 are expectations and eight are binding indicators. The two growth targets and three specific employment targets are binding targets. <br/>¡¡¡¡ <br/>¡¡¡¡II. Macrocontrol target achievements of the 11th Five-year Plan <br/>¡¡¡¡ <br/>¡¡¡¡1. Economic growth targets <br/>¡¡¡¡GDP growth rates during the 11th Five-year Plan period were: 11.6% in 2006, 13% in 2007 and9.6% in 2008. The GDP growth rate was 7.7% from Q1 to Q3 of 2009 and is predicted to be 8.3% for the whole year. The forecast for 2010 is9.1% (see Figure 1).1 Over the past five years, annual GDP growth reached10.3%, higher than the target of 7.5% set by the 11th Five-year Plan. <br/>¡¡¡¡GDP growth fluctuations during the 11th Five-year Plan period <br/> ¡¡¡¡Growth rates in 2006 and 2007 continued the upward momentum that started in 2000, reaching 11.6% and 13%, respectively. This kept China's GDP growth rate on an upward trajectory between 8% and 13% for eight successive years and marked the longest growth course in economic cycles since the founding of the People's Republic of China in 1949. In previous economic cycles, upward cycles usually lasted for only one or two years. A side effect of this continued growth is excessive fixed-asset investments, money, credit and a trade surplus. These questions have brought about risks of overheating and inflation. In response, the Central Economic Working Conference held at the end of 2007 shifted the focus of macrocontrol to preventing overheating and inflation. Prudent monetary policy was adjusted to tight monetary policy, and a prudent fiscal policy was pursued. <br/>¡¡¡¡The third year of the 11th Five-year Plan period, 2008, saw a worsening U.S. sub-prime crisis that developed into a once-in-a-century global financial crisis. The coincidence of domestic economic adjustment and the global financial crisis caused a rapid slowdown, a striking contradiction to China's previous socioeconomic development. China promptly took a proactive fiscal policy, moderately relaxing monetary policy and launching a stimulus package that reversed the slowdown in Q2 of 2009, the earliest recovery in the world. GDP growth rates reached 10.6%, 10.1%, 9% and 6.8%, respectively, during the four quarters of 20082 and 6.1%, 7.9% and 8.9% during the first three quarters of 2009. In 2008 and 2009, annual GDP growth rates fell to 9.6% and 8.3%, respectively. <br/>¡¡¡¡The last year of the 11th Five-year Plan period, 2010, is expected to enjoy a better economic environment than 2009 as long as there are no major incidents affecting the domestic and international economy. The GDP growth rate may rise to 9.1%. According to an IMF forecast, China's GDP growth rate will reach 9% in 2010. <br/>¡¡¡¡The GDP growth rate in the 11th Five-year Plan period is 10.3%, lower than 12.3% in the Eighth Five-year Plan period (1991-95) (see Table 1). but higher than 8.6% in the Ninth Five-year Plan period (1996-2000) and 9.6% in the 10th Five-year Plan period (2001-05). The standard deviation of the GDP growth rate is two percentage points during the 11th Five-year Plan period, lower than 2.16 percentage points in the Eighth Five-year Plan period but higher than 1.02 percentage points and 0.87 percentage points during the Ninth and Tenth Five-year Plan periods. Intensity of fluctuations, or the difference between the peak and trough in GDP growth of various five-year plans, is 4.7 percentagepoints in the 11th Five-year Plan period, lower than 5.0 percentage points in the Eighth Five-year Plan period but higher than 2.4 percentage points and 2.1 percentage points in the Ninth and 10th Five-year Plan periods. There was a wild swing in the GDP growth rate in the Eighth Five-year Plan period (see Figure 1). GDP grow rates were in stable decline during the Ninth Five-year Plan period with minor fluctuations. GDP growth rates were stably increasing during the 10th Five-year Plan period with minor fluctuations. Swings in GDP growth rates during the 11th Five-year Plan period have been smaller than in the Eighth Five-year Plan period. Amid the current global financial crisis, China has achieved the objective of stable and rapid economic growth set by the 11th Five-year Plan. <br/> ¡¡¡¡It should be mentioned that during the 11th Five-year Plan period, China's GDP aggregate overtook the UK in 2006 and Germany in 2007, making China the third-largest economy in the world. According to a forecast by the IMF, China's GDP aggregate will overtake Japan in the last year of the 11th Five-year Plan period, 2010, becoming the second-largest economy in the world. <br/>¡¡¡¡Per capita GDP growth rates during the 11th Five-year Plan period were: 11% in 2006, 12.5% in 2007, 8.4% in 20083, 7.7% in 2009 (forecast), and 8.5% in 2010 (forecast)4. Over the five years, per capita GDP grew by an annualized 9.2%, higher than the target of 6.6%. With per capita GDP of 1978 as 100, its constant price index of 2000 is 575.5, which is expected to increase to 1,392.7 in 2010, 2.4 times the level of 2000. If so, the target of twofold growth set by the 11th Five-year Plan will be exceeded. <br/>¡¡¡¡ <br/>¡¡¡¡2. Employment targets <br/>¡¡¡¡In the first three years of the 11th Five-year Plan period (2006, 2007 and 2008), China's urban employment was 11.84 million, 12.04 million and 11.13 million people. The global financial crisis and domestic slowdown have dampened China's employment situation. After Q4 of 2008, urban registered unemployment rose above 9 million for the first time (reaching 9.15 million). According to continual monitoring of 513 enterprises in 15 cities, job losses were at a startling high of 8% on a cumulative basis from October 2008 to March 2009.5 After Q2 of 2009, urban employment stabilized and increased. From January to November 2009, urban employment growth reached 10.13 million people and is forecast to surpass 11 million people by the end of this year.6 In the first four years of the 11th Five-year Plan, employment growth will reach 46.1 million, higher than the expected target of 45 million set by the plan. <br/>¡¡¡¡China's urban registered unemployment rates reached 4.1%, 4% and 4.2%, respectively, in 2006, 2007 and 2008. After Q4 of 2008, urban registered unemployment rose 0.3 percentage points, reaching 4.3%,7 its highest level in five years. The unemployment rate is forecast at 4.3% for all of 2009.8 According to the forecast by the Ministry of Human Resources and Social Security, urban job creationand registered unemployment rates will be relatively stable with overall economic improvement. If so, the urban registered unemployment rate will be kept under the target of 5% set by the 11th Five-year Plan. <br/>¡¡¡¡We have not seen any statistics concerning the transfer of agricultural labor. <br/>¡¡¡¡ <br/>¡¡¡¡3. Price targets <br/>¡¡¡¡In the first three years of the 11th Five-year Plan period (2006, 2007 and 2008), China's consumer price index (CPI) increased by 1.5%, 4.8% and 5.9%, respectively. The figure was -0.9% from January to November 2009, and is forecast to reach 2.1% in 2010.9On the whole, the target of basic stability in overall price level set by the 11th Five-year Plan was reached. However, monthly CPI began to rise at a significant 4.4% in June 2007, and growth peaked at 8.7% in February 2008. In some regions, the CPI increase was well above 10% over many months. With a series of regulatory measures and economic slowdown afterward, monthly CPI growth declined and experienced negative growth in February 2009. The negative growth did not turn positive until November 2009. <br/> ¡¡¡¡ <br/>¡¡¡¡4. Balance of payments targets <br/>¡¡¡¡From 1990 to 2004, China's trade surplus (net exports) was below US$50 billion, and it began to surge in 2005 (see Figure 3). In the first three years of the 11th Five-year Plan period (2006, 2007 and 2008), China's trade surplus reached US$177.48 billion, US$261.83 billion and US$298.13 billion. An excessive trade surplus has become a problem for China's economic development. In 2009 and 2010, the trade surplus is forecast to be US$255 billion and US$287 billion.10It will take time to achieve the target of equilibrium in international balance of payments set by the 11th Five-year Plan. <br/>¡¡¡¡ <br/>¡¡¡¡III. Policy recommendations for economic targets of the 12th Five-year Plan <br/>¡¡¡¡ <br/>¡¡¡¡The GDP growth rate lies at the heart of all targets of macroeconomic control. We will focus on the economic growth targets of the 12th Five-year Plan. First, let us see the economic growth targets versus the results of four five-year plans from the Eighth to the 11th Five-year Plans (see Table 2). <br/>¡¡¡¡Eighth Five-year Plan period (1991-1995): growth target set at 6% and then adjusted to 8%-9%; actual result was 12.3%, higher by 3.3 percentage points to 4.3 percentage points than adjusted target. <br/>¡¡¡¡Ninth Five-year Plan period (1996-2000): growth target set at around 8%; actual result was 8.6%, higher than the target by 0.6 percentage points. <br/>¡¡¡¡Tenth Five-year Plan period (2001-2005): growth target set at around 7%; actual result was 9.6%, higher than the target by 2.6 percentage points. <br/>¡¡¡¡Eleventh Five-year Plan period (2006-2010): growth target set at around 7.5%; actual result is 10.3% so for, higher than the target by 2.7 percentage points. <br/>¡¡¡¡Except for the Ninth Five-year Plan, actual growth rates exceeded the targets during the other three five-year plans. There are three approaches to consider when decidinghow to set a growth target for the 12th Five-year Plan: <br/>¡¡¡¡The first approach is to set a low target value as before, as the 7.5% for the 11th Five-year Plan. This approach will leave room to guarantee accomplishment and avoid the single-minded pursuit of rapid growth, but the discrepancy with the actual result will make the target lose its meaning. <br/>¡¡¡¡The second approach is to set a range of targets, referred to as a ¡°moderate growth range with the benchmark of potential growth rates.¡± We suggest setting the growth target at 9% and the range between 8% and 10% (see Part IV for calculation and analysis). This approach will give certain flexibility against unexpected changes and leave proper room for macroeconomic control. In addition, a growth range will allow flexibility at the local levels. Some regions may grow faster than others and vice versa, but on the whole, they will stay within a range. In addition, a growth range of 8% to 10% may be closer to the reality of the 12th Five-year Plan, and thus makes the deviation smaller. <br/>¡¡¡¡The third approach is to set annual targets for the coming five years individually rather than creating a fixed target or a range of targets for a five-year period (see Part IV for calculation and analysis of annual target calculation). This approach will make growth targets dynamic and include considerations for near-term prospects and mid-term fluctuations. Moreover, this approach will make macrocontrol policies based on long-term development, continuity and stability. It allows targeted response and flexibility based on economic fluctuations. In addition, this is an established international practice. The U.S Economic Report of the President, for instance, provides multi-year (five to six years) target forecast values and was started in 1979. The World Bank's Global Development Finance usually provides a three-year forecast, and the IMF's World Economic Outlook provides a five-year forecast. <br/> ¡¡¡¡The U.S Economic Report of the President was established in the Employment Act of 1946. Since 1947, the Presidential Economic Advisory Committee has drafted an economic report to be endorsed by the president before being submitted to the Congress. The Report reviews the economic situation of the previous year, makes assessments on the short-term economic developments of current and following year, and explains primary economic targets and domestic and international economic policies. <br/>¡¡¡¡In 1978, the U.S. Congress revised the Employment Act of 1946 into the Full Employment and Balanced Growth Act. The amerded law requires the government to submit not only the current and following year's short-term economic targets in the report at the beginning of each year, but to propose future mid-term economic development targets as well. Since 1979, every Economic Report of the President has made economic development targets of the current and coming few years, and attached an economic target forecast sheet. Table 3 is one of those forecast sheets, released inJanuary 2009. This table lists annual economic forecast values for six years, from 2009 to 2014. There are eight economic indicators: (1) nominal GDP growth rate; (2) actual GDP growth rate; (3) GDP price index;(4) CPI; (5) unemployment rate; (6) interest rate (91-day treasury notes); (7) interest rate (10-year state bonds); and (8) employment in non-agricultural sectors. <br/>¡¡¡¡The second and third approaches can be used for actual economic operation of the 12th Five-year Plan period. <br/>¡¡¡¡ <br/>¡¡¡¡IV. Projection and analysis of growth targets for the 12th Five-year Plan <br/>¡¡¡¡ <br/>¡¡¡¡(I) Potential growth rate and measurement methods <br/>¡¡¡¡The above two policy recommendations should be based on potential growth rates. The actual economic situation during the 11th Five-year Plan period offered us two lessons: If actual growth rates are too high, such as above 11%, there may be serious inflation and intensive energy and material consumption as well as pollution; and if actual growth is too low, such as below 8% as in Q4 of 2008 and Q1 of 2009 when growth plummeted to 6.8% and 6.1%, employment pressures will pile up. One thing is for sure: Potential growth rates must be accurately assessed in conducting macroeconomic control to ensure stable and fast development. <br/>¡¡¡¡Potential economic rates refer to the growth rates achievable for an economy during a certain period of time when various resources are fully used without causing serious inflation.Potential growth rates suggest the mid- and long-term trend of economic growth during a certain period. The actual economic situation will swing around potential growth rates. If actual growth outstrips potential growth rates too much, there will be serious resource and environmental constraints and inflation. On the contrary, if actual growth rates are far lower than potential growth rates, there will be overcapacity, idle resources, unemployment and deflation. An appropriate level of growth rates should be maintained to avoid these problems, which can be referred to as a moderate growth range. An accurate assessment of economic growth rates is therefore an important basis for the correct analysis of the economic situation and the implementation of macrocontrol policies. However, this is easier said than done. Various assessment methods may lead to different results and must include considerations for changing conditions. Potential growth rates are not simply a mathematical problem, and they involve multiple factors. <br/> ¡¡¡¡Using statistics of years since China's reform and opening-up in 1978, we have employed the trend-filtering method, production function method and Philips Curve method to assess China's potential economic growth rates as a benchmark for the analysis of the 12th Five-year Plan period.12 <br/>¡¡¡¡ <br/>¡¡¡¡ (II) Measurement and analysis of the potential economic growth rate and moderate economic growth range <br/>¡¡¡¡1. Trend-filtering method <br/>¡¡¡¡Using existing economicgrowth statistics, the trend-filtering method separates long-term growth trends from short-term fluctuations. Long-term growth trends represent potential growth. We chose the most simple and commonly used HP filter and took the following steps of assessment: <br/>¡¡¡¡First, conduct HP filtering for GDP growth indices from 1978 to 2009 (1978 index is 100 and 2009 index takes the forecast value of 8.3%. Exponent value is 1798.85) to obtain trend term and volatility term.value is 6.25.13Then, conduct first-order difference for trend term to obtain the trend growth rate after HP filtering, as indicated by the bold curve in Figure 4. The trend growth rate after HP filtering is smoother than the actual growth rate and falls in the range from 8% to 12%. The annual increase in GDP trend growth after filtering is 9.86%, close to the annual GDP growth of 9.77% during the 31 years from 1979 to 2009 with a gap of only 0.09 percentage points. We may consider the range from 8% to 12% as the moderate growth range, with 9.8% as the median of potential economic growth rates since reform and opening-up in 1978. <br/>¡¡¡¡In the coming 12th Five-year Plan period, three factors should be taken into account: greater importance will be attached to growth efficiency and the transformation of the growth pattern and economic structure; energy and environmental resources will be increasingly limited; and external demand will continue to flag for some time. Therefore, for the 12th Five-year Plan period, the upper limit of the moderate growth range can be lowered by two percentage points to make the range between 8% and 10%. The medium line of potential growth rates can be drawn at 9%. When actual growth is above 10%, a moderately tight macrocontrol policy should be pursued; when actual growth is below 8%, a moderately expansive macrocontrol policy should be pursued; and when actual growth is between 8% and 10%, a neutral macrocontrol policy can be adopted. <br/>¡¡¡¡There are six justifications for defining the moderate growth range between 8% and 10% for the 12th Five-year Plan: (1) Institution: With constant reform and improvement of the socialist market economic system, various ownership forms have developed in tandem and provided institutional premise for moderate growth; (2) Resources: Thirty years of economic development since reform and opening-up have provided essential material conditions for moderate growth; (3) Industrialization and urbanization: Rapid industrialization and urbanization are a powerful source of domestic demand; (4) Consumption: Rising income levels and upgrade of consumption provide momentum to economic growth on the demand side;(5) Emerging industries and technology; (6) Regional factor: Adjustment and development of eastern, central and western regions in response to the global financial crisis provide broad geologic spaces for moderate growth. <br/> ¡¡¡¡2. Production function <br/>¡¡¡¡Using an aggregate production function to assess potentialgrowth rates, this method collects and assesses capital stock, employment population and human resources data. In terms of basic theoretical methods, the production function method is the most rigorous and makes use of the greatest amount of information. However, due to difficult data access and great differences in results using various methods, there will be a large gap in the calculated potential growth rates. Our assessment method is very close to that of Japan's central bank (BOJ, 2003). Assume the logarithm linear total production function of the following form: <br/>¡¡¡¡ <br/>¡¡¡¡ <br/>¡¡¡¡(1) <br/>¡¡¡¡Where,Y denotes actual GDP, K denotes actual capital input, L denotes actual labor input, T denotes TFP (Total Factor Productivity), anddenotes labor input share. Returns to scale are set to be constant, that is the sum of capital input and labor input share is 1. Then, assume the potential aggregate production function is of the same form: <br/>¡¡¡¡ <br/>¡¡¡¡ (2) <br/>¡¡¡¡*The constant marked by the asterisk is the potential level of corresponding variable. <br/>¡¡¡¡In equation (1), Y , K , L andare known constants and total factor productivity T can be obtained. In equation (2), K* and L* are known constants and can be substituted into the calculated T to obtain potential output Y*. The method is simple, and the key is to determine the known variables. <br/>¡¡¡¡In the calculation process, five variables and one parameter must be predefined, including Y, K , K*, L, L* and . It is more straightforward and easier to obtain Y data. According to the needs of assessment, actual GDP growth indices from 1978 to 2008 can be converted to the actual GDP sequence expressed in the prices of 1991 to obtain Y in equation (1). In the processing of data related to capital stock, employment population, human resources and labor input, we have referenced other research (Zhang Jun, Zhang Yuan, 2003; Lin Yifu, et al, 2003; Yue Ximing, 2005; Yue Ximing, Ren Ruo'en, 2008; Wang Xiaolu, et al, 2009; Guo Qingwang, Jia Junxue, 2004). This paper sets labor input share at 0.6. According to the above data and parameters, we obtained TFP using equation (1). It includes the contribution of factors other than labor and capital input, as well as some random disruptions and noises. Hence, HP filtering is employed to remove these factors to obtain a relatively smooth trend term. With the TFP index in 1991 at 100, parameter ¦Ë is set at 6.25 in filtering. Once trend TFP is obtained, equation (2) is employed to obtain potential output. First-order difference can be conducted for potential output to obtain the potential growth rate. The results are indicated in Figure 5. According to the calculations using the production function method, China' potential output during the past 30 years from 1979 to 2008 was growth of 9.98%, while actual growth during the same period was 9.82%, very close to the potential with a difference of only 0.16 percentage points. During this period, the range of potential growth rates wasroughly between 8% and 12%. Calculation results of the productionfunction method are similar to those of the above-mentionedtrend-filtering method. According to calculations results of theproduction function method, as policy recommendations for the 12thFive-year Plan and with various considerations of the above-mentionedtrend-filtering method, moderate growth range can be between 8% and10%. The median for potential growth rates can be 9%. <br/> ¡¡¡¡3. Philips Curve method <br/>¡¡¡¡The Philips Curve method is alsocalled the price adjustment method. It uses the replacement relationship between economic growth and inflation to determineeconomic growth rates under the condition of certain stable inflationrates calculated using a simple regression equation. The Philips Curvemethod has a certain theoretical basis, and data for the growth andinflation rates are easily obtainable. This makes it a commonly usedcalculation method. <br/>¡¡¡¡According to the Philips Curve equation,we first establish the relationship between the inflation rate (expressed by the CPI growth rate) and the GDP growth rate, and thenconduct regression using annual statistics from 1978 to 2009. Asvariables obtained after first-order difference, both should be stable.Results of a unit root test support this conclusion. In this way, theleast squares method (OLS) can be used for the regression with thefollowing results: <br/>¡¡¡¡CPI = 0.9925*CPI (-1) - 0.3721*CPI (-2)+ 0.9235*GDP - 6.8621 <br/>¡¡¡¡ (6.470) (-2.469) (3.342)(-2.219)<br/>¡¡¡¡R2=0.6723, adjusted R2=0.6330, DW=1.94 <br/>¡¡¡¡Where, forprice rise denoted by CPI, CPI(-1) denotes CPI growth rate of a one-phaselag, CPI(-2) denotes CPI growth rate of a two-phase lag, and GDP denotesthe growth of domestic gross product. Numbers in the brackets of theequation are t statistics. As for regression results, t statistics ofvariable factors are significant. R2 is 67.2%, adjusted R2 is 63.3%,and DW value is 1.94. Assessment results are satisfactory.<br/>¡¡¡¡This equation has the following economic implications: (1)The CPI growth rate is affected by its own phase. A change of one unitin the CPI growth rate of a one-phase lag can make the current phaseCPI growth rate change by one unit and current phase CPI growth ratechange by 0.62 units. (2) The CPI growth rate is affected by the GDPgrowth rate. A change of one unit of GDP growth rate will cause currentphase CPI growth rate to change by 0.9235 units. This reflects the consistency between the inflation rate change and GDP growth rate change.<br/>¡¡¡¡According to the formula, GDP growth rates under differentstable inflation levels can be calculated (see Table 5). Stablecondition means constant growth rates. Stable inflation means noincrease in the inflation rate. According to Table 5, when the stableinflation rate increases by one percentage point, GDP growth willaccelerate by 0.42 percentage points. According to common experiences,。