曼昆经济学原理第五版答案英文ch30
曼昆微观经济学课后练习英文答案完整版

曼昆微观经济学课后练习英文答案集团标准化办公室:[VV986T-J682P28-JP266L8-68PNN]the link between buyers’ willingness to pay for a good and the demandcurve.how to define and measure consumer surplus.the link between sellers’ costs of producing a good and the supply curve.how to define and measure producer surplus.that the equilibrium of supply and demand maximizes total surplus in amarket.CONTEXT AND PURPOSE:Chapter 7 is the first chapter in a three-chapter sequence on welfare economics and market efficiency. Chapter 7 employs the supply and demand model to develop consumer surplus and producer surplus as a measure of welfare and market efficiency. These concepts are then utilized in Chapters 8 and 9 to determine the winners and losers from taxation and restrictions on international trade.The purpose of Chapter 7 is to develop welfare economics—the study of how the allocation of resources affects economic well-being. Chapters 4 through 6 employed supply and demand in a positive framework, which focused on the question, “What is the equilibrium price and quantity in a market” This chapter now addresses the normative question, “Is the equilibrium price and quantity in a market the best possible solution to the resource allocation problem, or is it simply the price and quantity that balance supply and demand” Students will discover that under most circumstances the equilibrium price and quantity is also the one that maximizes welfare.KEY POINTS:Consumer surplus equals buyers’ willingness to pay for a good minus the amount they actually pay for it, and it measures the benefit buyers get from participating in a market. Consumer surplus can be computed by finding the area below the demand curve and above the price.Producer surplus equals the amount sellers receive for their goods minus their costs of production, and it measures the benefit sellers get from participating in a market. Producer surplus can be computed by finding the area below the price and above the supply curve.An allocation of resources that maximizes the sum of consumer and producer surplus is said to be efficient. Policymakers are often concerned with the efficiency, as well as the equality, of economic outcomes.The equilibrium of supply and demand maximizes the sum of consumer andproducer surplus. That is, the invisible hand of the marketplace leadsbuyers and sellers to allocate resources efficiently.Markets do not allocate resources efficiently in the presence of market failures such as market power or externalities.CHAPTER OUTLINE:I. Definition of welfare economics: the study of how the allocation of resources affects economic well-being.A. Willingness to Pay1. Definition of willingness to pay: the maximum amount that a buyer will pay for a good.2. Example: You are auctioning a mint-condition recording of Elvis Presley’s first album. Four buyers show up. Their willingness to pay is as follows:If the bidding goes to slightly higher than $80, all buyersdrop out except for John. Because John is willing to paymore than he has to for the album, he derives some benefitfrom participating in the market.3. Definition of consumer surplus: the amount a buyer is willing to payfor a good minus the amount the buyer actually pays for it.4. Note that if you had more than one copy of the album, the price in the auction would end up being lower (a little over $70 in the case of two albums) and both John and Paul would gain consumer surplus.B. Using the Demand Curve to Measure Consumer Surplus1. We can use the information on willingness to pay to derive a demandmarginal buyer . Because the demand curve shows the buyers’ willingness to pay, we can use the demand curve to measure c onsumer surplus.C. How a Lower Price Raises Consumer Surplussurplus because they are paying less for the product than before (area A on the graph).b. Because the price is now lower, some new buyers will enter the market and receive consumer surplus on these additional units of output purchased (area B on the graph).D. What Does Consumer Surplus Measure?1. Remember that consumer surplus is the difference between the amount that buyers are willing to pay for a good and the price that they actually pay.2. Thus, it measures the benefit that consumers receive from the good as the buyers themselves perceive it.III. Producer SurplusA. Cost and the Willingness to Sell1. Definition of cost: the value of everything a seller must give up to produce a good .2. Example: You want to hire someone to paint your house. You accept bidsfor the work from four sellers. Each painter is willing to work if the priceyou will pay exceeds her opportunity cost. (Note that this opportunity costthus represents willingness to sell.) The costs are:sellers will drop out except for Grandma. Because Grandma receives more than she would require to paint the house, she derives some benefit from producing in the market.4. Definition of producer surplus: the amount a seller is paid for a good minus the seller’s cost of providing it.5. Note that if you had more than one house to paint, the price in the auction would end up being higher (a little under $800 in the case of two houses) and both Grandma and Georgia would gain producer surplus.ALTERNATIVE CLASSROOM EXAMPLE:Review the material on price ceilings from Chapter 6. Redraw themarket for two-bedroom apartments in your town. Draw in a priceceiling below the equilibrium price.Then go through:consumer surplus before the price ceiling is put into place. consumer surplus after the price ceiling is put into place. You will need to take some time to explain the relationship between the producers’ willingness to sell and the cost of producing the good. The relationship between cost and the supply curve is not as apparent as the relationship between the It is important to stress that consumer surplus is measured inmonetary terms. Consumer surplus gives us a way to place amonetary cost on inefficient market outcomes (due to governmentB. Using the Supply Curve to Measure Producer Surplus1. We can use the information on cost (willingness to sell) to derive a2.the cost of the marginal seller. Because the supply curve shows the sellers’ cost (willingness to sell), we can use the supply curve to measure producer surplus.C. How a Higher Price Raises Producer Surplussurplus because they are receiving more for the product than before (area C on the graph).b. Because the price is now higher, some new sellers will enter the market and receive producer surplus on these additional units of output sold (area D on the graph).D. Producer surplus is used to measure the economic well-being of producers,ALTERNATIVE CLASSROOM EXAMPLE:Review the material on price floors from Chapter 6. Redraw the marketfor an agricultural product such as corn. Draw in a price supportabove the equilibrium price.Then go through:producer surplus before the price support is put in place.producer surplus after the price support is put in place.Make sure that you discuss the cost of the price support tomuch like consumer surplus is used to measure the economic well-being of consumers.IV. Market EfficiencyA. The Benevolent Social Planner1. The economic well-being of everyone in society can be measured by total surplus, which is the sum of consumer surplus and producer surplus:Total Surplus = Consumer Surplus + Producer SurplusTotal Surplus = (Value to Buyers – Amount Paid byBuyers) +(Amount Received by Sellers – Cost to Sellers)Because the Amount Paid by Buyers = Amount Received bySellers:2. Definition of efficiency: the property of a resource allocation of maximizing the total surplus received by all members of society .3. Definition of equality: the property of distributing economicprosperity uniformly the members of society .a. Buyers who value the product more than the equilibrium price will purchase the product; those who do not, will not purchase the product. Inother words, the free market allocates the supply of a good to the buyers who value it most highly, as measured by their willingness to pay.b. Sellers whose costs are lower than the equilibrium price will produce the product; those whose costs are higher, will not produce the product. Inother words, the free market allocates the demand for goods to the sellers who can produce it at the lowest cost.value of the product to the marginal buyer is greater than the cost to the marginal seller so total surplus would rise if output increases.Pretty Woman, Chapter 6. Vivien (Julia Roberts) and Edward(Richard Gere) negotiate a price. Afterward, Vivien reveals shewould have accepted a lower price, while Edward admits he wouldhave paid more. If you have done a good job of introducingconsumer and producer surplus, you will see the light bulbs gob. At any quantity of output greater than the equilibrium quantity, the value of the product to the marginal buyer is less than the cost to the marginal seller so total surplus would rise if output decreases.3. Note that this is one of the reasons that economists believe Principle #6: Markets are usually a good way to organize economic activity.C. In the News: Ticket Scalping1. Ticket scalping is an example of how markets work to achieve anefficient outcome.2. This article from The Boston Globe describes economist Chip Case’sexperience with ticket scalping.D. Case Study: Should There Be a Market in Organs?1. As a matter of public policy, people are not allowed to sell their organs.a. In essence, this means that there is a price ceiling on organs of $0.b. This has led to a shortage of organs.2. The creation of a market for organs would lead to a more efficientallocation of resources, but critics worry about the equity of a market system for organs.V. Market Efficiency and Market FailureA. To conclude that markets are efficient, we made several assumptions about how markets worked.1. Perfectly competitive markets.2. No externalities.B. When these assumptions do not hold, the market equilibrium may not be efficient.C. When markets fail, public policy can potentially remedy the situation. SOLUTIONS TO TEXT PROBLEMS:Quick Quizzes1. Figure 1 shows the demand curve for turkey. The price of turkey is P 1and the consumer surplus that results from that price is denoted CS. Consumer surplus is the amount a buyer is willing to pay for a good minus the amount the buyer actually pays for it. It measures the benefit to buyers ofparticipating in a market.Figure 1 Figure 22. Figure 2 shows the supply curve for turkey. The price of turkey is P 1and the producer surplus that results from that price is denoted PS. Producer surplus is the amount sellers are paid for a good minus the sellers’ cost of providing it (measured by the supply curve). It measures the benefit to sellers of participating in a market.It would be a good idea to remind students that there are circumstances when the market process does not lead to the most efficient outcome. Examples include situations such as when a firm (or buyer) has market power over price or when there areFigure 33. Figure 3 shows the supply and demand for turkey. The price of turkey is P, consumer surplus is CS, and producer surplus is PS. Producing more turkeys 1than the equilibrium quantity would lower total surplus because the value to the marginal buyer would be lower than the cost to the marginal seller on those additional units.Questions for Review1. The price a buyer is willing to pay, consumer surplus, and the demand curve are all closely related. The height of the demand curve represents the willingness to pay of the buyers. Consumer surplus is the area below the demand curve and above the price, which equals the price that each buyer is willing to pay minus the price actually paid.2. Sellers' costs, producer surplus, and the supply curve are all closely related. The height of the supply curve represents the costs of the sellers. Producer surplus is the area below the price and above the supply curve, which equals the price received minus each seller's costs of producing the good.Figure 43. Figure 4 shows producer and consumer surplus in a supply-and-demand diagram.4. An allocation of resources is efficient if it maximizes total surplus, the sum of consumer surplus and producer surplus. But efficiency may not be the only goal of economic policymakers; they may also be concerned about equitythe fairness of the distribution of well-being.5. The invisible hand of the marketplace guides the self-interest of buyers and sellers into promoting general economic well-being. Despite decentralized decision making and self-interested decision makers, free markets often lead to an efficient outcome.6. Two types of market failure are market power and externalities. Market power may cause market outcomes to be inefficient because firms may cause price and quantity to differ from the levels they would be under perfect competition, which keeps total surplus from being maximized. Externalities are side effects that are not taken into account by buyers and sellers. As a result, the free market does not maximize total surplus.Problems and Applications1. a. Consumer surplus is equal to willingness to pay minus the price paid. Therefore, Melissa’s willingness to pay must be $200 ($120 + $80).b. Her consumer surplus at a price of $90 would be $200 $90 = $110.c. If the price of an iPod was $250, Melissa would not have purchased one because the price is greater than her willingness to pay. Therefore, she would receive no consumer surplus.2. If an early freeze in California sours the lemon crop, the supply curve for lemons shifts to the left, as shown in Figure 5. The result is a rise in the price of lemons and a decline in consumer surplus from A + B + C to just A. So consumer surplus declines by the amount B + C.Figure 5 Figure 6In the market for lemonade, the higher cost of lemons reduces the supply of lemonade, as shown in Figure 6. The result is a rise in the price of lemonade and a decline in consumer surplus from D + E + F to just D, a loss of E + F. Note that an event that affects consumer surplus in one market oftenhas effects on consumer surplus in other markets.3. A rise in the demand for French bread leads to an increase in producer surplus in the market for French bread, as shown in Figure 7. The shift of the demand curve leads to an increased price, which increases producer surplusfrom area A to area A + B + C.Figure 7The increased quantity of French bread being sold increases the demandfor flour, as shown in Figure 8. As a result, the price of flour rises, increasing producer surplus from area D to D + E + F. Note that an event that affects producer surplus in one market leads to effects on producer surplus in related markets.Figure 84. a.Figure 9b. When the price of a bottle of water is $4, Bert buys two bottles of water. His consumer surplus is shown as area A in the figure. He values hisfirst bottle of water at $7, but pays only $4 for it, so has consumer surplus of $3. He values his second bottle of water at $5, but pays only $4 for it, so has consumer surplus of $1. Thus Bert’s total consumer surplus is $3 + $1 = $4, which is the area of A in the figure.c. When the price of a bottle of water falls from $4 to $2, Bert buys three bottles of water, an increase of one. His consumer surplus consists of both areas A and B in the figure, an increase in the amount of area B. He gets consumer surplus of $5 from the first bottle ($7 value minus $2 price), $3from the second bottle ($5 value minus $2 price), and $1 from the third bottle ($3 value minus $2 price), for a total consumer surplus of $9. Thus consumer surplus rises by $5 (which is the size of area B) when the price of a bottle of water falls from $4 to $2.5. a.Figure 10b. When the price of a bottle of water is $4, Ernie sells two bottles of water. His producer surplus is shown as area A in the figure. He receives $4 for his first bottle of water, but it costs only $1 to produce, so Ernie has producer surplus of $3. He also receives $4 for his second bottle of water, which costs $3 to produce, so he has producer surplus of $1. Thus Ernie’s total producer surplus is $3 + $1 = $4, which is the area of A in the figure.c. When the price of a bottle of water rises from $4 to $6, Ernie sells three bottles of water, an increase of one. His producer surplus consists of both areas A and B in the figure, an increase by the amount of area B. He gets producer surplus of $5 from the first bottle ($6 price minus $1 cost), $3 from the second bottle ($6 price minus $3 cost), and $1 from the third bottle ($6 price minus $5 price), for a total producer surplus of $9. Thus producer surplus rises by $5 (which is the size of area B) when the price of a bottle of water rises from $4 to $6.6. a. From Ernie’s supply schedule and Bert’s demand schedule, thean equilibrium quantity of two.b. At a price of $4, consumer surplus is $4 and producer surplus is $4, as shown in Problems 3 and 4 above. Total surplus is $4 + $4 = $8.c. If Ernie produced one less bottle, his producer surplus would decline to $3, as shown in Problem 4 above. If Bert consumed one less bottle, hisconsumer surplus would decline to $3, as shown in Problem 3 above. So total surplus would decline to $3 + $3 = $6.d. If Ernie produced one additional bottle of water, his cost would be $5, but the price is only $4, so his producer surplus would decline by $1. If Bert consumed one additional bottle of water, his value would be $3, but the price is $4, so his consumer surplus would decline by $1. So total surplus declines by $1 + $1 = $2.7. a. The effect of falling production costs in the market for stereos results in a shift to the right in the supply curve, as shown in Figure 11. As a result, the equilibrium price of stereos declines and the equilibriumquantity increases.Figure 11b. The decline in the price of stereos increases consumer surplus from area A to A + B + C + D, an increase in the amount B + C + D. Prior to the shift in supply, producer surplus was areas B + E (the area above the supply curve and below the price). After the shift in supply, producer surplus is areas E + F + G. So producer surplus changes by the amount F + G – B, which may be positive or negative. The increase in quantity increases producer surplus, while the decline in the price reduces producer surplus. Because consumer surplus rises by B + C + D and producer surplus rises by F + G – B, total surplus rises by C + D + F + G.c. If the supply of stereos is very elastic, then the shift of the supply curve benefits consumers most. To take the most dramatic case, suppose the supply curve were horizontal, as shown in Figure 12. Then there is no producer surplus at all. Consumers capture all the benefits of falling production costs, with consumer surplus rising from area A to area A + B.Figure 128. Figure 13 shows supply and demand curves for haircuts. Supply equals demand at a quantity of three haircuts and a price between $4 and $5. Firms A, C, and D should cut the hair of Ellen, Jerry, and Phil. Oprah’s willingnessto pay is too low and firm B’s costs are too high, so they do not participate. The maximum total surplus is the area between the demand and supply curves, which totals $11 ($8 value minus $2 cost for the first haircut, plus $7 value minus $3 cost for the second, plus $5 value minus $4 cost for the third).Figure 139. a. The effect of falling production costs in the market for computers results in a shift to the right in the supply curve, as shown in Figure 14. As a result, the equilibrium price of computers declines and the equilibrium quantity increases. The decline in the price of computers increases consumer surplus from area A to A + B + C + D, an increase in the amount B + C + D.Figure 14 Figure 15Prior to the shift in supply, producer surplus was areas B + E(the area above the supply curve and below the price). After theshift in supply, producer surplus is areas E + F + G. So producersurplus changes by the amount F + G – B, which may be positive ornegative. The increase in quantity increases producer surplus,while the decline in the price reduces producer surplus. Becauseconsumer surplus rises by B + C + D and producer surplus rises byF +G – B, total surplus rises by C + D + F + G.b. Because typewriters are substitutes for computers, the decline in the price of computers means that people substitute computers for typewriters, shifting the demand for typewriters to the left, as shown in Figure 15. The result is a decline in both the equilibrium price and equilibrium quantity of typewriters. Consumer surplus in the typewriter market changes from area A + B to A + C, a net change of C – B. Producer surplus changes from area C + D + E to area E, a net loss of C + D. Typewriter producers are sad about technological advances in computers because their producer surplus declines.c. Because software and computers are complements, the decline in the price and increase in the quantity of computers means that the demand for software increases, shifting the demand for software to the right, as shown in Figure 16. The result is an increase in both the price and quantity of software. Consumer surplus in the software market changes from B + C to A + B, a net change of A – C. Producer surplus changes from E to C + D + E, an increase of C + D, so software producers should be happy about the technological progress in computers.Figure 16d. Yes, this analysis helps explain why Bill Gates is one the world’s richest people, because his company produces a lot of software that is a complement with computers and there has been tremendous technological advance in computers.10. a. With Provider A, the cost of an extra minute is $0. WithProvider B, the cost of an extra minute is $1.b. With Provider A, my friend will purchase 150 minutes [= 150 –(50)(0)]. With Provider B, my friend would purchase 100 minutes [=150 – (50)(1)].c. With Provider A, he would pay $120. The cost would be $100 with Provider B.Figure 17d. Figure 17 shows the friend’s demand. With Provider A, he buys 150minutes and his consumer surplus is equal to (1/2)(3)(150) – 120= 105. With Provider B, his consumer surplus is equal to(1/2)(2)(100) = 100.e. I would recommend Provider A because he receives greater consumer surplus.11. a. Figure 18 illustrates the demand for medical care. If each procedure has a price of $100, quantity demanded will be Q1 procedures.Figure 18b. If consumers pay only $20 per procedure, the quantity demanded will be Qprocedures. Because the cost to society is $100, the number of procedures 2performed is too large to maximize total surplus. The quantity that maximizes total surplus is Q1 procedures, which is less than Q2.c. The use of medical care is excessive in the sense that consumers get procedures whose value is less than the cost of producing them. As a result, the economy’s total surplus is reduced.d. To prevent this excessive use, the consumer must bear the marginal cost of the procedure. But this would require eliminating insurance. Another possibility would be that the insurance company, which pays most of the marginal cost of the procedure ($80, in this case) could decide whether the procedure should be performed. But the insurance company does not get the benefits of the procedure, so its decisions may not reflect the value to the consumer.。
曼昆经济学原理英文版答案
曼昆经济学原理英文版答案As the creator of the Baidu Wenku document "Principles of Economics by Mankiw (English Version) Answers", I would like to provide a comprehensive guide to the solutions of the questions in the book. This document aims to help students better understand the principles of economics and improve their problem-solving abilities.Chapter 1: Ten Principles of Economics。
1. People face trade-offs.2. The cost of something is what you give up to get it.3. Rational people think at the margin.4. People respond to incentives.5. Trade can make everyone better off.6. Markets are usually a good way to organize economic activity.7. Governments can sometimes improve economic outcomes.8. The standard of living depends on a country's production.9. Prices rise when the government prints too much money.10. Society faces a short-run trade-off between inflation and unemployment.Chapter 2: Thinking Like an Economist。
曼昆经济学原理英文版文案加习题答案5章elasticityanditsapplication
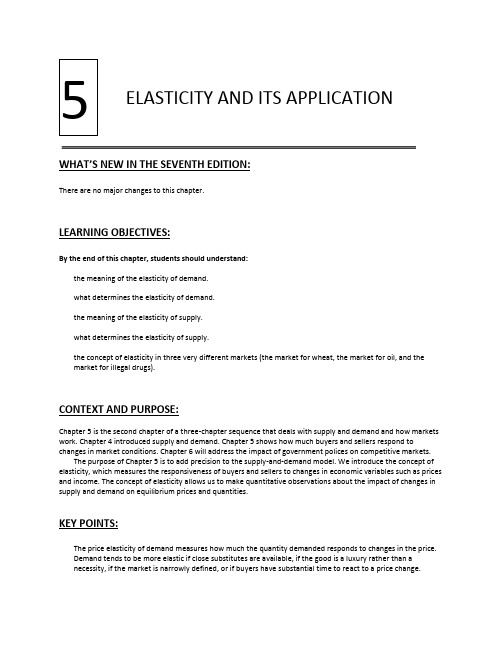
ELASTICITY AND ITS APPLICATIONWHAT’S NEW IN THE S EVENTH EDITION:There are no major changes to this chapter.LEARNING OBJECTIVES:By the end of this chapter, students should understand:the meaning of the elasticity of demand.what determines the elasticity of demand.the meaning of the elasticity of supply.what determines the elasticity of supply.the concept of elasticity in three very different markets (the market for wheat, the market for oil, and the market for illegal drugs).CONTEXT AND PURPOSE:Chapter 5 is the second chapter of a three-chapter sequence that deals with supply and demand and how markets work. Chapter 4 introduced supply and demand. Chapter 5 shows how much buyers and sellers respond to changes in market conditions. Chapter 6 will address the impact of government polices on competitive markets.The purpose of Chapter 5 is to add precision to the supply-and-demand model. We introduce the concept of elasticity, which measures the responsiveness of buyers and sellers to changes in economic variables such as prices and income. The concept of elasticity allows us to make quantitative observations about the impact of changes in supply and demand on equilibrium prices and quantities.KEY POINTS:The price elasticity of demand measures how much the quantity demanded responds to changes in the price.Demand tends to be more elastic if close substitutes are available, if the good is a luxury rather than anecessity, if the market is narrowly defined, or if buyers have substantial time to react to a price change.The price elasticity of demand is calculated as the percentage change in quantity demanded divided by the percentage change in price. If quantity demanded moves proportionately less than the price, then theelasticity is less than one, and demand is said to be inelastic. If quantity demanded moves proportionately more than the price, then the elasticity is greater than one, and demand is said to be elastic.Total revenue, the total amount paid for a good, equals the price of the good times the quantity sold. For inelastic demand curves, total revenue moves in the same direction as the price. For elastic demand curves, total revenue moves in the opposite direction as the price.The income elasticity of demand measures how much the quantity demanded responds to changes inconsumers’ income. The cross-price elasticity of demand measures how much the quantity demanded of one good responds to the price of another good.The price elasticity of supply measures how much the quantity supplied responds to changes in the price. This elasticity often depends on the time horizon under consideration. In most markets, supply is more elastic in the long run than in the short run.The price elasticity of supply is calculated as the percentage change in quantity supplied divided by thepercentage change in price. If quantity supplied moves proportionately less than the price, then the elasticity is less than one, and supply is said to be inelastic. If quantity supplied moves proportionately more than the price, then the elasticity is greater than one, and supply is said to be elastic.The tools of supply and demand can be applied in many different kinds of markets. This chapter uses them to analyze the market for wheat, the market for oil, and the market for illegal drugs.CHAPTER OUTLINE:I. The Elasticity of DemandA. Definition of elasticity: a measure of the responsiveness of quantity demanded or quantity supplied toone of its determinants.B. The Price Elasticity of Demand and Its Determinants1. Definition of price elasticity of demand: a measure of how much the quantity demanded of a goodresponds to a change in the price of that good, computed as the percentage change in quantitydemanded divided by the percentage change in price.2. Determinants of the Price Elasticity of Demanda. Availability of Close Substitutes: the more substitutes a good has, the more elastic its demand.b. Necessities versus Luxuries: necessities are more price inelastic.c. Definition of the market: narrowly defined markets (ice cream) have more elastic demand thanbroadly defined markets (food).d. Time Horizon: goods tend to have more elastic demand over longer time horizons.C. Computing the Price Elasticity of Demand1. Formula2. Example: the price of ice cream rises by 10% and quantity demanded falls by 20%.Price elasticity of demand = (20%)/(10%) = 23. Because there is an inverse relationship between price and quantity demanded (the price of icecream rose by 10% and the quantity demanded fell by 20%), the price elasticity of demand issometimes reported as a negative number. We will ignore the minus sign and concentrate on theabsolute value of the elasticity.D. The Midpoint Method: A Better Way to Calculate Percentage Changes and Elasticities1. Because we use percentage changes in calculating the price elasticity of demand, the elasticitycalculated by going from one point to another on a demand curve will be different from an elasticity calculated by going from the second point to the first. This difference arises because the percentage changes are calculated using a different base.a. A way around this problem is to use the midpoint method.b. Using the midpoint method involves calculating the percentage change in either price or quantitydemanded by dividing the change in the variable by the midpoint between the initial and finallevels rather than by the initial level itself.c. Example: the price rises from $4 to $6 and quantity demanded falls from 120 to 80.% change in price = (6 4)/5 × 100 = 40%% change in quantity demanded = (120 80)/100 x 100 = 40%price elasticity of demand = 40/40 = 1E. The Variety of Demand Curves1. Classification of Elasticitya. When the price elasticity of demand is greater than one, demand is defined to be elastic.b. When the price elasticity of demand is less than one, the demand is defined to be inelastic.c. When the price elasticity of demand is equal to one, the demand is said to have unit elasticity.2. In general, the flatter the demand curve that passes through a given point, the more elastic thedemand.3. Extreme Casesa. When the price elasticity of demand is equal to zero, the demand is perfectly inelastic and is avertical line.b. When the price elasticity of demand is infinite, the demand is perfectly elastic and is a horizontalline.4. FYI: A Few Elasticities from the Real WorldF. Total Revenue and the Price Elasticity of Demand1. Definition of total revenue: the amount paid by buyers and received by sellers of a good, computedas the price of the good times the quantity sold.2. If demand is inelastic, the percentage change in price will be greater than the percentage change inquantity demanded.a. If price rises, quantity demanded falls, and total revenue will rise (because the increase in pricewill be larger than the decrease in quantity demanded).b. If price falls, quantity demanded rises, and total revenue will fall (because the fall in price will belarger than the increase in quantity demanded).3. If demand is elastic, the percentage change in quantity demanded will be greater than thepercentage change in price.a. If price rises, quantity demanded falls, and total revenue will fall (because the increase in pricewill be smaller than the decrease in quantity demanded).b. If price falls, quantity demanded rises, and total revenue will rise (because the fall in price will besmaller than the increase in quantity demanded).4. If demand is unit elastic, the percentage change in price will be equal to the percentage change inquantity demanded.a. If price rises, quantity demanded falls, and total revenue will remain the same (because theincrease in price will be equal to the decrease in quantity demanded).b. If price falls, quantity demanded rises, and total revenue will remain the same (because the fall inprice will be equal to the increase in quantity demanded).G. Elasticity and Total Revenue along a Linear Demand Curve1. The slope of a linear demand curve is constant, but the elasticity is not.a. At points with a low price and a high quantity demanded, demand is inelastic.b. At points with a high price and a low quantity demanded, demand is elastic.2. Total revenue also varies at each point along the demand curve.H. Other Demand Elasticities1. Definition of income elasticity of demand: a measure of how much the quantity demanded of agood responds to a change in consumers’ income, computed as the percentage change in quantity demanded divided by the percentage change in income.a. Formulab. Normal goods have positive income elasticities, while inferior goods have negative incomeelasticities.Figure 4Note that when demand is elastic and price falls, total revenue rises. Also point out that once demand is inelastic, any further decrease in price results in a decrease in total revenue.% change in quantity demandedIncome elasticity of demand =% change in incomeALTERNATIVE CLASSROOM EXAMPLE:John’s income rises from $20,000 to $22,000 an d the quantity of hamburger he buys each week fallsfrom 2 pounds to 1 pound.% change in quantity demanded = (12)/ x 100 = %% change in income = (22,000 20,000)/21,000 x 100 = %income elasticity = %/% =Point out that hamburger is an inferior good for John.c. Necessities tend to have small income elasticities, while luxuries tend to have large incomeelasticities.2. Definition of cross-price elasticity of demand: a measure of how much the quantity demanded ofone good responds to a change in the price of another good, computed as the percentage change inthe quantity demanded of the first good divided by the percentage change in the price of thesecond good.a. Formulab. Substitutes have positive cross-price elasticities, while complements have negative cross-priceelasticities.ALTERNATIVE CLASSROOM EXAMPLE:The price of apples rises from $ per pound to $ per pound. As a result, the quantity of orangesdemanded rises from 8,000 per week to 9,500.% change in quantity of oranges demanded = (9,500 8,000)/8,750 x 100 = %% change in price of apples = / x 100 = 40%cross-price elasticity = %/40% =Because the cross-price elasticity is positive, the two goods are substitutes.II. The Elasticity of SupplyA. The Price Elasticity of Supply and Its Determinants1. Definition of price elasticity of supply: a measure of how much the quantity supplied of a goodresponds to a change in the price of that good, computed as the percentage change in quantitysupplied divided by the percentage change in price.2. Determinants of the Price Elasticity of Supplya. Flexibility of sellers: goods that are somewhat fixed in supply (beachfront property) have inelasticsupplies.b. Time horizon: supply is usually more inelastic in the short run than in the long run.B. Computing the Price Elasticity of Supply1. Formula2. Example: the price of milk increases from $ per gallon to $ per gallon and the quantity supplied risesfrom 9,000 to 11,000 gallons per month.% change in price = –/ × 100 = 10% % change in quantity supplied = (11,000 – 9,000)/10,000 × 100 = 20% Price elasticity of supply = (20%)/(10%) = 2C. The Variety of Supply Curves 1. In general, the flatter the supply curve that passes through a given point, the more elastic the supply.2. Extreme Casesa. When the elasticity is equal to zero, the supply is said to be perfectly inelastic and is a verticalline.b. When the elasticity is infinite, the supply is said to be perfectly elastic and is a horizontal line.3. Because firms often have a maximum capacity for production, the elasticity of supply may be veryhigh at low levels of quantity supplied and very low at high levels of quantity supplied.III. Three Applications of Supply, Demand, and ElasticityA. Can Good News for Farming Be Bad News for Farmers1. A new hybrid of wheat is developed that is more productive than those used in the past. Whathappens2. Supply increases, price falls, and quantity demanded rises.3. If demand is inelastic, the fall in price is greater than the increase in quantity demanded and totalrevenue falls.4. If demand is elastic, the fall in price is smaller than the rise in quantity demanded and total revenuerises.5. In practice, the demand for basic foodstuffs (like wheat) is usually inelastic.a. This means less revenue for farmers.b. Because farmers are price takers, they still have the incentive to adopt the new hybrid so thatthey can produce and sell more wheat.c. This may help explain why the number of farms has declined so dramatically over the past twocenturies.d. This may also explain why some government policies encourage farmers to decrease the amountof crops planted.B. Why Did OPEC Fail to Keep the Price of Oil HighFigure 8Short Run Long Run1. In the 1970s and 1980s, OPEC reduced the amount of oil it was willing to supply to world markets.The decrease in supply led to an increase in the price of oil and a decrease in quantity demanded. The increase in price was much larger in the short run than the long run. Why2. The demand and supply of oil are much more inelastic in the short run than the long run. The demandis more elastic in the long run because consumers can adjust to the higher price of oil by carpoolingor buying a vehicle that gets better mileage. The supply is more elastic in the long run because non-OPEC producers will respond to the higher price of oil by producing more.C. Does Drug Interdiction Increase or Decrease Drug-Related Crime1. The federal government increases the number of federal agents devoted to the war on drugs. Whathappensa. The supply of drugs decreases, which raises the price and leads to a reduction in quantitydemanded. If demand is inelastic, total expenditure on drugs (equal to total revenue) willincrease. If demand is elastic, total expenditure will fall.b. Thus, because the demand for drugs is likely to be inelastic, drug-related crime may rise.2. What happens if the government instead pursued a policy of drug educationa. The demand for drugs decreases, which lowers price and quantity supplied. Total expendituremust fall (because both price and quantity fall).b. Thus, drug education should not increase drug-related crime.SOLUTIONS TO TEXT PROBLEMS:Quick Quizzes1. The price elasticity of demand is a measure of how much the quantity demanded of a good respondsto a change in the price of that good, computed as the percentage change in quantity demanded divided by the percentage change in price.When demand is inelastic (a price elasticity less than 1), a price increase raises total revenue, and aprice decrease reduces total revenue. When demand is elastic (a price elasticity greater than 1), a price increase reduces total revenue, and a price decrease increases total revenue. When demand is unit elastic (a price elasticity equal to 1), a change in price does not affect total revenue.2. The price elasticity of supply is a measure of how much the quantity supplied of a good responds to achange in the price of that good, computed as the percentage change in quantity supplied divided by the percentage change in price.The price elasticity of supply might be different in the long run than in the short run because overshort periods of time, firms cannot easily change the sizes of their factories to make more or less of a good. Thus, in the short run, the quantity supplied is not very responsive to the price. However, over longer periods, firms can build new factories, expand existing factories, close old factories, or they can enter or exit a market. So, in the long run, the quantity supplied can respond substantially to a change in price.3. A drought that destroys half of all farm crops could be good for farmers (at least those unaffected bythe drought) if the demand for the crops is inelastic. The shift to the left of the supply curve leads to a price increase that will raise total revenue if the price elasticity of demand is less than 1.No one farmer would have an incentive to destroy her crops in the absence of a drought because shetakes the market price as given. Only if all farmers destroyed a portion of their crops together, for example through a government program, would this plan work to make farmers better off.Questions for ReviewFigure 9(a) Drug Interdiction (b) Drug Education1. The price elasticity of demand measures how much quantity demanded responds to a change in price.The income elasticity of demand measures how much quantity demanded responds to changes in consumers' income.2. The determinants of the price elasticity of demand include the availability of close substitutes,whether the good is a necessity or a luxury, the breadth of the definition of the market, and the time horizon. Goods with close substitutes have greater elasticities, luxury goods have greater priceelasticities than necessities, goods in more narrowly defined markets have greater elasticities, and the elasticity of demand is greater the longer the time horizon.3. An elasticity greater than one means that demand is elastic. When the elasticity is greater than one,the percentage change in quantity demanded exceeds the percentage change in price. When the elasticity equals zero, demand is perfectly inelastic. There is no change in quantity demanded when there is a change in price.4. Figure 1 presents a supply-and-demand diagram, showing the equilibrium price, P, the equilibriumquantity, Q, and the total revenue received by producers. Total revenue equals the equilibrium price times the equilibrium quantity, which is the area of the rectangle shown in the figure.Figure 15. If demand is elastic, an increase in price reduces total revenue. With elastic demand, the quantitydemanded falls by a greater percentage than the price rises. As a result, total revenue moves in the opposite direction as the price. Thus, if price rises, total revenue falls.6. A good with income elasticity less than zero is called an inferior good because as income rises, thequantity demanded declines.7. The price elasticity of supply is calculated as the percentage change in quantity supplied divided bythe percentage change in price. It measures how much quantity supplied responds to changes in price.8. If a fixed quantity of a good is available and no more can be made, the price elasticity of supply is zero.Regardless of the percentage change in price, there will be no change in the quantity supplied.9. Destruction of half of the fava bean crop is more likely to hurt fava bean farmers if the demand forfava beans is very elastic. Destruction of half of the crop causes the supply curve to shift to the leftresulting in a higher price of fava beans. When demand is very elastic, an increase in price leads to adecrease in total revenue because the decrease in quantity demanded outweighs the increase inprice.Quick Check Multiple Choice1. a2. b3. d4. c5. a6. cProblems and Applications1. a. Mystery novels have more elastic demand than required textbooks because mystery novels haveclose substitutes and are a luxury good, while required textbooks are a necessity with no closesubstitutes. If the price of mystery novels were to rise, readers could substitute other types ofnovels, or buy fewer novels altogether. But if the price of required textbooks were to rise,students would have little choice but to pay the higher price. Thus, the quantity demanded ofrequired textbooks is less responsive to price than the quantity demanded of mystery novels.b. Beethoven recordings have more elastic demand than classical music recordings in general.Beethoven recordings are a narrower market than classical music recordings, so it is easier tofind close substitutes for them. If the price of Beethoven recordings were to rise, people couldsubstitute other classical recordings, like Mozart. But if the price of all classical recordings wereto rise, substitution would be more difficult. (A transition from classical music to rap is unlikely!)Thus, the quantity demanded of classical recordings is less responsive to price than the quantitydemanded of Beethoven recordings.c. Subway rides during the next five years have more elastic demand than subway rides during thenext six months. Goods have a more elastic demand over longer time horizons. If the fare for asubway ride was to rise temporarily, consumers could not switch to other forms oftransportation without great expense or great inconvenience. But if the fare for a subway ridewas to remain high for a long time, people would gradually switch to alternative forms oftransportation. As a result, the quantity demanded of subway rides during the next six monthswill be less responsive to changes in the price than the quantity demanded of subway ridesduring the next five years.d. Root beer has more elastic demand than water. Root beer is a luxury with close substitutes,while water is a necessity with no close substitutes. If the price of water were to rise, consumershave little choice but to pay the higher price. But if the price of root beer were to rise, consumerscould easily switch to other sodas or beverages. So the quantity demanded of root beer is moreresponsive to changes in price than the quantity demanded of water.2. a. For business travelers, the price elasticity of demand when the price of tickets rises from $200 to$250 is [(2,000 – 1,900)/1,950]/[(250 – 200)/225] = = . For vacationers, the price elasticity ofdemand when the price of tickets rises from $200 to $250 is [(800 – 600)/700] / [(250 – 200)/225]= = .b. The price elasticity of demand for vacationers is higher than the elasticity for business travelersbecause vacationers can choose a substitute more easily than business travelers. For example,vacationers can choose a different mode of transportation (like driving or taking the train), adifferent destination, a different departure date, and a different return date. They may alsochoose to not travel at all. Business travelers are less likely to do so because their schedules are less adaptable.3. a. The percentage change in price is equal to – / x 100 = 20%. If the price elasticity of demand is ,quantity demanded will fall by 4% in the short run []. If the price elasticity of demand is , quantity demanded will fall by 14% in the long run [ ].b. Over time, consumers can make adjustments to their homes by purchasing alternative heatsources such as natural gas or electric furnaces. Thus, they can respond more easily to thechange in the price of heating oil in the long run than in the short run.4. If quantity demanded fell, price must have increased according to the law of demand. For a priceincrease to increase total revenue, the percentage increase in the price must be greater than the percentage decline in quantity demanded. Therefore, demand is inelastic.5. , a. The effect on the market for coffee beans is shown in Figure 2. When a hurricane destroys halfof the crop, the supply of coffee beans decreases, the price of coffee beans increases, and thequantity decreases.b. The effect on the market for cups of coffee is shown in Figure 2. When the price of coffee beans,an important input into the production of a cup of coffee, increases, the supply of cups of coffee decreases, the price of a cup of coffee increases, and the quantity decreases.Because cups of coffee have an inelastic demand, when the price of a cup of coffee increases, thetotal expenditure on coffee increases.c. The effect on the market for donuts is shown in Figure 3. When the price of coffee increases andthe quantity demanded of coffee decreases, consumers demand fewer donuts because coffee and donuts are complements. When demand decreases, the price of donuts decreases.Because donuts have an inelastic demand, when the price of donuts decreases, the totalexpenditure on donuts decreases.Price Figure 2 Price SupplyFigure 36. a. If your income is $10,000, your price elasticity of demand as the price of DVDs rises from $8 to$10 is [(40 – 32)/36]/[(10 – 8)/9] = = 1. If your income is $12,000, the elasticity is [(50 – 45)/]/[(10– 8)/9] = = .b. If the price is $12, your income elasticity of demand as your income increases from $10,000 to$12,000 is [(30 – 24)/27]/[(12,000 – 10,000)/11,000] = = . If the price is $16, your incomeelasticity of demand as your income increases from $10,000 to $12,000 is [(12 – 8)/10]/[(12,000– 10,000)/11,000] = = .7. a. If Maria always spends one-third of her income on clothing, then her income elasticity of clothingdemand is one, because maintaining her clothing expenditures as a constant fraction of herincome means the percentage change in her quantity of clothing must equal her percentagechange in income.b. Maria's price elasticity of clothing demand is also one, because every percentage point increasein the price of clothing would lead her to reduce her quantity purchased by the same percentage.c. Because Maria spends a smaller proportion of her income on clothing, then for any given price,her quantity demanded will be lower. Thus, her demand curve has shifted to the left. Becauseshe will again spend a constant fraction of her income on clothing, her income and priceelasticities of demand remain one.8. a. The percentage change in price (using the midpoint formula) is – / × 100% = %. Therefore, theprice elasticity of demand is = , which is very elastic.b. Because the demand is inelastic, the Transit Authority's revenue rises when the fare rises.c. The elasticity estimate might be unreliable because it is only the first month after the fareincrease. As time goes by, people may switch to other means of transportation in response to theprice increase. So the elasticity may be larger in the long run than it is in the short run.9. Walt's price elasticity of demand is zero, because he wants the same quantity regardless of the price.Jessie's price elasticity of demand is one, because he spends the same amount on gas, no matterwhat the price, which means his percentage change in quantity is equal to the percentage change in price.10. a. With a price elasticity of demand of , reducing the quantity demanded of cigarettes by 20%requires a 50% increase in price, because 20/50 = . With the price of cigarettes currently $2, thiswould require an increase in the price to $ a pack using the midpoint method (note that ($ –$2)/$ = .50).b. The policy will have a larger effect five years from now than it does one year from now. Theelasticity is larger in the long run, because it may take some time for people to reduce theircigarette usage. The habit of smoking is hard to break in the short run.c. Because teenagers do not have as much income as adults, they are likely to have a higher priceelasticity of demand. Also, adults are more likely to be addicted to cigarettes, making it moredifficult to reduce their quantity demanded in response to a higher price.11. To determine whether you should increase or decrease the price of admissions, you need to know ifthe demand is elastic or inelastic. If demand is elastic, a decline in the price of admissions willincrease total revenue. If demand is inelastic, an increase in the price of admissions will cause total revenue to rise.12. A worldwide drought could increase the total revenue of farmers if the price elasticity of demand forgrain is inelastic. The drought reduces the supply of grain, but if demand is inelastic, the reduction of supply causes a large increase in price. Total farm revenue would rise as a result. If there is only a drought in Kansas, Kansas’ production is not a large enough proportion of the total farm product to have much impact on the price. As a result, price does not change (or changes by only a slightamount), while the output by Kansas farmers declines, thus reducing their income.。
曼昆《经济学原理》第5版全

45
家庭
图1 :循环流量图
收益
物品与 劳务出 售
企业
物品与劳务 市场
支出 物品与 劳务购 买 家庭 劳动,土地 和资本
的是边际修理(变速器)的收益与成本
由A情形到B情形激励的改变导致你决策的改变
12
人们如何相互交 易
人们如何相互交易
原理 5 :贸易可以使每个人的状况都变得更好
人们可以专门生产一种物品或劳务并用来交换其他
物品或劳务,而不必自给自足
国家之间也能从贸易与专业化中受益 将他们生产的物品出口而得到一个更好的价格 从国外进口更便宜的物品而不用在国内自己生产
原理 9 :当政府发行了过多货币时,物价上升
通货膨胀:物价总水平的上升 长期而言,通货膨胀总是由于货币数量的过度增长
而导致货币价值的下降所引起
政府创造货币的速度越快,通胀率越高
经济学十大原理
25
整体经济如何运行
原理 10 :社会面临通货膨胀与失业之间的短期权衡 取舍
短期内(1-2年),许多经济政策朝相反的方向推
动通货膨胀与失业
其它因素使这种权衡取舍不那么明显,但这种权衡
取舍一直都存在
经济学十大原理
26
参考资料:如何阅读本书
1. 上课之前先读书
你将从课堂上领会更多东西 2. 要总结,而不是划重点线 划重点线是一种消极的做法,它不能帮助你理解或 记忆。相反,用你自己的话总结每一节的内容,然 后与该章结尾的内容提要相比较
经济学十大原理
30
内容提要
关于个同目标之间的权衡取舍 任何一种行为的成本可以用其所放弃的机会来衡
量
理性人通过比较边际成本与边际利益做出决策 人们根据他们所面临的激励改变自己的行为
曼昆经济学原理第五版课后练习答案

曼昆经济学原理第五版课后练习答案第一篇:曼昆经济学原理第五版课后练习答案第一篇导言第一章经济学十大原理1.列举三个你在生活中面临的重要权衡取合的例子。
答:①大学毕业后.面临着是否继续深造的选择,选择继续上学攻读研究生学位,就意味着在今后三年中放弃参加工作、赚工资和积累社会经验的机会;2、在学习内容上也面临着很重要的权衡取舍,如果学习《经济学》,就要减少学习英语或其他专业课的时间,③对于不多的生活费的分配同样面临权衡取舍,要多买书.就要减少在吃饭、买衣服等其他方面的开支。
2、看一场电影的机会成本是什么?答:看一场电影的机会成本是在看电影的时间里做其他事情所能获得的最大收益,例如:看书、打零工。
3、水是生活必需的。
一杯水的边际利益是大还是小呢?答:这要看这杯水是在什么样的情况下喝.如果这是一个人五分钟内喝下的第五杯水.那么他的边际利益很小.有可能为负;如果这是一个极度干渴的人喝下的第一杯水,那么他的边际利益将会极大。
4、为什么决策者应该考虑激励? 答:因为人们会对激励做出反应。
如果政策改变了激励,它将使人们改变自己的行为,当决策者未能考虑到行为如何由于政策的原因而变化时.他们的政策往往会产生意想不到的效果。
为什么各国之间的贸易不像竞赛一样有赢家和输家呢? 答:因为贸易使各国可以专门从事自己最擅长的话动,并从中享有更多的各种各样的物品与劳务。
通过贸易使每个国家可供消费的物质财富增加,经济状况变得更好。
因此,各个贸易国之间既是竞争对手,又是经济合作伙伴。
在公平的贸易中是“双赢”或者“多赢”的结果。
6.市场巾的那只“看不见的手”在做什么呢,答:市场中那只“看不见的手”就是商品价格,价格反映商品自身的价值和社会成本,市场中的企业和家庭在作出买卖决策时都要关注价格。
因此.他们也会不自觉地考虑自己行为的(社会)收益和成本。
从而,这只“看不见的手”指引着干百万个体决策者在大多数情况下使社会福利趋向最大化。
解释市场失灵的两个主要原因,并各举出一个例子。
经济学原理 曼昆第五版英文答案Chapter30
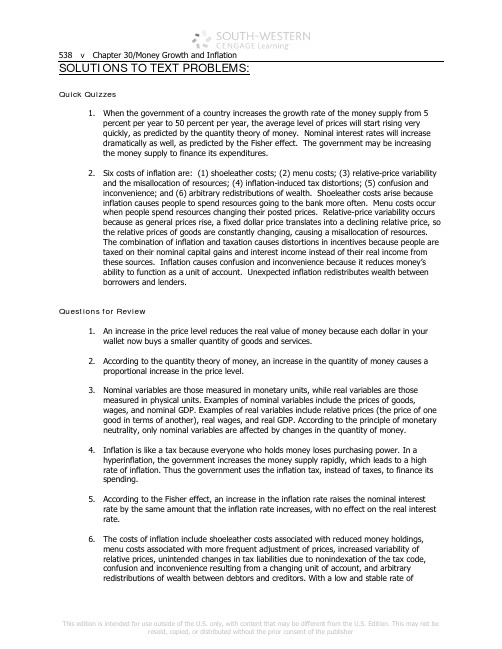
SOLUTIONS TO TEXT PROBLEMS:Quick Quizzes1. When the government of a country increases the growth rate of the money supply from 5percent per year to 50 percent per year, the average level of prices will start rising veryquickly, as predicted by the quantity theory of money. Nominal interest rates will increasedramatically as well, as predicted by the Fisher effect. The government may be increasingthe money supply to finance its expenditures.2. Six costs of inflation are: (1) shoeleather costs; (2) menu costs; (3) relative-price variabilityand the misallocation of resources; (4) inflation-induced tax distortions; (5) confusion andinconvenience; and (6) arbitrary redistributions of wealth. Shoeleather costs arise becauseinflation causes people to spend resources going to the bank more often. Menu costs occurwhen people spend resources changing their posted prices. Relative-price variability occursbecause as general prices rise, a fixed dollar price translates into a declining relative price, sothe relative prices of goods are constantly changing, causing a misallocation of resources.The combination of inflation and taxation causes distortions in incentives because people aretaxed on their nominal capital gains and interest income instead of their real income fromthese sources. Inflation causes confusion and inconvenience because it reduces money’sability to function as a unit of account. Unexpected inflation redistributes wealth betweenborrowers and lenders.Questions for Review1. An increase in the price level reduces the real value of money because each dollar in yourwallet now buys a smaller quantity of goods and services.2. According to the quantity theory of money, an increase in the quantity of money causes aproportional increase in the price level.3. Nominal variables are those measured in monetary units, while real variables are thosemeasured in physical units. Examples of nominal variables include the prices of goods,wages, and nominal GDP. Examples of real variables include relative prices (the price of onegood in terms of another), real wages, and real GDP. According to the principle of monetaryneutrality, only nominal variables are affected by changes in the quantity of money.4. Inflation is like a tax because everyone who holds money loses purchasing power. In ahyperinflation, the government increases the money supply rapidly, which leads to a highrate of inflation. Thus the government uses the inflation tax, instead of taxes, to finance itsspending.5. According to the Fisher effect, an increase in the inflation rate raises the nominal interestrate by the same amount that the inflation rate increases, with no effect on the real interestrate.6. The costs of inflation include shoeleather costs associated with reduced money holdings,menu costs associated with more frequent adjustment of prices, increased variability ofrelative prices, unintended changes in tax liabilities due to nonindexation of the tax code,confusion and inconvenience resulting from a changing unit of account, and arbitraryredistributions of wealth between debtors and creditors. With a low and stable rate ofimportant one is the interaction between inflation and the tax code, which may reduce saving and investment even though the inflation rate is low.7. If inflation is less than expected, creditors benefit and debtors lose. Creditors receive dollar payments from debtors that have a higher real value than was expected. Problems and Applications 1. a. If people need to hold less cash, the demand for money shifts to the left, because there will be less money demanded at any price level. b. If the Fed does not respond to this event, the shift to the left of the demand for money combined with no change in the supply of money leads to a decline in the value of money (1/P), which means the price level rises, as shown in Figure 1.Value of Money, 1/p (high)Quantity of Money D 1D 2S 1Price Level p (low)(low)(high)Figure 1c. If the Fed wants to keep the price level stable, it should reduce the money supply from S 1 to S 2 in Figure 2. This would cause the supply of money to shift to the left by the same amount that the demand for money shifted, resulting in no change in the value of money and the price level. Value of Money, 1/p (high)Quantity of Money D 1D 2S 1Price Level p (low)(low)(high)S 22. With constant velocity, reducing the inflation rate to zero would require the money growthrate to equal the growth rate of output, according to the quantity theory of money (M x V = P x Y).3. In this problem, all amounts are shown in billions.a. Nominal GDP = P x Y = $10,000 and Y = real GDP = $5,000, so P = (P x Y)/Y =$10,000/$5,000 = 2.Because M x V = P x Y, then V = (P x Y)/M = $10,000/$500 = 20.b. If M and V are unchanged and Y rises by 5%, then because M x V = P x Y, P must fall by5%. As a result, nominal GDP is unchanged.c. To keep the price level stable, the Fed must increase the money supply by 5%, matchingthe increase in real GDP. Then, because velocity is unchanged, the price level will bestable.d. If the Fed wants inflation to be 10%, it will need to increase the money supply 15%.Thus M x V will rise 15%, causing P x Y to rise 15%, with a 10% increase in prices and a 5% rise in real GDP.4. If a country's inflation rate increases sharply, the inflation tax on holders of money increasessignificantly. Wealth in savings accounts is not subject to a change in the inflation taxbecause the nominal interest rate will increase with the rise in inflation. But holders ofsavings accounts are hurt by the increase in the inflation rate because they are taxed on their nominal interest income, so their real returns are lower.5. Hyperinflations usually arise when governments try to finance much of their expenditures byprinting money. This is unlikely to occur if the central bank (which is responsible forcontrolling the level of the money supply) is independent of the government.6. a. When the price of both goods doubles in a year, inflation is 100%. Let’s set the marketbasket equal to one unit of each good. The cost of the market basket is initially $4 andbecomes $8 in the second year. Thus, the rate of inflation is ($8 − $4)/$4 × 100% =100%. Because the prices of all goods rise by 100%, the farmers get a 100% increase in their incomes to go along with the 100%increase in prices, so neither is affected by thechange in prices.b. If the price of beans rises to $2 and the price of rice rises to $4, then the cost of themarket basket in the second year is $6. This means that the inflation rate is ($6 − $4) /$4 × 100% = 50%. Bob is better off because his dollar revenues doubled (increased100%) while inflation was only 50%. Rita is worse off because inflation was 50%percent, so the prices of the goods she buys rose faster than the price of the goods (rice) she sells, which rose only 33%.c. If the price of beans rises to $2 and the price of rice falls to $1.50, then the cost of themarket basket in the second year is $3.50. This means that the inflation rate is ($3.5 −$4) / $4 × 100% = -12.5%. Bob is better off because his dollar revenues doubled(increased 100%) while prices overall fell 12.5%. Rita is worse off because inflation was(rice) she sells, which fell 50%.d. The relative price of rice and beans matters more to Bob and Rita than the overallinflation rate. If the price of the good that a person produces rises more than inflation,he or she will be better off. If the price of the good a person produces rises less thaninflation, he or she will be worse off.7. The following table shows the relevant calculations:(a) (b) (c)(1) Nominal interest rate 10.0 6.0 4.0(2) Inflation rate 5.0 2.0 1.0rate 5.0 4.0 3.0(3) Before-tax real interest(4) Reduction in nominal interest rate due to 40% tax 4.0 2.4 1.6(5) After-tax nominal interest rate 6.0 3.6 2.4(6) After-tax real interest rate 1.0 1.6 1.4Row (3) is row (1) minus row (2). Row (4) is .40 x row (1). Row (5) is (1 − .40) x row (1), which equals row (1) minus row (4). Row (6) is row (5) minus row (2). Note that eventhough part (a) has the highest before-tax real interest rate, it has the lowest after-tax real interest rate. Note also that the after-tax real interest rate is much lower than the before-tax real interest rate.8. The shoeleather costs of going to the bank include the value of your time, gas for your carthat is used as you drive to the bank, and the inconvenience of not having more money on hand. These costs could be measured by valuing your time at your wage rate and valuing the gas for your car at its cost. Valuing the inconvenience of being short of cash is harder to measure, but might depend on the value of the shopping opportunities you give up by not having enough money to buy things you want. Your college president differs from you mainly in having a higher wage, thus having a higher cost of time.9. The functions of money are to serve as a medium of exchange, a unit of account, and a storeof value. Inflation mainly affects the ability of money to serve as a store of value, because inflation erodes money's purchasing power, making it less attractive as a store of value.Money also is not as useful as a unit of account when there is inflation, because stores have to change prices more often and because people are confused and inconvenienced by the changes in the value of money. In some countries with hyperinflation, stores post prices in terms of a more stable currency, such as the U.S. dollar, even when the local currency is still used as the medium of exchange. Sometimes countries even stop using their local currency altogether and use a foreign currency as the medium of exchange as well.10. a. Unexpectedly high inflation helps the government by providing higher tax revenue andreducing the real value of outstanding government debt.b. Unexpectedly high inflation helps a homeowner with a fixed-rate mortgage because hepays a fixed nominal interest rate that was based on expected inflation, and thus pays a lower real interest rate than was expected.c. Unexpectedly high inflation hurts a union worker in the second year of a labor contractbecause the contract probably based the worker's nominal wage on the expectedinflation rate. As a result, the worker receives a lower-than-expected real wage.d. Unexpectedly high inflation hurts a college that has invested some of its endowment ingovernment bonds because the higher inflation rate means the college is receiving alower real interest rate than it had planned. (This assumes that the college did notpurchase indexed Treasury bonds.)11. The redistribution from creditors to debtors is something that happens when inflation isunexpected, not when it is expected. The problems that occur with both expected andunexpected inflation include shoeleather costs associated with reduced money holdings, menu costs associated with more frequent adjustment of prices, increased variability ofrelative prices, unintended changes in tax liabilities due to nonindexation of the tax code, and the confusion and inconvenience resulting from a changing unit of account.12. a. The statement that "Inflation hurts borrowers and helps lenders, because borrowersmust pay a higher rate of interest," is false. Higher expected inflation means borrowerspay a higher nominal rate of interest, but it is the same real rate of interest, soborrowers are not worse off and lenders are not better off. Higher unexpected inflation,on the other hand, makes borrowers better off and lenders worse off.b. The statement, "If prices change in a way that leaves the overall price level unchanged,then no one is made better or worse off," is false. Changes in relative prices can makesome people better off and others worse off, even though the overall price level does not change. See problem 7 for an illustration of this.c. The statement, "Inflation does not reduce the purchasing power of most workers," istrue. Most workers' incomes keep up with inflation reasonably well.。
曼昆经济学原理宏观第五版答案

曼昆经济学原理宏观第五版答案【篇一:经济学原理曼昆(宏观部分答案)】>第二十三章一国收入的衡量复习题 1 .解释为什么一个经济的收入必定等于其支出? 答:对一个整体经济而言,收入必定等于支出。
因为每一次交易都有两方:买者和卖者。
一个买者的1 美元支出是另一个卖者的1 美元收入。
因此,交易对经济的收入和支出作出了相同的贡献。
由于gdp 既衡量总收入 135 又衡量总支出,因而无论作为总收入来衡量还是作为总支出来衡量,gdp 都相等.2 .生产一辆经济型轿车或生产一辆豪华型轿车,哪一个对gdp 的贡献更大?为什么? 答:生产一辆豪华型轿车对gdp 的贡献大。
因为gdp 是在某一既定时期一个国家内生产的所有最终物品与劳务的市场价值。
由于市场价格衡量人们愿意为各种不同物品支付的量,所以市场价格反映了这些物品的市场价值。
由于一辆豪华型轿车的市场价格高于一辆经济型轿车的市场价格,所以一辆豪华型轿车的市场价值高于一辆经济型轿车的市场价值,因而生产一辆豪华型轿车对gdp 的贡献更大.3 .农民以2 美元的价格把小麦卖给面包师。
面包师用小麦制成面包,以3 美元的价格出售。
这些交易对 gdp 的贡献是多少呢? 答:对gdp 的贡献是3 美元。
gdp 只包括最终物品的价值,因为中间物品的价值已经包括在最终物品的价格中了.4 .许多年以前,peggy 为了收集唱片而花了500 美元。
今天她在旧货销售中把她收集的物品卖了100 美元.这种销售如何影响现期gdp? 答:现期gdp 只包括现期生产的物品与劳务,不包括涉及过去生产的东西的交易。
因而这种销售不影响现期gdp.5 .列出gdp 的四个组成部分。
各举一个例子.答:gdp 等于消费(c)+投资(i)+政府购买(g)+净出口(nx) 消费是家庭用于物品与劳务的支出,如汤姆一家人在麦当劳吃午餐.投资是资本设备、存货、新住房和建筑物的购买,如通用汽车公司建立一个汽车厂.政府购买包括地方政府、州政府和联邦政府用于物品与劳务的支出,如海军购买了一艘潜艇.净出口等于外国人购买国内生产的物品(出口)减国内购买的外国物品(进口)。
曼昆微观经济学第五版答案
曼昆微观经济学第五版答案【篇一:曼昆_微观经济学_原理_第五版_课后习题答案(修改)】/p> 4.你在篮球比赛的赌注中赢了100美元。
你可以选择现在花掉它或在利率为55%的银行中存一年。
现在花掉100美元的机会成本是什么呢?答:现在花掉100 美元的机会成本是在一年后得到105 美元的银行支付(利息+本金)。
7.社会保障制度为65岁以上的人提供收入。
如果一个社会保障的领取者决定去工作并赚一些钱,他(或她)所领到的社会保障津贴通常会减少。
a.提供社会保障如何影响人们在工作时的储蓄激励?答:社会保障的提供使人们退休以后仍可以获得收入,以保证生活。
因此,人们不用为不能工作时的生活费而发愁,人们在工作时期的储蓄就会减少。
b.收入提高时津贴减少的政策如何影响65岁以上的人的工作激励??答:这会使65 岁以上的人在工作中不再积极进取。
因为努力工作获得高收入反而会使得到的津贴减少,所以对65 岁以上的人的努力工作的激励减少了。
11.解释下列每一项政府活动的动机是关注平等还是关注效率。
在关注效率的情况下,讨论所涉及的市场失灵的类型。
a.对有线电视频道的价格进行管制。
答:这是关注效率,市场失灵的原因是市场势力的存在。
可能某地只有一家有线电视台,由于没有竞争者,有线电视台会向有线频道的消费者收取高出市场均衡价格的价格,这是垄断。
垄断市场不能使稀缺资源得到最有效的配置。
在这种情况下,规定有线电视频道的价格会提高市场效率。
b.向一些穷人提供可用来购买食物的消费券。
答:这是出于关注平等的动机,政府这样做是想把经济蛋糕更公平地分给每一个人。
c.在公共场所禁止抽烟。
答:这是出于关注效率的动机。
因为公共场所中的吸烟行为会污染空气,影响周围不吸烟者的身体健康,对社会产生了有害的外部性,而外部性正是市场失灵的一种情况,而这也正是政府在公共场所禁止吸烟的原因。
d.把美孚石油公司(它曾拥90%的炼油厂)分拆为几个较小的公司。
答:出于关注效率的动机,市场失灵是由于市场势力。
- 1、下载文档前请自行甄别文档内容的完整性,平台不提供额外的编辑、内容补充、找答案等附加服务。
- 2、"仅部分预览"的文档,不可在线预览部分如存在完整性等问题,可反馈申请退款(可完整预览的文档不适用该条件!)。
- 3、如文档侵犯您的权益,请联系客服反馈,我们会尽快为您处理(人工客服工作时间:9:00-18:30)。
曼昆经济学原理第五版答案英文ch30Harcourt, Inc. items and derived items copyright 2001 by Harcourt, Inc.WHAT’S NEW:The section on capital flight has been updated to include Asia and Russia. The topic of “The Twin Deficits in the United States” is now briefly discussed in the main text. There is a new In the News box on “How the Chinese Help American Home Buyers.”LEARNING OBJECTIVES:By the end of this chapter, students should understand:how to build a model to explain an open economy’s trade balance and exchangerate.how to use the model to analyze the effects of government budget deficits.how to use the model to analyze the macroeconomic effects of trade policies.how to use the model to analyze political instability and capital flight.KEY POINTS:1. To analyze the macroeconomics of open economies, two markets are central―themarket for loanable funds and the market for foreign-currency exchange. In the market for loanable funds, the interest rate adjusts to balance the supply of loanable funds (from national saving) and the demand for loanable funds (from domestic investment and net foreign investment). In the market forforeign-currency exchange, the real exchange rate adjusts to balance the supply of dollars (for net foreign investment) and the demand for dollars (for net exports). Because net foreign investment is part of the demand for loanable funds andprovides the supply of dollars for foreign-currency exchange, it is the variable that connects these two markets.2. A policy that reduces national saving, such as a government budget deficit,reduces the supply of loanable funds and drives up the interest rate. The higher interest rate reduces net foreign investment, which reduces the supply of dollars in the market for foreign-currency exchange. The dollar appreciates, and net exports fall.30A MACROECONOMIC THEORY OF THE OPENECONOMYHarcourt, Inc. items and derived items copyright 2001 by Harcourt, Inc.3. Although restrictive trade policies, such as a tariff or quota on imports, aresometimes advocated as a way to alter the trade balance, they do not necessarily have that effect. A trade restriction increases net exports for a given exchange rate and, therefore, increases the demand for dollars in the market forforeign-currency exchange. As a result, the dollar appreciates in value, making domestic goods more expensive relative to foreign goods. This appreciation offsets the initial impact of the trade restriction on net exports.4. When investors change their attitudes about holding assets of a country, theramifications for the country’s economy can be profound. In particular, political instability can lead to capital flight, which tends to increase interest rates and cause the currency to depreciate.CHAPTER OUTLINE:I. Supply and Demand for Loanable Funds and for Foreign-Currency ExchangeA.The Market for Loanable Funds1.Whenever a nation saves a dollar of income, it can use that dollar to finance the purchase of domestic capital or to finance the purchase of an asset abroad.2. The supply of loanable funds comes from national saving.3.The demand for loanable funds comes from domestic investment and net foreign investment.4.The quantity of loanable funds demanded and the quantity of loanable funds supplied depend on the real interest rate.a.A higher real interest rate encourages people to save and thus raises the quantity of loanable funds supplied.b.A higher interest rate makes borrowing to finance capital projects more costly, discouraging investment and lowering the quantity of loanable funds demanded.c.A higher real interest rate in a country will also lower net foreign investment. All else equal, a higher domestic interest rate implies that purchases of foreign assets by domestic residents will fall and purchases of domestic assets by foreigners will rise.You may need to write the equation for net foreign investment on the board to explain its relationship with the real5. The supply and demand for loanable funds can be showngraphically.a. The real interest rate is the price of borrowing funds andis therefore on the vertical axis; the quantity of loanablefunds is on the horizontal axis.b. The supply of loanable funds is upward-sloping becauseof the positive relationship between the real interest rateand the quantity of loanable funds supplied.c. The demand for loanable funds is downward-slopingbecause of the inverse relationship between the realinterest rate and the quantity of loanable fundsdemanded.6. The interest rate adjusts to bring the supply and demand forloanable funds into balance.a. If the interest rate was below r*, the quantity of loanablefunds demanded would be greater than the quantity ofHarcourt, Inc. items and derived items copyright 2001 by Harcourt, Inc.loanable funds supplied. This would lead to upwardpressure on the interest rate.b. If the interest rate was above r*, the quantity of loanablefunds demanded would be less than the quantity ofloanable funds supplied. This would lead to downwardpressure on the interest rate.7.At the equilibrium interest rate, the amount that people want tosave is exactly equal to the desired quantities of domesticinvestment and net foreign investment.B. The Market for Foreign-Currency Exchange1. The imbalance between the purchase and sale of capital assetsabroad must be equal to the imbalance between exports andimports of goods and services.2. Net foreign investment represents the quantity of dollarssupplied for the purpose of buying assets abroad.3. Net exports represent the quantity of dollars demanded for thepurpose of buying U.S. net exports of goods and services.4. The real exchange rate is the price that balances the supply anddemand in the market for foreign-currency exchange.a. When the U.S. real exchange rate appreciates, U.S. goodsbecome more expensive relative to foreign goods,lowering U.S. exports and raising imports. Thus, anincrease in the real exchange rate will reduce thequantity of dollars demanded.b. The key determinant of net foreign investment is the realinterest rate. Thus, as the real exchange rate changes,there will be no change in net foreign investment.5. We can show the market for foreign-currency exchangegraphically.Harcourt, Inc. items and derived items copyright 2001 by Harcourt, Inc.a. The real exchange rate is on the vertical axis; thequantity of dollars exchanged is on the horizontal axis.b. The demand for dollars will be downward-slopingbecause of the inverse relationship between the realexchange rate and the quantity of dollars demanded.c. The supply of dollars will be a vertical line because of thefact that changes in the real exchange rate have noinfluence on the quantity of dollars supplied.6. The real exchange rate adjusts to balance the supply anddemand for dollars.a. If the real exchange rate was lower than real e*, thequantity of dollars demanded would be greater than thequantity of dollars supplied and there would be upwardpressure on the real exchange rate.b. If the real exchange rate was higher than real e*, thequantity of dollars demanded would be less than thequantity of dollars supplied and there would bedownward pressure on the real exchange rate.7. At the equilibrium real exchange rate, the demand for dollars tobuy net exports exactly balances the supply of dollars to beexchanged into foreign currency to buy assets abroad.Harcourt, Inc. items and derived items copyright 2001 by Harcourt, Inc.Harcourt, Inc. items and derived items copyright2001 by Harcourt, Inc.C.FYI: Purchasing-Power Parity as a Special Case1.Purchasing-power parity suggests that a dollar must buy the same quantity of goods and services in every country. As aresult, the real exchange rate is fixed and the nominal exchange rate is determined by the price levels in the two countries.2.Purchasing-power parity assumes that international trade responds quickly to international price differences.a.If goods were cheaper in one country than another, they would be exported from the country where they arecheaper and imported into the second country where the prices are higher.b. This would continue until the price differential disappears.c.Because net exports are so responsive to small changes in the real exchange rate, purchasing-power parityimplies that the demand for dollars would be horizontal. Thus, purchasing-power parity is simply a special case of the model of the foreign-currency exchange market. d.However, it is more realistic to draw the demand curve downward-sloping.II. Equilibrium in the Open Economy A.Net Foreign Investment: the Link between the Two Markets 1.In the market for loanable funds, net foreign investment is a part of the demand.2. In the foreign-currency exchange market, net foreign investment is the supply of dollars.3.This means that net foreign investment is the variable that links the two markets.4. The key determinant of net foreign investment is the real interest rate.5.We can show the relationship between net foreign investment and the real interest rate graphically.a.When the real interest rate is high, owning domesticassets is more attractive and thus, net foreign investment is low.b. This inverse relationship implies that net foreign investment will be downward-sloping.c.Note that net foreign investment can be positive or negative.NF1. The real interest rate is determined in the market for loanable funds.2.This real interest rate determines the level of net foreign investment.3.Because net foreign investment must be paid for with foreign currency, the quantity of net foreign investment determines the supply of dollars.4.The equilibrium real exchange rate brings into balance the quantity of dollars supplied and the quantity of dollars demanded.5.Thus, the real interest rate and the real exchange rate adjust simultaneously to balance supply and demand in the twomarkets. As they do so, they determine the levels of nationalsaving, domestic investment, net foreign investment, and net exports.III. How Policies and Events Affect an Open EconomyA.Government Budget Deficits 1.A government budget deficit occurs when the government DHarcourt, Inc. items and derived items copyright 2001 by Harcourt, Inc.it lowers national saving. This leads to a decline in the supply ofloanable funds.3. The real interest rate rises, leading to a decline in both domestic investment and net foreign investment.4. Because net foreign investment falls, people need less foreign currency to buy foreign assets so the supply of dollars declines.5.The real exchange rate rises, making U.S. goods more expensive relative to foreign goods. Exports will fall, imports will rise, and net exports will fall.6.In an open economy, government budget deficits raise realinterest rates, crowd out domestic investment, cause the dollar to appreciate, and push the trade balance toward deficit.7.Because they are so closely related, the budget deficit and thetrade deficit are often called the twin deficits. Note that, because many other factors affect the trade deficit, these “twins” are not identical.1.Definition of Trade Policy: a government policy that directly influences the quantity of goods and services that a country imports or exports.2. Two common types of trade policies are tariffs (taxes onimported goods) and quotas (limits on the quantity of importedgoods).3. Example: the U.S. government imposes a quota on the numberof cars imported from Japan.4. Note that the quota will have no effect on the market forloanable funds. Thus, the real interest rate will be unaffected.5. The quota will lower imports and thus increase net exports.Since net exports are the source of demand for dollars in themarket for foreign-currency exchange, the demand for dollarswill increase.6. The real exchange rate will rise making U.S. goods relativelymore expensive than foreign goods. Exports will fall, importswill rise, and net exports will fall.7. In the end, the quota reduces both imports and exports but net9. Recall that NX = NFI. Also remember that S = I + NFI.Rewriting, we get:NFI = S – I.Substituting for NFI, we get:NX = S – I.10. Since trade policies do not affect national saving or domesticinvestment, they cannot affect net exports.11. Trade policies do have effects on firms, industries, and countries.But these effects are more microeconomic than macroeconomic.C. Political Instability and Capital Flight1. Definition of Capital Flight: a large and sudden reduction in thedemand for assets located in a country.2. Capital flight often occurs because investors feel that thecountry is unstable, due to either economic or political problems.3. Example: Investors around the world observe political problemsin Mexico and begin selling Mexican assets and buying U.S.assets.4. Mexican net foreign investment will rise because investors areselling Mexican assets and purchasing assets from anothercountry.a. Since net foreign investment determines the supply ofpesos, the supply of pesos increases.b. Since net foreign investment is also a part of the demandfor loanable funds, the demand for loanable funds rises.5. The increased demand for loanable funds causes the equilibriumreal interest rate to rise.6. The increased supply of pesos lowers the equilibrium realexchange rate.7. Thus, capital flight from Mexico increases Mexican interest ratesand lowers the value of the Mexican peso in the market forforeign-currency exchange.8. Capital flight in Mexico will also affect other countries. If thecapital flows out of Mexico and into the United States, it has theopposite effect on the U.S. economy.9. In 1997, several Asian countries experienced capital flight. Thesame thing occurred in Russia in 1998.D. In the News: How the Chinese Help American Home Buyers1. China is using funds from its large trade surpluses to purchaseU.S. securities.2. This is an article from The Wall Street Journal covering theeffects of this influx of capital on U.S. interest rates. ALTERNATIVE CLASSROOM EXAMPLE:Suppose that investors feel very confident about the prospects for investment in Brazilian assets.In this case (from the perspective ofADJUNCT TEACHING TIPS AND WARM-UP ACTIVITIES:1.Encourage students to bring their books to class so that they can look at thegraphs up close while redrawing them in their notes. This will help them tounderstand the model panel by panel.SOLUTIONS TO TEXT PROBLEMS:Quick Quizzes1. The supply of loanable funds comes from national saving. The demand forloanable funds comes from domestic investment and net foreign investment.Supply in the market for foreign-currency exchange comes from net foreigninvestment. Demand in the market for foreign-currency exchange comesfrom net exports.2. The two markets in the model of the open economy are the market for loanablefunds and the market for foreign-currency exchange. These marketsdetermine two relative prices: (1) the market for loanable funds determines the real interest rate; and (2) the market for foreign-currency exchangedetermines the real exchange rate.3. If Americans decided to spend a smaller fraction of their incomes, the increasein saving would shift the supply curve for loanable funds to the right, as shown in Figure 30-1. The decline in the real interest rate increases net foreigninvestment and shifts the supply of dollars to the right in the market forforeign-currency exchange. The result is a decline in the real exchange rate.Since the real interest rate is lower, domestic investment increases. Since net foreign investment increases, the trade balance also increases. Overall,saving and domestic investment increase, the real interest rate and realexchange rate decrease, and the trade balance increases.Figure 30-1Questions for Review1. The supply of loanable funds comes from national saving; the demand forloanable funds comes from domestic investment and net foreign investment.The supply of dollars in the market for foreign exchange comes from netforeign investment; the demand for dollars in the market for foreign exchange comes from net exports. The link between the two markets is net foreigninvestment.2. Government budget deficits and trade deficits are sometimes called the twindeficits because a government budget deficit often leads to a trade deficit.The government budget deficit leads to reduced national saving, causing theinterest rate to increase, thus reducing net foreign investment, which in turnreduces net exports.3. If a union of textile workers encourages people to buy only American-madeclothes, imports would be reduced, so net exports would increase for any given real exchange rate. This would cause the demand curve in the market forforeign exchange to shift to the right, as shown in Figure 30-2. The result is arise in the real exchange rate, but no effect on the trade balance. The textileindustry would import less, but other industries, such as the auto industry,would import more because of the higher real exchange rate.Figure 30-24. Capital flight is a large and sudden movement of funds out of a country.Capital flight causes the interest rate to increase and the exchange rate todepreciate.Problems and Applications1. Japan generally runs a trade surplus because the Japanese saving rate is highrelative to Japanese domestic investment. The result is high net foreigninvestment, which is matched by high net exports, resulting in a trade surplus.The other possibilities (high foreign demand for Japanese goods, low Japanese demand for foreign goods, and structural barriers against imports into Japan) would affect the real exchange rate, but not the trade surplus.2. A reduction in the U.S. government budget deficit would increase nationalsaving, shifting the supply curve of loanable funds to the right in Figure 30-3.This would reduce the real interest rate in the United States, thus increasingnet foreign investment, and reducing the real exchange rate. Thus the realvalue of the dollar would decline, not increase as the President suggested.Figure 30-33. If Congress passes an investment tax credit, it subsidizes domestic investment.The desire to increase domestic investment leads firms to borrow more,increasing the demand for loanable funds, as shown in Figure 30-4. Thisraises the real interest rate, thus reducing net foreign investment. The decline in net foreign investment reduces the supply of dollars in the market forforeign exchange, raising the real exchange rate. The trade balance alsodeclines, since net foreign investment, hence net exports, are lower. Thehigher real interest rate also increases the quantity of national saving. Insummary, saving increases, domestic investment increases, net foreigninvestment declines, the real interest rate increases, the real exchange rateincreases, and the trade balance decreases.Figure 30-44. a. A decline in the quality of U.S. goods at a given real exchange ratewould reduce net exports, reducing the demand for dollars, thusshifting the demand curve for dollars to the left in the market forforeign exchange, as shown in Figure 30-5.b. The shift to the left of the demand curve for dollars leads to a decline inthe real exchange rate. Since net foreign investment is unchanged,and net exports equals net foreign investment, there is no change inequilibrium in net exports or the trade balance.c. The claim in the popular press is incorrect. A change in the quality ofU.S. goods cannot lead to a rise in the trade deficit. The decline in thereal exchange rate means that we get fewer foreign goods in exchangefor our goods, so our standard of living may decline.Figure 30-55. A reduction in restrictions of imports would reduce net exports at any givenreal exchange rate, thus shifting the demand curve for dollars to the left. The shift of the demand curve for dollars leads to a decline in the real exchange rate, which increases net exports. Since net foreign investment is unchanged, and net exports equals net foreign investment, there is no change in equilibrium in net exports or the trade balance. But both imports and exports rise, so export industries benefit.6. a. When the French develop a strong taste for California wines, thedemand for dollars in the foreign-currency market increases at anygiven real exchange rate, as shown in Figure 30-6.Figure 30-6b. The result of the increased demand for dollars is a rise in the realexchange rate.c. The quantity of net exports is unchanged.7. An export subsidy increases net exports at any given real exchange rate. Thiscauses the demand for dollars to shift to the right in the market for foreignexchange, as shown in Figure 30-7. The effect is a higher real exchange rate, but no change in net exports. So the senator is wrong; an export subsidy willnot reduce the trade deficit.Figure 30-78. Higher real interest rates in Europe lead to increased U.S. net foreigninvestment. Higher net foreign investment leads to higher net exports, since in equilibrium net exports equal net foreign investment (NX=NFI). Figure30-8 shows that the increase in net foreign investment leads to a lower realexchange rate, higher real interest rate, and increased net exports.Harcourt, Inc. items and derived items copyright 2001 by Harcourt, Inc.Figure 30-89. a. If the elasticity of U.S. net foreign investment with respect to the realinterest rate is very high, the lower real interest rate that occursbecause of the increase in private saving will increase net foreigninvestment a lot, so U.S. domestic investment won't increase much.b. Since an increase in private saving reduces the real interest rate,inducing an increase in net foreign investment, the real exchange ratewill decline. If the elasticity of U.S. exports with respect to the realexchange rate is very low, it will take a large decline in the realexchange rate to increase U.S. net exports by enough to match theincrease in net foreign investment.10. a. If the Japanese decided they no longer wanted to buy U.S. assets, U.S.net foreign investment would increase, increasing the demand forloanable funds, as shown in Figure 30-9. The result is a rise in U.S.interest rates, an increase in the quantity of U.S. saving (because of thehigher interest rate), and lower U.S. domestic investment.Figure 30-9b. In the market for foreign exchange, the real exchange rate declines andthe balance of trade increases.11. The flight to safety led to a desire by foreigners to buy U.S. government bonds,resulting in a decline in U.S. net foreign investment, as shown in Figure 30-10.The decline in net foreign investment also means a decline in the demand forloanable funds. As the figure shows, the shift to the left in the demand curve results in a decline in the real interest rate in the United States. In addition,the decrease in net foreign investment decreases the supply of dollars in theforeign-exchange market, causing the dollar to appreciate, shown as a rise inthe real exchange rate. The lower real interest rate causes national saving to decline, but increases domestic investment. Since net foreign investment islower, net exports are lower, thus the trade balance declines.Harcourt, Inc. items and derived items copyright 2001 by Harcourt, Inc.Figure 30-1012. a. When U.S. mutual funds become more interested in investing in Canada,Canadian net foreign investment declines as the U.S. mutual fundsmake portfolio investments in Canadian stocks and bonds. Thedemand for loanable funds shifts to the left and the net foreigninvestment curve shifts to the left, as shown in Figure 30-11. As thefigure shows, the real interest rate declines, thus reducing Canada’sprivate saving, but increasing Canada’s domestic investment. Inequilibrium, Canadian net foreign investment declines.b. Since Canada's domestic investment increases, in the long run,Canada's capital stock will increase.c. With a higher capital stock, Canadian workers will be more productive(the value of their marginal product will increase) so wages will rise.Thus Canadian workers will be better off.d. The shift of investment into Canada means increased U.S. net foreigninvestment. As a result, the U.S. real interest rises, leading to lessdomestic investment, which in the long run reduces the U.S. capitalstock, lowers the value of marginal product of U.S. workers, andtherefore decreases the wages of U.S. workers. The impact on U.S.citizens would be different from the impact on U.S. workers becausesome U.S. citizens own capital that now earns a higher real interestHarcourt, Inc. items and derived items copyright 2001 by Harcourt, Inc.rate.Figure 30-11。