玉树地震灾情SAR遥感监测与信息服务系统
青海玉树M_S7_1级地震地表破裂带的遥感影像解译
第5卷第2期震灾防御技术Technology for Earthquake Disaster PreventionVol. 5, No. 2 Jun., 20102010 年 6 月石峰,何宏林,张英,2010. 青海玉树 MS7.1 级地震地表破裂带的遥感影像解译. 震灾防御技术,5(2) :220—227.青海玉树 MS7.1 级地震地表破裂带的 遥感影像解译1石 峰 1) 何宏林 1) 张 英 2,3)1)中国地震局地质研究所国家地震活动断层研究中心,北京 100029 2)中国科学院地理科学与资源研究所,北京 100101 3)中国科学院研究生院,北京 100049摘要2010 年 4 月 14 日青海省玉树发生 MS7.1 级地震,造成严重的人员伤亡和重大的经济损失。
除组织现场快速震害评估和地表破裂带调查外,利用高分辨率卫星影像解译是迅速给出初步震害评 估和同震地表破裂的位置和展布的最佳途径。
本文通过对震前、震后高分辨率 SPOT 卫星影像的对 比,解译出了 12km 长的同震地表破裂带,其在影像上主要表现为线性阴影和色彩变化。
地表破裂 带位置和先存的断层、老破裂带位置一致,说明青海玉树地震属于原地复发型地震。
同时,解译结 果也得到了来自野外实地调查结果的验证,证明了遥感解译的可信性和及时性。
但解译破裂长度远 小于实际破裂长度,也说明了基于 2.5m 分辨率的 SPOT 卫星影像的遥感解译存在较大的局限性。
关键词:玉树地震 遥感解译 地表破裂引言遥感解译在抗震救灾和恢复重建中发挥了重要的作用(黄铁青等,2008;李德仁等, 2008) ,同时也是研究活动构造的重要方法。
青海玉树地震发生后,除组织现场快速震害评估 和地表破裂带调查外,高分辨率卫星影像解译是迅速给出初步震害评估、同震地表破裂位置 以及展布的最佳途径。
2010 年 4 月 14 日 7 点 49 分,青海玉树(33.1°N,96.7°E)发生了 MS7.1 级地震(中国地震信息网,2010) ,矩震级为 MW6.9(USGS,2010;陈运泰,2010) , 造成巨大的人员伤亡和经济损失。
05-SARscape应用
D-InSAR应用:2010玉树地震DInSAR监测
地震后形变制图(PALSAR)
地震后形变制图(ASAR)
D-InSAR应用:2010玉树地震DInSAR监测
基于Okada模型反演滑动分布
矩张量反演结果
[cm]
ArcScene 中三维显 示断裂和地表形变
干涉叠加应用:北京市鸟巢区域地表沉降监测
数据:COSMO-SkyMed SLC
-
23景
-
2008年3月6号-2010年2月8号
应用:监测国家奥林匹克体育馆建设中对地表的影响
干涉叠加应用:北京市鸟巢区域地表沉降监测
区域内呈现10毫米左右不同程度的沉降,也有部分地区抬升,抬升的数 值总体小于沉降的数值
PS监测结果(Web中展示)
在线体验地址:8038/App10/LNDetect
农业、林业监测
GIS-Transforming our World
湄公河三角洲的水稻生长监测
ERS-2 SAR
农业监测——作物面积和估产
DEM
SAR 数据 数据处理 - 出芽面积 - 生长阶段
- 作物历 & 实践 - 管理单位
水稻制图
农业气象模型
-
天气预报数据 土壤数据 生育期数据 管理数据
面积
– 1) 国家研究 – 2) 局部研究和规划优 先区域 – 3) 评估成本和资金需 求 – 4) 合同判授 – 5) -100% 有效的排雷
死海区域(约旦&以色列边境)图像数据:SAR 幅度图像
死海区域(约旦&以色列边境)图像数据: 相干性图像
Coherence (451 days)
结果
多时相SAR动态监测技术应用于 农业
地表形变InSAR监测和云遥感服务平台技术-Esri中国信息技术有限公司 遥感事业部 技术总监 邓书斌
ENVI首个落地亚马逊云遥感服务平台(1)
ENVI首个落地亚马逊云遥感服务平台(2)
ESE管理员工作台 – 任务管理器
ESE管理员工作台 – 节点控制
ESE管理员工作台 – 任务监视器
ENVI云遥感可以无缝融合ArcGIS云
Use
Serve Process
Image Server
ArcGIS Server
匈牙利布达佩斯地下工程的地表形变监测结果
京津高铁沿线地面沉降速率监测(2007.12009.6)
玉树地震D-InSAR监测
干涉条纹(PALSAR) 地震后形变制图(PALSAR)
阿莱奇冰川移动监测
1995年10月19-20日位移
1995年11月7-8日位移
1995年11月23-24日位移
1996年10月22-23日位移
InSAR获取DEM
SARscape InSAR应用:从高分星载SAR中 获取DEM
TerraSAR-X-1 data, 3m 分辨率, 高程 精度<1m
Data © Infoterra
Bolivia
SARscape InSAR应用:从机载SAR上获取 的DEM
0.5m 采样间隔
Data © AeroSensing, Processing sarmap
地表形变INSAR监测和云遥感服务平台技术
遥感事业部 邓书斌
Dengsb@
主要内容 • 地表形变INSAR监测 • 云遥感服务平台
合成孔径雷达干涉测量—InSAR • InSAR技术是利用雷达系统 获取同一地区两幅SAR影像 所提供的相位信息进行干 涉处理,来获取地表的三 维信息。 • 全天候、大范围 • 主要应用
SARscape for ArcGIS toolbox
SAR遥感图像在汶川地震灾害识别中的应用
地震学报32卷的效果.汶川地震后,科学家们运用各种手段对此次地震的成因进行了研究,各个研究组的研究成果相继在学术期刊和Internet上公布(张培震等,2008;王卫民等,2008;滕吉文等,2008;何宏林等,2008).但利用遥感技术进行震害评估的并不多,这是因为此次地震破坏面积广,且大部分在山区,震后出现了多天的阴雨天气,给高分辨率光学影像的解译带来了很大困难.基于SAR图像具有全天时、全天候的特性,本文拟利用地震前后SAR幅度图像变化检测、干涉相干图像的相于系数相结合,对地震灾害地区进行快速识别与评估。
1研究区域及实验数据选取汶川县位于阿坝州境东南部的岷江两岸,县城威州镇位于县北部杂谷脑河与岷江交汇地,映秀镇地处阿坝州南大门,距成都88km,是进出九寨沟、卧龙、四姑娘山的必经之地,是重要的交通要道.2008年5月12日下午2时28分,汶川发生Ms8.0强烈地震,汶川全县遭受严重损失,主要表现为:①受灾面积大,全县13个乡镇全面受灾.截至6月27日全县死亡15941人,受伤34584人;②受灾程度深.全县耕地面积7100公顷(106500亩),受灾6000公顷(90000亩),房屋倒塌21万间,损毁房屋30.35万间;③基础设施毁损严重.道路垮塌,水、电、气、通讯全部中断,工矿商贸企业80%被损毁;④地震次生灾害威胁特别严重.汶川县原有地质灾害点160处,地震后新增3590处,县城周边新增的79处地质灾害点随时威胁县城的安全,已形成“晴天沙尘暴,雨天泥石流”的现实状况,县城已被地震次生灾害威胁所包围.随后几天多次发生强烈余震,映秀镇是震中和重灾区,全镇大部分房屋倒塌,到处山体滑坡,造成停水、停电,通讯、交通中断.本文以映秀镇及周边地区为研究范围,图1为研究区ETM合成图.图1(a)研究区震前(2007年9月18日)ETM7,4,2波段合成图;(b)交通位置图Fig.1(a)Landsat7pre-eventimage(ETMband7,4,2)ofthetestarea(b)locationofYingxiu地震发生后第二天早晨起,灾区大部分地区出现了10mm以上的中雨,在震后的半个多月中,天气也一直以阴雨为主,这就给光学成像带来了很大的困难,合成孔径雷达(SAR)成为这次抗震救灾前期遥感信息保障的十分重要的数据源.震后欧空局提供了大量的SAR数据,若要将覆盖灾区的影像全部都进行处理,数据量是相当庞大的,故只挑选覆盖映秀和都江堰地区的ASAR数据进行计算,使用到的数据如表1所示.实验用到的数据中B1和B2幅为震前获取的,A1幅为震后获取的,数据格式均为单2期刘云华等:SAR遥感图像在汶川地震灾害识别中的应用217视复数据(SI,C),结合ENVISAT的精密轨道数据将其处理为多视幅度图像,并采用经典的Lee算法进行滤波处理.一般而言,较大的估算窗口具有较高的估算性能,但会降低空间分辨率,考虑两者问的平衡,本文估算窗口的大小为2l×21.最后将所有图像都与2007年8月6日的震前图像进行配准.震前图像B1如图2a所示,震后图像A1如图2b所示.图中白色方框为研究区范围;图2c,d分别为从图2a,b中裁剪的研究区图像.表1震前/震后的ASAR数据Table1ASARdataandbaselinedistancesinthetestarea图2幅度图像.(a)震前;(b)震后;(c)映秀地区震前;(d)映秀地区震后Fig.2Amplitudeimagesbefore(a)andafter(b)theearthquake.(c)and(d)areamplifiedimagesfortheboxregionin(a)and(b),respectively直接对比震前震后的SAR图像,我们很难得到一些变化信息,这是因为当我们面对SAR图像时,我们看到的是完全不同于人们肉眼所见的特征.人的肉眼是一种被动式“传感器”,接收的是地物反射太阳光的能量.而雷达则是一种工作在微波波段的主动式传感器,它发射某一特定波长的微波波段的电磁波,接收来自地面的后向散射电磁波能量,两者相干而成像.上面所看到的幅度图像是一种灰度图像,图像上色调的变化取决于目标物地震学报218的后向散射截面.每一个接收到的回波被转换成电信号以某一具有特定值的、用于表示亮度的数字化象元.尽管坡度的变化、含水量和表面粗糙程度是影响雷达图像色调的3个主要作用,但是表面粗糙度在决定雷达图像的灰度方面起着决定性的作用.而地震带来的巨大破坏则会造成震前震后同一物体的粗糙程度发生很大的变化,从而使其回波强度发生变化,Matsuoka和Yamazaki(2000a)曾用一幅房屋倒塌后的废墟造成漫反射这一生动形象的图画来反映该现象.Aoki等在研究1995年神户地震中发现,人工建筑由于在结构体与地面之间形成一种“角反射”效应而具有较高的反射强度,并且反射具有较好的方向性;而开阔的场地或者受损的建筑物由于其表面发生漫反射而回波强度相对较低(Aokietal,1998;Matsuoka,Yamazaki,2000b).因此,与震前的图像相比较,由于建筑物的倒塌或者废墟被清理而露出地表,都会造成震后的后向散射系数变小.从图2幅度}冬j像上可以看出地震前后一些地区的灰度强度发生了变化,这其中有些是由于两幅图像接收季节不同,时间间隔较长一些地物发生的自然变化,然而相当一部分应该是由地震带来的破坏而造成的.尽管如此,仅凭肉眼我们还是很难看出这螳发生变化的地区的分布情况,也就是地震影响较大地区的分布.下面通过进一步的数据处理来进行分析.2利用SAR幅度图像做比值变化检测要想对两幅图像进行变化检测,必须要对不同期次的图像进行精确配准.航空图像由于不同成像期次成像轨道的差异给像素级匹配造成困难,而对于SAR图像来说,因为采用同一卫星系统,这并不造成太大的困难.利用SAR图像做变化检测有两种情况(Rignot,vanZyl,1993).其中一种情况是检测目标形态的变化,这种变化检测要求不同时相的图像要精确配准,但并不需要绝对定标数据.对于精确配准的两个时相图像来检测变化,最常规的方法是图像相减或比值处理.其它的处理方法,如多时相数据分类及主成分变化等,已被光学遥感数据处理的经验证明效果不如图像相减或比值方法.而比值的分布只依赖于相对变化,因此从统计模型来看,比值方法比图像相减方法更适用于变化检测(郭华东,2000).选用比值方法还有一个理由就是比值方法对辐射误差有更强的适应性,因为很多辐射误差是乘性的.图3a为2007年8月6日与2008年3月3日幅度图像做比值检测的结图3震前及同震比值图像.(a)B1与B2的比值图像;(b)132与A1的比值图像Fig.3Ratioofpre-earthquakeandeoseismieamplitudeimages.(a)RatioofB1overB2;(b)132overA12期刘云华等:SAR遥感图像在汶川地震灾害识别中的应用219果,两幅均为震前图像.从图3a可以看出,图右下角都江堰市及周边乡镇颜色比其它山区的颜色深一些,出现一条明显的山区与平原地区的分界线.这是由于平原地区人工建筑多于山区,从而地物特征随季节变化而出现这样的差异;平原地区修建的永久性建筑较多,随时间推移变化不大;而其它山区植被覆盖广泛,由于做比值检测的两幅图像一幅在夏季8月,一幅在春季3月,植被差异较大,造成颜色较浅.为观察细节变化,从整幅图像中截取出研究区域.图4a,b是分别从图3a,b中截取的映秀镇地区的图像,图中白色椭圆处为映秀镇所在地.由于地形影响,处于山体阴影中的象元同样具有极低的反射系数值,与水体一样呈现暗色调,因此在图2的SAR图像中并不能辨别出紫坪铺水库的轮廓.经过对幅度图像进行比值处理,在图4中紫坪铺水库已经清晰可见,并且在震前两景幅度图像问的比值图像与同震的比值图像中表现出一定的差异,这种差异可能是由于水质的变化造成后向反射系数变化造成的.在图4a的两幅震前SAR比值图像中,映秀镇的整体色调呈灰色,表明在接收这两幅图像的期间没有发生什么变化;在图4b中,图像中映秀镇及周边的色调已经不再是单一的灰色调,出现了从黑到白的变化.黑色区域分布在沿江的建筑区,表明建筑物在地震中受到了巨大破坏,与3个月前的图像相比发生了巨大变化;白色区域分布在山坡上,显然是由于滑坡所致.图中方框圈住的区域距离映秀镇大约3km,在图4a中岷江河道清晰可见,而在图4b中已模糊不清,这段正是在地震中严重破坏的都江堰至汶川公路的一段.当时进入映秀救援的冲锋舟也只能到达这里,然后徒步翻越这几公里的山体滑坡路段进入映秀.其实这段已不能称之为“路段”,因为整片的山坡因地震而坍塌下来,几米高、甚至十几米高的巨大岩石从山顶遍布到山脚下的岷江中,将原来的公路全部掩埋.图4映秀、漩口地区SAR比值图像(a)震前B1与B2的比值图像;(b)同震B2与A1的比值图像Fig.4SARratioimageinYingxiuandXuankouA1(a)Pre-earthquake,B1overB2;(b)coseismic,132over3利用InSAR相干系数变化检测震害地区干涉产品中的相干系数通常用于评价干涉相位的质量.以前对相干系数的应用研究比较少,相干系数对SAR图像散射体特性的变化十分敏感,因此它能用于地表变化的探测、土地利用的分类和绘制地震破坏程度评估等.重复观测获得的雷达图像的失相干可能由以2期刘云华等:SAR遥感图像在汶川地震灾害识别中的应用221图6为计算结果.其中图6a为用B1和B2两幅图像干涉处理得到的相干图像,将其称之为rbb;图6b为用B1和A1干涉处理得到的相干图像,将其称之为rab;图6c为用“b和r。
基于SAR影像的震害信息提取

基于SAR影像的震害信息提取破坏性地震发生之后,在交通、通讯和电力等中断,同时又缺乏足够地面震害调查资料的情况下,进行有效的地震应急救援、灾害损失评估将十分困难。
通过获取灾区震后遥感影像进行灾情判断,将不受灾区交通、通讯等中断的影响,能够快速掌握灾区全面宏观的受灾情况,并进一步提供更为详细的受灾类型、位臵和程度等信息。
通过对遥感图像的快速处理和震害信息提取,对地震灾害及其损失进行快速评估,将弥补地面调查的不足,为地震应急指挥和救援决策提供重要依据。
本文对于震害信息提取的主要任务如下:一、房屋倒塌评估在地震应急救援工作中,利用遥感技术提取建筑物等基础性设施的破坏和倒塌的信息(选取地震前后高分辨率遥感影像可以快速获取这些信息),并且根据提取出的信息进行震害的分级,划分出不同等级的震害区,为震后及时开展地震救援和灾害评估提供基础资料。
目前,利用高精度的遥感影像提取震害信息的方法主要有基于地震前后同一地区遥感影像的光谱特征(灰度)差异和基于地震前后地物在遥感图像上所表现出的几何特征(纹理)的差异两种。
星载合成孔径雷达干涉测量技术应用于地表形变监测可达CM级甚至MM级精度,对地震形变、山体滑坡等微小地表形变监测研究领域。
计划采用面向对象分类对影像进行分类,然后进行变化检测提取地震灾害中房屋倒塌情况。
其中可采用INSAR计算出地表形变量,对地震灾害进行评估。
二、道路通行能力评估道路通行受阻是影响这次救灾行动的关键因素,因此使用SAR(合成孔径雷达)图像进行道路通行能力评估意义重大。
公路目标的雷达后向散射类型是漫反射,因此公路在高分辨率SAR 图像表现出一条暗色条带,易于识别。
当公路由于崩塌、滑坡等原因造成通行受阻时,公路的石块、滑坡体等便可以反射雷达波,因此通行受阻的公路色调比较明亮,类似于山体的特征。
利用这种反差,利用高分辨率SAR 图像可以快速的评估出道路的通行能力。
(1)道路信息提取道路提取的方法和道路的图像特征紧密相关,而道路的图像特征源于其本身的物理特征。
基于多光谱遥感的青海玉树地震震害监测与评估
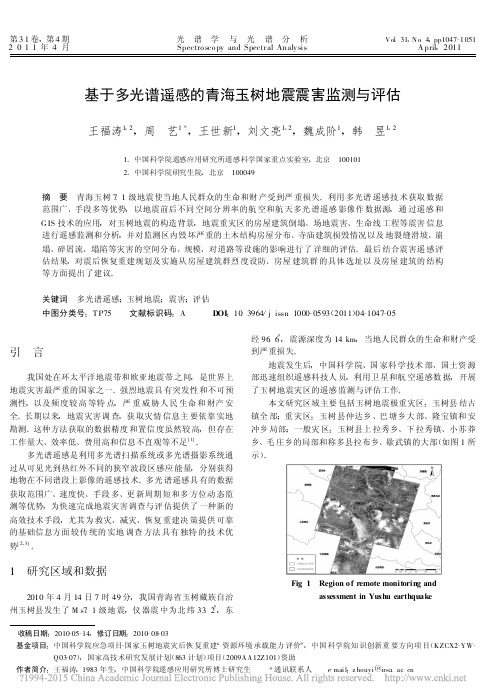
第31卷,第4期 光谱学与光谱分析Vol .31,No .4,pp1047-10512011年4月 Spectro sco py and Spectr al Analy sisA pril ,2011 基于多光谱遥感的青海玉树地震震害监测与评估王福涛1,2,周 艺1*,王世新1,刘文亮1,2,魏成阶1,韩 昱1,21.中国科学院遥感应用研究所遥感科学国家重点实验室,北京 1001012.中国科学院研究生院,北京 100049摘 要 青海玉树7.1级地震使当地人民群众的生命和财产受到严重损失。
利用多光谱遥感技术获取数据范围广、手段多等优势,以地震前后不同空间分辨率的航空和航天多光谱遥感影像作数据源,通过遥感和G IS 技术的应用,对玉树地震的构造背景,地震重灾区的房屋建筑倒塌、场地震害、生命线工程等震害信息进行遥感监测和分析,并对监测区内毁坏严重的土木结构房屋分布、寺庙建筑损毁情况以及地裂缝滑坡、崩塌、碎屑流、塌陷等灾害的空间分布、规模、对道路等设施的影响进行了详细的评估。
最后结合震害遥感评估结果,对震后恢复重建规划及实施从房屋建筑群烈度设防、房屋建筑群的具体选址以及房屋建筑的结构等方面提出了建议。
关键词 多光谱遥感;玉树地震;震害;评估中图分类号:T P75 文献标识码:A D OI :10.3964/j .issn .1000-0593(2011)04-1047-05 收稿日期:2010-05-14,修订日期:2010-08-03 基金项目:中国科学院应急项目-国家玉树地震灾后恢复重建“资源环境承载能力评价”,中国科学院知识创新重要方向项目(KZCX2-YW -Q03-07),国家高技术研究发展计划(863计划)项目(2009AA12Z101)资助作者简介:王福涛,1983年生,中国科学院遥感应用研究所博士研究生 *通讯联系人 e -mail :z houyi @irsa .ac .cn引 言 我国处在环太平洋地震带和欧亚地震带之间,是世界上地震灾害最严重的国家之一。
基于多光谱遥感的青海玉树地震震害监测与评估
冲乡局 部 ; 般灾 区 : 树县 上拉秀 乡、下 拉秀镇 、小苏 莽 一 玉
乡 、毛庄 乡 的局 部 和称 多 县 拉 布 乡 、 武 镇 的 大 部 ( 图 1 歇 如 所
示 ) 。
过从 可见 光到热红 外不同的狭窄波段区感应 能量 ,分别获 得 地物在不 同谱段 上影像 的遥感技术 。多光 谱遥感 具有 的数据 获取 范围广 、速度快 、手段多 、更新 周期短 和多 方位 动态监 测等优势 ,为快速完成地震灾害调查 与评估 提供 了一种新 的 高效技术 手段 ,尤其为救 灾 、减灾 、恢复 重建决 策提供 可靠
的基 础 信 息 方 面 较 传 统 的 实 地 调 查 方 法 具 有 独 特 的 技 术 优
势 , 2 。
1 研究 区域和数据
Fi 1 Re i n o e o e monio i n g. g o fr m t t rng a d
21 0 0年 4月 1 4日 7时 4 9分 , 国 青 海 省 玉 树 藏 族 自治 我 州 玉 树 县 发 生 了 Ms. 级 地 震 ,仪 器 震 中 为 北 纬 3 . 。 71 3 2,东
图 1 所 示 ) O 。
地震烈度为Ⅸ度 强。
4 结 论 与建 议
玉 树 地震 发生 后 , 用 上 述 多 种 不 同 分 辨 率 的多 光 谱 遥 利 感 数 据 源 , 地 震 极 重 灾 区 的 房 屋 建 筑 倒 塌 、场 地 震 害 、 对 生
QO —7 ,国家高技术研究发展计 划( 6 30 ) 8 3计划) 目( O 9 项 2 O AA1 Z 0 ) 2 1 1资助
青海玉树地震灾区地质灾害监测预警浅析
青海玉树地震灾区地质灾害监测预警浅析谢宗英【摘要】玉树7.1级地震不仅造成大量人员伤亡和财产损失,还造成岩体松动,并引发了大量崩塌、滑坡、泥石流等地质灾害。
通过监测获取了崩滑体变形信息,掌握了崩滑体演变过程和泥石流危险信息,为地质灾害分析评价、预测预报及工程治理等提供可靠的资料和科学依据。
%The destructive earthquake occurred in Yushu,Qinghai province,on Apr.14,2010,caused heavy losses in life and property and great geological disaster(such as collapse,landslide and debris flow).And the geological deformation information was monitored,and the results can be used as reliable data and scientific basis for disaster analysis and forecast.【期刊名称】《高原地震》【年(卷),期】2011(023)003【总页数】3页(P60-62)【关键词】青海;玉树7.1级地震;地质灾害:监测预警【作者】谢宗英【作者单位】青海省地质环境监测总站,青海西宁810000【正文语种】中文【中图分类】P315.92010年4月14日7时49分,青海玉树发生里氏7.1级地震,震源深度14 km,震中位于玉树县城西北16 km。
该地震造成玉树州所辖玉树县、称多县、囊谦县、杂多县、治多县、曲麻莱县受灾面积达26 500 km2,重灾区及极重灾区面积4 900 km2;使玉树州、县政府所在地结古镇基础设施和生命线工程系统遭受严重破坏,居民住房几乎全部倒塌,人民生命财产蒙受巨大损失。
监测预警是防灾减灾的有效手段,也是在防治工程费用十分有限的条件下经济可行的减灾措施。
玉树地震台前兆观测资料分析
玉树地震台前兆观测资料分析发表时间:2018-10-15T09:33:20.200Z 来源:《知识-力量》6中作者:尕松拉达[导读] 简述了玉树地震台前兆观测的现状,选取2015年1月至2017 年12月产出的各项数据资料并进行分析,主要从前兆观测中所受到的环境干扰、人为干扰及观测技术系统进行了分析,通过对周边干扰的排除,分析出对前兆观测干扰(青海省玉树州地震局玉树地震台,青海玉树 816000)摘要:简述了玉树地震台前兆观测的现状,选取2015年1月至2017 年12月产出的各项数据资料并进行分析,主要从前兆观测中所受到的环境干扰、人为干扰及观测技术系统进行了分析,通过对周边干扰的排除,分析出对前兆观测干扰的原因,在数据记录特征上对干扰分类,对其采取合理、有效的解决措施,在观测资料的使用价值上得以提升。
关键词:前兆观测;资料分析;干扰分析引言地震前兆观测包括地形变观测、地震电磁观测和地下流体观测。
不管是模拟观测还是数字化观测都面临各类环境因素人类活动的干扰,在提炼地震前兆的判据过程中,为了排除干扰影响,要了解观测点周围的环境变化(邱泽华,2010)。
地震前兆观测的目的主要是捕捉震前异常信息,进行地震预测及相关科学研究,服务于防震减灾事业。
地震前兆观测就是持续产出相关数据,用于寻找有用的、有价值的前兆信号,但在数据产出的过程中,总会有不协调的因素出现,那就是各种各样的干扰,其中有的干扰很容易被分辨;而有的干扰要想搞清,就不得不投入大量人力;还有的干扰在记录特征上,如果不仔细加以研究,甚至会被确定为地震前兆异常,所以,干扰问题应该引起足够重视。
因此某种意义上在正常动态中也包含有一定的干扰异常。
目前,地震工作者的首要任务就是要了解和掌握地震前兆观测中各类干扰源的性质和特征是。
本文研究立足于玉树地震台前兆观测学科,通过将台站2015至2017的前兆资料进行梳理、分析,找到前兆观测资料中的干扰,并将不同性质的干扰进行分类,分析同一干扰源对不同测项有无同步影响。
2010年4月14日青海玉树地震灾害特点与启示
630北京师范大学学报(自然科学版)Jo urnal of Beijing N or mal U niv ersity (N atural Science)201010 46(5)2010年4月14日青海玉树地震灾害特点与启示*刘吉夫1,2) 史培军1) 范一大3) 张垲铭1,2)(1)北京师范大学地表过程与资源生态国家重点实验室,100875,北京;2)北京师范大学减灾与应急管理研究院,100875,北京;3)民政部国家减灾中心,100053,北京)摘要 青海玉树7 1级地震发生后,国家减灾委立即组织专家赴玉树开展现场调查与评估工作.本文在现场调查基础上,阐述了这次发生在高海拔、少数民族聚居区地震灾害的主要特点,分析了造成重大人员伤亡和经济损失的主要原因,在此基础上,对正在开展的恢复重建总体规划和专项规划提出了一些参考建议.关键词 玉树地震;地震灾害;评估;恢复重建*科技部 十一五 科技支撑计划课题资助项目(2008BAK49B0402);地表过程与资源生态国家重点实验室团队重点课题资助项目(2009 TD 02)收稿日期:2010 05 10青海玉树7 1级地震造成青海省玉树州玉树县、治多县、称多县、曲麻莱县、杂多县、囊谦县和四川省石渠县等共7个县受灾.极重灾区为玉树县结古镇.地震发生后,中国地震局和国家减灾委相继启动I 级地震应急响应.根据国务院抗震救灾总指挥部总体部署,国家减灾委立即派出专家组开展地震灾害评估工作.在为期一周的现场调查工作中,工作组在高分辨率遥感影象资料基础上,开展了细致的房屋和基础设施评估工作,获得了房屋以及基础设施等破坏和损失的一手数据,为顺利圆满完成玉树地震灾害损失评估报告打下基础.根据调查,此次地震共造成各类房屋破坏面积达500多万m 2,经济损失巨大.本文主要介绍玉树地震房屋破坏情况,分析造成破坏的原因,并提出了恢复重建的建议.1 房屋主要结构类型灾区房屋主要结构类型有:钢混结构、空心砖混结构、空心砖木结构、土木结构和片石结构.其中钢混结构房屋占10%左右,空心砖混结构占15%左右,空心砖木结构占30%左右,土木结构和片石结构占45%左右,片石结构仅占少数.可见,空心砖木结构和土木结构房屋是灾区的主要建筑类型,也是广大藏民最主要的居住类型.空心砖是四孔空心砖,这和2008年汶川地震中在四川灾区所见的大量的两孔空心砖大小(30cm !20cm !20cm )相似,是当地生产主要的建筑材料.木料是当地的另外一种大量使用的建筑材料,木结构房屋并没有按照中国典型的穿斗形式建造,仅仅简单固定后搁在砖墙或者土墙上.2 房屋主要破坏特点2 1 钢混结构房屋 钢混结构房屋一般属于单位用房或者宾馆酒店等,建造成本高,根据现场调查,平均造价为2000元∀m-2.房屋破坏特点是房屋整体倾斜(图1),或者是一层被完全压跨(图2),但没有发生倒塌.灾区钢混结构房屋破坏率为30%.图1 玉树州某单位营房倾斜2 2 空心砖混结构 砖混结构主要是由空心砖墙(或砖柱)、水泥预制板、现浇钢混横梁、地圈梁等构件建成的房子.根据现场调查,这类房屋平均造价为1500元∀m -2,造价比较高.主要为寺院建筑、临街商铺和城镇中的民房.地震时破坏较严重,但倒塌的不多(图3,图4).灾区空心砖混结构房屋破坏率为60%.2 3 空心砖木结构 空心砖木结构是由空心砖柱与砖墙砌筑成墙体,屋顶由木梁及苇席、草芥等建成的房屋.这类房屋在灾区量大面广,是主要的民居类型.经调查发现,这类房屋在灾区大量被破坏,倒塌数量极多(图5).空心砖木结构房屋破坏率达到85%.第5期刘吉夫等:2010年4月14日青海玉树地震灾害特点与启示631图2 玉树县香巴拉宾馆一楼完全被压跨图3 临街商铺完全破坏图4民房被震歪图5 空心砖木结构民房被震坏2 4 土木结构房屋 土木结构是当地农村最普遍的房屋建筑类型,包括砖柱土坯承重墙体房屋和木柱土坯承重墙体房屋.主要由干打垒或土坯墙夹杂少量空心砖等砌筑成墙体,房梁直接搁在墙体上,屋顶由木梁及苇席、草芥等建成,承重结构主要是土墙.这些房屋为防止漏雨和室内保温,大多在屋顶铺有比较厚的土,其自重比较大,而且根据当地的风俗习惯,以5开间房屋居多.这种房屋遇到地震时一般是墙倒屋塌.灾区该类房屋建筑量大面广,是本次地震灾害损失最为严重的房屋,一般都倒塌,没有完好的(图6).灾区土木结构房屋破坏率达到100%.632 北京师范大学学报(自然科学版)第46卷图6 土木结构房屋被震坏2 5 片石结构房屋 片石结构房屋主要分布在山坡等地方,由墙体主要由麻石、泥浆等砌成,屋盖则和土木结构类似.灾区这类结构房屋数量不多,部分为居住用房,多数作为仓房、畜棚、牛粪房.破坏率达到100%.图7 片石结构房屋被震坏3 特例情况除了以上破坏情况外,灾区有一类房屋却基本没有遭到地震破坏.这类房屋就是2009年建成使用的农牧民安居房.农牧民安居房是国家一项重要工程,由国家根据相关标准和要求统一设计、施工,面积60m 2,造价一般为4 8万元(不含土地购置费),结构为空心砖混结构(图8).而农牧民为了增加使用面积,自己搭建的附属用房则全部破坏(图9).这说明按照标准建设的房屋具有一定的抗震能力.该类房屋基本完好.4 破坏原因分析玉树位于青藏高原东部,属于三江源自然保护区范围.地形以山地为主,平均海拔4493m,95%人口为藏族,社会经济水平相对落后.通天河、扎曲河、巴曲河在玉树县境内流过.地貌以高山峡谷和山原地带为主,间有许多小盆地和湖盆.县城结古镇就位于狭长的图8 废墟中屹立的农牧民安居房(2009年建成)图9 农牧民安居房(2009年建成)(左)和自建房(右)破坏情况对比高山峡谷中.由于地处高原,水泥、钢筋、砖木等建筑原材料成本和人力资本相对较高,造成当地建筑成本偏高.这些因素导致大量民房在建设中为了节约成本而不考虑抗震问题,因此在地震中造成重大房屋损失.经过现场拉网式普查,我们分析,除了抗震设防意识缺失外,直接导致房屋严重破坏的主要原因有:1)基础浅 很多房屋的地基都非常浅,尤其是民房,基本没有挖地基,而是直接在地表以上用石块、片石等垒至一定高度,再在上面砌空心砖.这种地基刚性第5期刘吉夫等:2010年4月14日青海玉树地震灾害特点与启示633不足,柔性有余,根本经受不住地震的振动.这是大量房屋破坏的一个重要原因.2)水泥用量少,大多直接用泥浆 由于水泥价格昂贵,在砌墙时水泥用量非常少,很多房屋在空心砖之间直接用泥浆做黏合剂,造成承重墙本身很脆弱,无法有效抵抗地震力的影响.3)藏式屋盖沉重 藏式屋盖往往是钢筋混凝土浇筑,配以琉璃瓦装饰,外观非常漂亮,但是非常沉重;而土木结构房屋屋顶为了保暖需要则覆以大量黄土,使承重墙或柱难以承受其重量.在地震中,大量房屋被沉重的屋盖压垮,废墟中仅能见到屋盖就是例证.另外,强梁弱柱在钢筋混凝土结构房屋破坏中是屡见不鲜的.图1和图2说明的就是这个道理.4)房屋密集,人口众多 由于灾区位于峡谷地带,中间往往有河流穿过,适宜建房的空间就被挤压在宽不足1000m的河流两岸和山坡地带.大量房屋密密麻麻拥挤在一起,大量人口聚居在这些房屋中.房屋倒塌产生的多米诺骨牌效应在灾区最常见.灾区可见成片成片的房屋倒塌,造成重大财产损失和人员伤亡.5 结论与建议根据以上分析和现场调查评估,我们得到了一些启示,在编制灾区恢复重建总规划和专项规划可供参考和借鉴.首先,应该大力提高藏民抗震意识,深入普及抗震技术.我们在灾区考察评估时发现,很多藏民都认为地震离他们是非常遥远的事情,几乎没有抗震意识.而且往往是建房子省钱,内部装修却富丽堂皇.如果能普及一些基本的抗震经验,比如汶川地震后在四川省广为推广的 构造柱加圈梁的农房建设模式,许多破坏的房屋在这次地震中就可幸免.其次,借鉴农牧民安居工程成功经验.农牧民安居工程能够成功抵御这次地震,主要原因是政府按照抗震设防标准进行了设计和施工,这说明不论什么结构的房子,按标准和不按标准进行建设,地震时结果完全不一样.第三,恢复重建过程中应考虑藏式建筑特点.藏式建筑具有典型、鲜明的少数民族特色,在恢复重建过程中应该加以保留下来,关键是提高其抗震设防能力.第四,加强高原少数民族地区基础数据普查力度.在现场调查和灾害评估过程中,发现高原少数民族地区很多基础数据缺乏,没有公信力,比如玉树县结古镇到底有多少人口?有很多版本的数据,使用起来非常困难.这个问题在开展灾害评估工作后一直困扰着我们.因此强化基础数据普查,增强防灾减灾能力,是今后高原少数民族地区需要迫切解决的问题.6 参考文献[1] GB/T18208 2#2001.地震现场工作第2部分:建筑物安全鉴定[S].北京:中国标准出版社,2001[2] GB/T18208 4#2005.地震现场工作第4部分:直接灾害损失评估[S].北京:中国标准出版社,2005FEATURES AND REVELATIO N OF THE APRIL14,2010YUSHU EARTHQUAKE DISASTER IN QINGHAI PROVINCELIU Jif u1,2) SHI Peijun1) FAN Yida3) ZH ANG Kaiming1,2)(1)State Key Lab oratory of Earth Su rface Process es an d Res ou rce Ecology(Beijing Normal U niver sity),100875,Beijing,China;2)Academy of Disaster Reduction an d Em ergency M anagemen t,Beijing Norm al University,100875,Beijing,China;3)Nation al Disas ter Reduction Center,M inistry of Civil Affairs,100053,Beijing,Ch ina)Abstract After the magnitude7 1Yushu earthquake in Qinghai prov ince,the National Disaster Reduction Co mmittee org anized ex perts imm ediately to conduct field investig ation and loss evaluation.Based on field investig ation,this paper descr ibes the main characteristics of the earthquake,w ith causes fo r significant casualties and m ajo r economic lo sses analyzed.The paper g iv es som e sug gestions for the ong oing reconstruction of the over all planning and special planning.Key words Yushu earthquake;earthquake disaster;assessment;reconstruction。
- 1、下载文档前请自行甄别文档内容的完整性,平台不提供额外的编辑、内容补充、找答案等附加服务。
- 2、"仅部分预览"的文档,不可在线预览部分如存在完整性等问题,可反馈申请退款(可完整预览的文档不适用该条件!)。
- 3、如文档侵犯您的权益,请联系客服反馈,我们会尽快为您处理(人工客服工作时间:9:00-18:30)。
1007-4619 (2010) 05-1038-15 Journal of Remote Sensing 遥感学报Received : 2010-05-28; Accepted : 2010-06-19Foundation : National 863 High Technology Research and Development Program (No. 2009AA12Z145) and National Great Surveying and Mapping Sci-entific Special Project (Airborne multi-band and multi-polarization interferometric SAR mapping system).First author biography : ZHANG Jixian (1965— ), male, professor, President of Chinese Academy of Surveying and Mapping. He received PhD from Wuhan Technical University of Surveying and Mapping, China. His current research interests include photogrammetry and remote sensing, image processing, resources and environmental monitoring by remote sensing, etc. He has published 5 books and about 200 papers. E-mail: zhangjx@SAR remote sensing monitoring of the Yushu Earthquake disastersituation and the information service systemZHANG Jixian, HUANG Guoman, LIU JipingChinese Academy of Surveying and Mapping , Beijing 100830, ChinaAbstract: The SAR system with its all-weather and all-time imaging capabilities emerged as a very important remote sensingdata source for earthquake monitoring and disaster relief. After the recently occurred earthquake in Yushu county, Qinghai province, an airborne SAR system equipped with X-band dual antenna interferometric sensor and P-band fully polarized sensor has been successfully used in disaster monitoring and relief actions. The system is the first airborne SAR system with full intel-lectual property owned by China. This paper summarizes the Yushu Earthquake remote sensing monitoring and information ser-vice system, including the data, processing methodologies and information service. The emphasis is put on the application of airborne SAR images to disaster information extraction and assessment. First, the parameters characterizing the content of earthquake disaster remote sensing monitoring are determined, which include the information of urban and rural residence, in-frastrcucture, geological disasters and farmland damage. The processing methodologies of optical and SAR data for earthquake disaster information interpretation, mapping and risk evaluation are presented. The process chain consists of quick geometric processing, change detection, quick target interpretation and quick spatial risk assessment for disaster. On the basis of the earth-quake information including those extracted from remotely sensed images and other existing social and geospatial data, a system of Yushu Earthquake disaster situation geographic information service has been developed, to facilitate the management, visu-alization, and statistical analysis of the earthquake disaster information.Key words: Yushu Earthquake, SAR, remote sensing, disaster monitoring and assessment CLC number: TP79 Document code: A1 INTRODUCTIONChina is an earthquake country. Therefore, it is vital to ef-fectively monitor and to assess earthquake disaster situationpromptly after the earthquake, which can help protect against losses of lives and property. Synthetic Aperture Radar (SAR) is an important and indispensable technical means for disaster precaution, alleviation and relief at both national and regional levels because of its all-weather and all-time capability (Liu et al., 2010). After the Ms 8.0 Wenchuan Earthquake happened on May 12, 2008, Chinese Academy of Surveying and Mapping developed a Geographic Information Service System on Wen-chuan Earthquake Disaster Situation, and achieved the man-agement, visualization, and statistical analysis on earthquake disaster information. But at that time, SAR data was mainly provided by foreign countries, and its spatial-resolution was also limited.At 7:49 AM, April 14, 2010, there happened a Ms 7.1 earthquake in Yushu county, Qinghai province. The emergencypreplan supported by surveying and mapping was immediately launched by State Bureau of Surveying and Mapping. An air-borne SAR system equipped with X-band dual antenna inter-ferometric sensor and P-band fully polarized sensor quick re-sponded and was successfully used in disaster monitoring and relief actions. The system is the first airborne SAR system with full intellectual property owned by China, where Chinese Academy of Surveying and Mapping is the leading developer. It took advantage of its all-weather capability and no limitation on flight height for image spatial-resolution, while avoiding the space and time occupied by rescue aircrafts. About 2000km 2 X-band and P-band airborne SAR images with 0.5m and 1m resolution were acquired after 12 air routes of two sorties. By quick geometric processing, quick data quality analysis, quick change detection, and detailed target interpretation on SAR images, technical supports were provided for earthquake relief, disaster assessment, and reconstruction planning.On the basis of the practical work in Yushu Earthquake dis-aster situation monitoring, this paper puts the emphasis on theZHANG Jixian et al.: SAR remote sensing monitoring of the Yushu Earthquake disaster situation and the information service system 1039methods and technical flow of SAR image processing in the application of monitoring and assessment of earthquake disaster situation. The existing problems are also analyzed.2 METHODS AND TECHNICAL FLOW2.1 Overall technical flowThe overall technical flow of establishing the earthquake disaster situation information service system of Yushu in Qing-hai Province by SAR technology is illustrated in Fig. 1. The main processes include image preprocessing, disaster informa-tion interpretation, multi-source information integration, and information service system construction.Fig. 1 Overall technical flow2.1.1 Image preprocessingBy preprocessing remote sensing images, especially SAR images, the image quality is improved. The preprocessing in-cludes image enhancement, image transformation, fast geomet-ric rectification, image registration, image fusion, projection transformation, image mosaicking, DOM production, etc.2.1.2 Disaster information interpretationBy integrating the semi-automatic information extraction results and visual interpretation results, the damages areas are completely outlined, which provides foundations for statistical analysis on disaster situation. At the same time, the interpreta-tion accuracy for different type disaster situation parcels is dis-cussed.2.1.3 Multi-source information integrationBy geo-object association on the interpreted objects, non-spatial data spatialization, thematic data registry, and space-time consistence processing, the disaster situation infor-mation including texts, statistics, images and multimedia is seamlessly integrated.2.1.4 Information service system constructionBased on the governmental geographical information plat-form “Geowindows”, the disaster situation information service system of Yushu in Qinghai Province is constructed by function integration packaging, system interface development, process design and function development.2.2 Fundamental dataAerial photos, satellite images, fundamental geographic data, and thematic data of Yushu area are collected. SPOT5 image, IKONOS image and airborne SAR data before and after earth-quake are used for interpretation. Detailed information for the adopted data is:(1) Airborne SAR data: X-band dual antenna interferometric data and P-band fully polarized data.(2) Optical image data: SPOT5 image and IKONOS image before and after earthquake, and aerial photos after earthquake.(3) 1︰50000 scale fundamental geographic data.(4) Field work data from State Bureau of Surveying and Mapping and Ministry of Land and Resources, population data, social economic data, hydrological data, geological data, etc.2.3 Technical methods2.3.1 Monitoring criteria for disaster situationMulti-platform, multi-temporal, and multi-sensor remote sensing images including satellite images, digital aerial photos, airborne X-band/P-band SAR images, and UA V digital images are acquired in this monitoring work. The existing 1︰50000 and 1︰10000 scale fundamental geographic data, population distribution data, social economic data, as well as thematic maps in the fields of land resources, transportation, hydrology, geology, agriculture and forestry of earthquake-affected areas are also collected. The monitoring criteria for disaster situation are established by referring the existing criteria on fundamental geographic data production, land resources inventory, geologi-cal hazard monitoring by remote sensing (Chinese Geological Survey, 2008), etc.In the earthquake-affected areas, high-spatial resolution im-ages and SAR images are mainly used for the following types of fast investigation by remote sensing:(1) Town, and rural built-up.(2) Infrastructure: transportation and communications sys-1040 Journal of Remote Sensing 遥感学报 2010, 14(5)tems, water and power lines, and public institutions including schools, post offices, etc.(3) Geological hazards and environmental information, in-cluding landslides and debris flow.(4) Damages on farmlands and forests.2.3.2 Multi-source data integration for remote sensing monitoringThe acquired optical image can cover only limited region of the disaster affected area. In order to monitor the whole disaster affected area, the multi-source remote sensing data should be used. Digital optical images of the center of Jiegu town were acquired, so optical images are the main remote sensing data source and SAR data is used as auxiliary data. The monitoring of the edge of Jiegu town mainly uses SAR data as well as op-tical images taken before the earthquake. In this work, the monitoring order is first the concentrated residential areas, and then the scattered settlements in rural areas. The multi-source data including SAR images, aerial photos and satellite images are used together to cover the whole area and to perform the fast and accurate image interpretation. Firstly, the coverage extent of the acquired images is analyzed. Then, imaging proc-essing and polarization synthesis are performed. Finally, geo-metric rectification, fusion, mosaicking, etc. are carried out. Where, self-developed software “SARMapper” is used for SAR image processing, and module “PixelGrid” of self-developed software “ImageInfo” is used for optical image processing. Different types of images often have big contrast on color, so images are superimposed directly and then interpreted under GIS environment (Zhang et al., 2008), which greatly reduces workload and data volume during network transmission.2.3.3 Complementary advantages of SAR image interpretationand optical image interpretationSAR images have interpretation advantages on enclosed pasture and its surrounding settlements, iron tower and facilities. However, collapsed housed can be easily seen on optical im-ages. By utilizing the complementary advantages of SAR image interpretation and optical image interpretation, which is illus-trated in Fig. 2, the earthquake situation of Yushu county is accomplished.2.3.4 Fast interpretation of SAR imageSAR system has all-weather and all-time imaging capabili-ties. After earthquake, SAR images of disaster affected areas are acquired. By comparing with the optical images acquired before earthquake, change information before and after earth-quake can be obtained, which can be further used for quick monitoring on typical ground objects. X-band and P-band SAR images are used for earthquake situation interpretation. After earthquake, there are lots of collapsed houses in Jiegu town, which can be easily interpreted on SAR images. Besides, dam-aged roads, bridges, dams, and facilities such as power towers can also be clearly seen on SAR images, which are shown in Fig. 3.2.3.5 Disaster risk analysisDisaster rating scheme can be obtained according to model superposition in GIS software using its powerful spatial analy-sis functions (Hu et al., 2007). By using this map, the visual interpretation results can be further verified.3 DISASTER SITUA TION SAR REMOTE SENSINGMONITORING AND THE SERVICE SYSTEMAiming at the Yushu Earthquake, this paper investigates the image preprocessing methods, including image enhancement, image transformation, geometric rectification, image registration, image fusion, projection transformation, image mosaicking and so on. The methods of extracting houses, bridges, schools, power facilities, rivers, landslides from remote sensing images are discussed. Multi-source and heterogeneous disaster infor-mation integration method and Yushu Earthquake disaster situation geography information system construction method are introduced. The service system can provide technical sup-port to the governmental management and decision-making.3.1 Disaster situation information interpretation ofYushu EarthquakeThe service system mainly achieves the disaster situation information interpretation, such as collapsed houses, collapsed schools, broken bridges, destroyed power facilities, damaged rivers, damaged dams, landslides, etc. The information of the collapsed schools in Yushu is shown in Fig.4. The monitoring time and the area of parcels are shown in the information box of Fig.4. Fig. 5 shows the information of the collapsed houses. The area of parcels and the order of the parcels are shown in the information box of Fig.5.3.2 Multi-source emergency information integrationof Yushu EarthquakeBased on the basic geospatial data, a unified data integration framework is established. Through data transformation, projec-tion transformation, data resample, geographical association, space-time consistence processing, spatial index generation, earthquake disaster situation information of collapsed houses, collapsed schools, broken bridges, damaged power facilities, damaged rivers, damaged dams, landslides, population, and earthquake intensity, is seamlessly integrated with multi-scale spatial information. At last, the Yushu Earthquake disaster situation information database has been formed. The integration of earthquake intensity information and spatial information is shown in Fig.6. The sensible radius is 83.6807 km (Fig. 6).3.3 Emergency information service system constructionof Yushu EarthquakeBased on fundamental geographic information service inter- face, using B/S structure, the service system integrates informa- tion display, query, comparison and analysis, which achieves two-dimensional map and three-dimensional scene efficiently display of Yushu Earthquake area based on network environ- ment, multi-resolution aerial and space image information display,ZHANG Jixian et al.: SAR remote sensing monitoring of the Yushu Earthquake disaster situation and the information service system 1041Fig. 2 Complementary interpretation advantages between SAR image and optimal image1042 Journal of Remote Sensing 遥感学报 2010, 14(5)Fig. 3 Interpretation plots of SAR image at X and P band about Yushu earthquake disaster situation(a) X band; (b) P bandFig. 4 Information of the collapsed schoolsZHANG Jixian et al .: SAR remote sensing monitoring of the Yushu Earthquake disaster situation and the information service system 1043Fig. 5 Information of the collapsed housesFig. 6 Integration of earthquake intensity information andspatial informationYushu Earthquake information query, earthquake monitoring and analysis, comparison of images before and after earthquake, spatial statistics of population and economic, query of the dis-tribution of the enterprises and institutions in earthquake area and so on. The system can provide information services for disaster relief, disaster planning and reconstruction. The house comparison of images before and after earthquake is shown in Fig.7. From the Fig.7, The earthquake inflicted severe damage on the houses. The 3D aerial photograph image after earthquake is shown in Fig.8.3.4 ApplicationAccording to the unified arrangements of the earthquake re-lief work by the State Bureau of Surveying and Mapping, Chi-nese Academy of Surveying and Mapping launched emergency response mechanism of governmental geographic information services immediately. In accordance with the work ideas of “information integration, decision support, rapid delivery”, the earthquake geographic information system of Yushu in Qinghai Province is fast set up. The system was deployed in General1044Journal of Remote Sensing 遥感学报 2010, 14(5)Fig. 7 House comparison of images before and after earthquake(a) before earthquake; (b) after earthquakeFig. 8 3D aerial photograph image after earthquakeOffice of the e-government of the State Council and directly provided information services for the country based on geo-graphic earthquake monitoring, comprehensive inquiry, and statistical analysis. On April 18, according to the arrangements of the State Bureau of Surveying and Mapping, the system was installed in Qinghai Bureau of Surveying and Mapping, and provided services to the Qinghai provincial party committee leaders, Qinghai provincial leader and Qinghai emergency of-fice, provincial Development and Reform Commission, De-partment of Land and Resources through the network. On April19, the system was installed in China Earthquake Administra-tion and National Disaster Reduction Centre of the Ministry of Civil Affairs. It provides services directly to the professional sectors for the earthquake analysis and evaluation.4 CONCLUSIONS AND DISCUSSIONAirborne SAR system has the advantage of flexibility, which is fully reflected in this earthquake disaster monitoring. Lots of data of disaster affected areas are quickly acquired shortly afterZHANG Jixian et al.: SAR remote sensing monitoring of the Yushu Earthquake disaster situation and the information service system 1045the earthquake. This data are processed and then are used in the information service system construction to realize the interpre-tation, assessment and service for the comprehensive disaster situation information. Airborne SAR system plays an important role in disaster relief actions.Because the available continuously running GPS base sta-tion is far away from the disaster affected area, the accuracy of differential GPS positioning is not good enough and the tech-nique of geometric rectification without GCPs cannot be used at that moment. In this work, GCPs collected from optical im-ages are used for SAR image rectification.SAR image cannot be interpreted as easily as optical images. The interpreters must be trained in order to effectively under-stand information which is conveyed on SAR images. The ab-solute visual interpretation is time-consuming. Besides, because of the influence of SAR imaging mechanism and speckle noises, the subjective errors of visual interpretation are unavoidable (Yang et al., 2004). Therefore, interpretation algorithms of ground objects which are adapted for SAR images should be researched in order to improve the interpretation accuracy.Acknowledgement: Special thanks to the supervision of State Bureau of Surveying and Mapping. Many thanks to the cooperation, support and help provided by Zhongfei General Aviation Corporation, Institute of Electronics, Chinese Acad-emy of Sciences (IECAS), No.38 Research Institute of China Electronics Technology Group Corporation (CETC), and Center for Earth Observation and Digital Earth, Chinese Academy of Sciences (CEODE). Yan Qin, Zhang Li, Wang Liang, Zhao Zheng, Wang Zhang, Liu Zhengjun, Zhang Yonghong and Meng Wenli worked in Chinese Academy of Surveying and Mapping were also involved in this work. Here we express our thanks for their excellent work!REFERENCESChinese Geological Survey. 2008. Technical Requirements for Emer-gent Spaceborne Remote Sensing Geological Disaster Investiga-tion (Draft)Hu D Y, Li J, Chen Y H. 2007. GIS-based landslide spatial prediction methods, a case study in cameron highland, malaysia. Journal of Remote Sensing, 11(6): 852—859Liu Y H, Qu C Y, Shan X J, Song X G, Zhang G F and Zhang G H.2010. Application of SAR data to damage identification of the Wenchuan earthquake. Acta Seismologica Sinica, 32(2): 214—223 Yang W, Sun H, Xu X, Cao Y F and Xu G. 2004. Study on target inter-pretation in SAR image. Systems Engineering and Electronics, 26(10): 1336—1339Zhang J X, Liu Z J and Liu J P. 2008. Remote sensing monitoring of the Wenchuan Earthquake Disa ster Situation and the Information Service System. Journal of Remote Sensing, 12(6): 871—8761046Journal of Remote Sensing 遥感学报 2010, 14(5)收稿日期: 2010-05-28; 修订日期: 2010-06-19基金项目:国家863计划 (编号: 2009AA12Z145)和国家重大测绘科技专项“机载多波段多极化干涉SAR 测图系统”。
