wireshark 实验 Getting Started
《使用wireshark进行网络协议分析》实验报告
《计算机网络与通信原理》课程实验报告Wireshark和其它的图形化嗅探器使用基本类似的界面,整个窗口被分成三个部分:最上面为数据包列表,用来显示截获的每个数据包的总结性信息;中间为协议树,用来显示选定的数据包所属的协议信息;最下边是以十六进制形式表示的数据包内容,用来显示数据包在物理层上传输时的最终形式。
(2)Wireshark的显示过滤器显示过滤器可以根据1)协议2)是否存在某个域3)域值4)域值之间的比较来查找感兴趣的数据包。
注意:捕获过滤器(Capture Filters)和显示过滤器(Display Filters)的语法规则是不同的。
值比较表达式可以使用下面的操作符来构造:●eq ==,如ip.addr==10.1.10.20●ne !=,如ip.addr!=10.1.10.20●gt >,如frame.pkt_len>10●lt <,如frame.pkt_len<10●ge >=,如frame.pkt_len>=10●le <=,如frame.pkt_len<=10可以使用下面的逻辑操作符将表达式组合起来:●and &&逻辑与,如ip.addr=10.1.10.20 && tcp.flag.fin●or || 逻辑或,如ip.addr=10.1.10.20||ip.addr=10.1.10.21●not ! 逻辑非,如!llc例如:IP 地址是192.168.2.10 的主机,它所接收收或发送的所有的HTTP 报文,那么合适的Filter(过滤器)就是:ip.addr == 192.168.2.10 && http。
提示:Filter的背景显示出表达式的合法与否,绿色为合法,红色为否。
(3)菜单Capture的Options说明Interface:选择采集数据包的网卡IP address:选择的网卡所对应的IP地址Link-layer header type:数据链路层的协议,在以太网中一般是Ethernet IIBuffer size:数据缓存大小设定,默认是1M字节。
计算机网络实验三参考答案

1. What is the IP address and TCP port number used by the client computer (source) that is transferring the file to ? To answer this questio n, it’s probably easiest to select an HTTP message and explore the details of the TCP packet used to carry this HTTP message, using the “details of the selected packet header window” (refer to Figure 2 in the “Getting Started with Wireshark” Lab if you’re uncertain about the Wireshark windows).Ans: IP address:192.168.1.102 TCP port:11612. What is the IP address of ? On what port number is it sending and receiving TCP segments for this connection?Ans: IP address:128.119.245.12 TCP port:80If you have been able to create your own trace, answer the following question:3. What is the IP address and TCP port number used by your client computer(source) to transfer the file to ?ANS: IP address :10.211.55.7 TCP port:492654. What is the sequence number of the TCP SYN segment that is used to initiate the TCP connection between the client computer and ? What is it in the segment that identifies the segment as a SYN segment?ANS: sequence number: 0 Syn Set = 1 identifies the segment as a SYN segment5. What is the sequence number of the SYNACK segment sent by to the client computer in reply to the SYN? What is the value of the ACKnowledgement field in the SYNACK segment? How did determine that value? What is it in the segment that identifies the segment as a SYNACK segment?ANS: The sequence number: 0ACKnowledgement number : 1 which is sequence number plus 1Both the sequence flag and the ACKnowledgement flag been set as 1, identifies the segment as SYNACK segment.6. What is the sequence number of the TCP segment containing the HTTP POST command? Note that in order to find the POST command, you’ll need to dig into the packet content field at the bottom of the Wireshark window, looking for a segment with a “POST” within its DATA field.Ans: The sequence number : 17. Consider the TCP segment containing the HTTP POST as the first segment in the TCP connection. What are the sequence numbers of the first six segments in the TCP connection (including thesegment containing the HTTP POST)? At what time was each segment sent? When was the ACK for each segment received? Given the difference between when each TCP segment was sent, and when its acknowledgement was received, what is the RTT value for each of the six segments? What is the EstimatedRTT value (see page 249 in text) after the receipt of each ACK? Assume that the value of the EstimatedRTT is equal to the measured RTT for the first segment, and then is computed using the EstimatedRTT equation on page 249 for all subsequent segments.Note: Wireshark has a nice feature that allows you to plot the RTT for each of the TCP segments sent. Select a TCP segment in the “listing of captured packets” window that is being sent from the client to the server. Then select: Statistics->TCP Stream Graph- >Round Trip Time Graph.Segment 1 Segment 2 Segment 3Segment 4Segment 5Segment 6After Segment 1 : EstimatedRTT = 0.02746After Segment 2 : EstimatedRTT = 0.875 * 0.02746 + 0.125*0.035557 = 0.028472 After Segment 3 : EstimatedRTT = 0.875 * 0.028472 + 0.125*0.070059 = 0.033670 After Segment 4 : EstimatedRTT = 0.875 * 0.033670 + 0.125*0.11443 = 0.043765 After Segment 5 : EstimatedRTT = 0.875 * 0.043765 + 0.125*0.13989 = 0.055781 After Segment 6 : EstimatedRTT = 0.875 * 0.055781 + 0.125*0.18964 = 0.072513 8. What is the length of each of the first six TCP segments?(see Q7)9. What is the minimum amount of available buffer space advertised at the received for the entire trace? Does the lack of receiver buffer space ever throttle thesender?ANS:The minimum amount of buffer space (receiver window) advertised at for the entire trace is 5840 bytes;This receiver window grows steadily until a maximum receiver buffer size of 62780 bytes.The sender is never throttled due to lacking of receiver buffer space by inspecting this trace.10. Are there any retransmitted segments in the trace file? What did you check for (in the trace) in order to answer this question?ANS: There are no retransmitted segments in the trace file. We can verify this by checking the sequence numbers of the TCP segments in the trace file. All sequence numbers are increasing.so there is no retramstmitted segment.11. How much data does the receiver typically acknowledge in an ACK? Can youidentify cases where the receiver is ACKing every other received segment (seeTable 3.2 on page 257 in the text).ANS: According to this screenshot, the data received by the server between these two ACKs is 1460bytes. there are cases where the receiver is ACKing every other segment 2920 bytes = 1460*2 bytes. For example 64005-61085 = 292012. What is the throughput (bytes transferred per unit time) for the TCP connection? Explain how you calculated this value.ANS: total amount data = 164091 - 1 = 164090 bytes#164091 bytes for NO.202 segment and 1 bytes for NO.4 segmentTotal transmission time = 5.455830 – 0.026477 = 5.4294So the throughput for the TCP connection is computed as 164090/5.4294 = 30.222 KByte/sec.13. Use the Time-Sequence-Graph(Stevens) plotting tool to view the sequence number versus time plot of segments being sent from the client to the server. Can you identify where TCP’s slow start phase begins and ends, and where congestion avoidance takes over? Comment on ways in which the measured data differs from the idealized behavior of TCP that we’ve studied in the text.ANS: Slow start begins when HTTP POST segment begins. But we can’t identify where TCP’s slow start phase ends, and where congestion avoidance takes over.14. Answer each of two questions above for the trace that you have gathered when you transferred a file from your computer to ANS: Slow start begins when HTTP POST segment begins. But we can’t identify where TCP’s slow start phase ends, and where congestion avoidance takes over.。
HTTP原理实验及Wireshark基础实验报告
石家庄经济学院《计算机网络原理》实验报告实验名称 HTTP原理实验及Wireshark基础班级 5131090302学号 513109030222 姓名谈家鸣指导教师赵建立一、实验目的:掌握常用的协议分析器/wirshark的基本应用方法;分析并验证HTTP的工作过程。
二、实验要求:要求能启动,停止捕获数据;能把捕获的数据保存成pcap文件;能利用显示过滤器,显示指定类型的数据包;能对数据包的结构(头+数据)有初步认识。
三、基本实验步骤:首先启动Wirshark,并进入捕获状态;其次,利用已有的或自己编写的网络应用程序产生想要的数据流;第三,在得到想要的数据流后,让Wireshark停止捕获;第四步,如果需要,应该把捕获到的数据包序列保存至磁盘,以pacp 文件形式;最后,针对捕获到的数据包序列进行分析,可根据具体情况来调用Wireshark提供的种种工具,比如:Display/显示过滤器,FollowTcpStream/跟踪TCP流,FollowUDPStream/跟踪UDP流,FolwGraph/流图分析等。
四、实验过程与分析:首先启动Wirshark,选择网卡,并进入捕获状态;如图6-1,6-2所示图6-1 interface图6-2 选择设备启动数据捕获;如图6-3所示图6-3 capture-start访问石家庄经济学院网站,开始捕获数据包;如图6-4 ,6-5所示在开始截取数据包的时候迅速打开需要截取数据的网页,这样减少数据流量,便于后期的筛选。
图6-4图6-5 获取数据包得到数据包后,停止捕获数据,并从数据包中筛选出http流量包如图6-6 在Filter输入http,筛选出http协议的数据包。
总共五个数据包,客户端是192.168.0.115,服务器端是202.206.144.3,后面的info字段都是“get”特征,表示五个包都是web客户端向web服务器发送的http请求消息。
Wireshark的使用实验报告

Wireshark的使用实验报告计算机网络实验报告学院计算机与通信工程学院专业网络工程班级1401班学号20 姓名实验时间:2016.3.30一、实验名称:网络协议分析器Wireshark二、实验目的:了解Wireshark的界面组成,熟悉Wireshark的基本操作,掌握捕捉过滤器和显示过滤器的使用三、实验环境:局域网中的任意一台主机PC(10.64.44.35),Wireshark version1.10.11.四、实验步骤:使用Wireshark捕获数据包的一般过程为:步骤1:启动Wireshark。
步骤2:开始分组捕获。
单击工具栏的按钮,出现如图所示对话框,进行系统参数设置。
单击“Start”按钮开始进行分组捕获。
Wireshark配置界面步骤3:单击捕获对话框中的“stop”按钮,停止分组捕获。
此时,Wireshark 主窗口显示已捕获的局域网内的所有协议报文。
步骤4:筛选具体的协议。
如要筛选的协议为http协议,只需要在协议筛选框中输入“http”,单击“Apply”按钮,分组列表窗口将只显示HTTP协议报文。
这样就可以捕获所需要的数据包,并可以借助Wireshark提供的功能的网络数据包的分析。
用Wireshark分析协议的一般过程:在抓包完成后,可以利用显示过滤器找到感兴趣的包,也可根据协议、是否存在某个域、域值、域值之间的关系来查找感兴趣的包。
Wireshark的显示过滤器:可以使用表1.1所示的操作符来构造显示过滤器英文名称运算符中文名称应用举例 eq = = 等于Ip.addr==10.1.10.20ne != 不等于Ip.addr!=10.1.10.20gt > 大于Frame.pkt_len>10 lt < 小于Frame.pkt_len<10 ge >= 大于等于Frame.pkt_len>=10le <= 小于等于Frame.pkt_len<=10也可以使用下面逻辑操作符将表达式组合起来:逻辑与and(&&): 如ip.addr==10.1.10.20&&tcp.flag.fin;逻辑或or(II) 如 ip.addr==10.1.10.20IIip.addr==10.10.21.1;异或xor(^^)如 ip.addr==10.1.10.20xor ip.addr==10.10.21.1;逻辑非!:如!Llc。
wireshark抓包实验报告
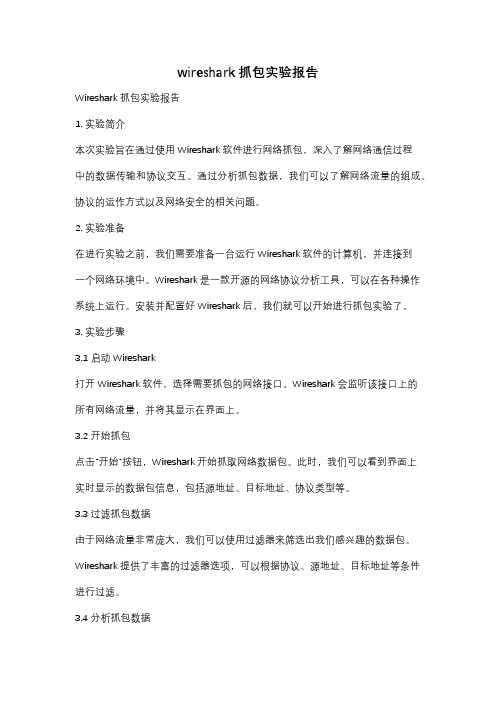
wireshark抓包实验报告Wireshark抓包实验报告1. 实验简介本次实验旨在通过使用Wireshark软件进行网络抓包,深入了解网络通信过程中的数据传输和协议交互。
通过分析抓包数据,我们可以了解网络流量的组成、协议的运作方式以及网络安全的相关问题。
2. 实验准备在进行实验之前,我们需要准备一台运行Wireshark软件的计算机,并连接到一个网络环境中。
Wireshark是一款开源的网络协议分析工具,可以在各种操作系统上运行。
安装并配置好Wireshark后,我们就可以开始进行抓包实验了。
3. 实验步骤3.1 启动Wireshark打开Wireshark软件,选择需要抓包的网络接口。
Wireshark会监听该接口上的所有网络流量,并将其显示在界面上。
3.2 开始抓包点击“开始”按钮,Wireshark开始抓取网络数据包。
此时,我们可以看到界面上实时显示的数据包信息,包括源地址、目标地址、协议类型等。
3.3 过滤抓包数据由于网络流量非常庞大,我们可以使用过滤器来筛选出我们感兴趣的数据包。
Wireshark提供了丰富的过滤器选项,可以根据协议、源地址、目标地址等条件进行过滤。
3.4 分析抓包数据选中某个数据包后,Wireshark会显示其详细信息,包括协议分层、数据字段等。
通过分析这些信息,我们可以了解数据包的结构和内容,进一步了解网络通信的细节。
4. 实验结果与讨论在实验过程中,我们抓取了一段时间内的网络流量,并进行了分析。
通过对抓包数据的观察和解读,我们得出了以下几点结果和讨论:4.1 协议分层在抓包数据中,我们可以清晰地看到各种协议的分层结构。
从物理层到应用层,每个协议都承担着不同的功能和责任。
通过分析协议分层,我们可以了解协议之间的关系,以及它们在网络通信中的作用。
4.2 数据传输过程通过分析抓包数据,我们可以追踪数据在网络中的传输过程。
我们可以看到数据包从源地址发送到目标地址的路径,了解中间经过的路由器和交换机等设备。
Wireshark入门教程及破解

抓客户端证书演示
抓客户端证书演示
直接抓客户端证书演示
找到有效数据包
• Certificate,client key exchange, certificate verify, change cipher spec
展开数据包 ,找到对于数据段
• 2. 按住Ctrl键,然后点击所有需要桥接的LAN网段。然后,右击所选择局域网连接 对象中的一个,然后点击“桥接” 。
• 3. 右键单击网桥,然后单击“属性”。 如果系统提示您输入管理员密码或进行确 认,请键入密码或提供确认。
• 4. 在选项卡的“适配器”下,选中要向网桥中添加的每个连接旁边的复选框,然后 单击“确定”。
• Display filter在抓包后设置,是第二层过滤器,过滤规则更细,帮助迅 速准确地找到所需记录。
Display filter 语法
语 法:
Protocol
String 1
例 子:
ftp
passive
String 2
ip
Comparison operator
Value
Logical Operations
Wireshark 使用心得
饮水思源
感谢Ethereal和 Wireshark的创建者 Gerald Combs以及为 它们的发展而做出 努力的上千名开发 人员!
下载/安装
/downloa d.html
Winpcap
• 自动检测操作系统中已经安装的版本,建议 卸载旧版本,使用安装包中的最新版本。
Windows XP
• 1. 通过单击“开始”按钮,再依次单击“设置”、“控制面板”,打开“网络连接”。 • 2. 按住Ctrl键,然后点击所有需要桥接的LAN网段。然后,右击所选择局域网连接对象
网络安全实验wireshark网络监听实验
实验报告机将写有目的的主机地址的数据包直接发向目的主机,或者当网络中的一台主机同外界的主机通信时,源主机将写有目的的主机IP地址的数据包发向网关。
但这种数据包并不能在协议栈的高层直接发送出去,要发送的数据包必须从TCP/IP协议的IP层交给网络接口,也就是所说的数据链路层。
网络接口不会识别IP地址的。
在网络接口由IP层来的带有IP地址的数据包又增加了一部分以太祯的祯头的信息。
在祯头中,有两个域分别为只有网络接口才能识别的源主机和目的主机的物理地址这是一个48位的地址,这个48位的地址是与IP地址相对应的,换句话说就是一个IP地址也会对应一个物理地址。
对于作为网关的主机,由于它连接了多个网络,它也就同时具备有很多个IP地址,在每个网络中它都有一个。
而发向网络外的祯中继携带的就是网关的物理地址。
Ethernet中填写了物理地址的祯从网络接口中,也就是从网卡中发送出去传送到物理的线路上。
如果局域网是由一条粗网或细网连接成的,那么数字信号在电缆上传输信号就能够到达线路上的每一台主机。
再当使用集线器的时候,发送出去的信号到达集线器,由集线器再发向连接在集线器上的每一条线路。
这样在物理线路上传输的数字信号也就能到达连接在集线器上的每个主机了。
当数字信号到达一台主机的网络接口时,正常状态下网络接口对读入数据祯进行检查,如果数据祯中携带的物理地址是自己的或者物理地址是广播地址,那么就会将数据祯交给IP层软件。
对于每个到达网络接口的数据祯都要进行这个过程的。
但是当主机工作在监听模式下的话,所有的数据祯都将被交给上层协议软件处理。
当连接在同一条电缆或集线器上的主机被逻辑地分为几个子网的时候,那么要是有一台主机处于监听模式,它还将可以接收到发向与自己不在同一个子网(使用了不同的掩码、IP地址和网关)的主机的数据包,在同一个物理信道上传输的所有信息都可以被接收到。
在UNIX系统上,当拥有超级权限的用户要想使自己所控制的主机进入监听模式,只需要向Interface(网络接口)发送I/O控制命令,就可以使主机设置成监听模式了。
wireshark抓包实验报告
wireshark抓包实验报告Wireshark抓包实验报告引言:网络是现代社会中不可或缺的一部分,人们在日常生活中几乎无时无刻不在使用网络。
然而,网络的复杂性使得网络问题的排查变得困难。
Wireshark作为一款强大的网络抓包工具,可以帮助我们深入分析网络数据包,从而更好地理解和解决网络问题。
本文将介绍Wireshark的基本原理和使用方法,并通过实际抓包实验来验证其功能和效果。
一、Wireshark的基本原理Wireshark是一款开源的网络协议分析工具,可以运行在多个操作系统上。
它通过捕获网络接口上的数据包,并将其解析成可读的形式,以便我们进行深入分析。
Wireshark支持多种协议,包括以太网、无线网络、TCP/IP等,使得我们能够全面了解网络通信的细节。
二、Wireshark的使用方法1. 下载和安装Wireshark可以从其官方网站上免费下载,根据自己的操作系统选择合适的版本进行安装。
安装完成后,打开Wireshark并选择要抓包的网络接口。
2. 抓包设置在开始抓包之前,我们需要进行一些设置以确保我们能够捕获到想要分析的数据包。
首先,我们可以设置抓包过滤器来过滤出特定的数据包,以减少不必要的干扰。
其次,我们可以选择是否启用深度分析,以获取更详细的协议信息。
3. 开始抓包一旦设置完成,我们可以点击“开始”按钮开始抓包。
Wireshark将开始捕获网络接口上的数据包,并将其显示在主界面上。
我们可以看到每个数据包的详细信息,包括源IP地址、目标IP地址、协议类型等。
4. 数据包分析Wireshark提供了丰富的功能和工具,使得我们可以对抓包的数据包进行深入分析。
我们可以通过点击每个数据包来查看其详细信息,并根据需要进行过滤、排序和搜索。
此外,Wireshark还提供了统计功能,帮助我们了解网络流量的情况。
三、实验验证为了验证Wireshark的功能和效果,我们进行了一次抓包实验。
实验中,我们使用Wireshark抓取了一段时间内的网络数据包,并进行了分析。
Wireshark抓包工具计算机网络实验
Wireshark抓包⼯具计算机⽹络实验实验⼀ Wireshark 使⽤⼀、实验⽬的1、熟悉并掌握Wireshark 的基本使⽤;2、了解⽹络协议实体间进⾏交互以及报⽂交换的情况。
⼆、实验环境与因特⽹连接的计算机,操作系统为Windows ,安装有Wireshark 、IE 等软件。
三、预备知识要深⼊理解⽹络协议,需要观察它们的⼯作过程并使⽤它们,即观察两个协议实体之间交换的报⽂序列,探究协议操作的细节,使协议实体执⾏某些动作,观察这些动作及其影响。
这种观察可以在仿真环境下或在因特⽹这样的真实⽹络环境中完成。
Wireshark 是⼀种可以运⾏在Windows, UNIX, Linux 等操作系统上的分组嗅探器,是⼀个开源免费软件,可以从/doc/d2530113af45b307e871976b.html 下载。
运⾏Wireshark 程序时,其图形⽤户界⾯如图2所⽰。
最初,各窗⼝中并⽆数据显⽰。
Wireshark 的界⾯主要有五个组成部分:图1命令和菜单协议筛选框捕获分组列表选定分组⾸部明细分组内容左:⼗六进制右:ASCII 码●命令菜单(command menus):命令菜单位于窗⼝的最顶部,是标准的下拉式菜单。
●协议筛选框(display filter specification):在该处填写某种协议的名称,Wireshark 据此对分组列表窗⼝中的分组进⾏过滤,只显⽰你需要的分组。
●捕获分组列表(listing of captured packets):按⾏显⽰已被捕获的分组内容,其中包括:分组序号、捕获时间、源地址和⽬的地址、协议类型、协议信息说明。
单击某⼀列的列名,可以使分组列表按指定列排序。
其中,协议类型是发送或接收分组的最⾼层协议的类型。
●分组⾸部明细(details of selected packet header):显⽰捕获分组列表窗⼝中被选中分组的⾸部详细信息。
包括该分组的各个层次的⾸部信息,需要查看哪层信息,双击对应层次或单击该层最前⾯的“+”即可。
wireshark 实验 TCP
Wireshark Lab: TCP Version: 2.0© 2007 J.F. Kurose, K.W. Ross. All Rights ReservedComputer Networking: A Top-down Approach, 4th edition.In this lab, we’ll investigate the behavior of TCP in detail. We’ll do so by analyzing a trace of the TCP segments sent and received in transferring a 150KB file (containing the text of Lewis Carrol’s Alice’s Adventures in Wonderland) from your computer to a remote server. We’ll study TCP’s use of sequence and acknowledgement numbers for providing reliable data transfer; we’ll see TCP’s congestion control algorithm – slow start and congestion avoidance – in action; and we’ll look at TCP’s receiver-advertised flow control mechanism. We’ll also briefly consider TCP connection setup and we’ll investigate the performance (throughput and round-trip time) of the TCP connection between your computer and the server.Before beginning this lab, you’ll probably want to review sections 3.5 and 3.7 in the text.11. Capturing a bulk TCP transfer from your computer to a remote serverBefore beginning our exploration of TCP, we’ll need to use Wireshark to obtain a packet trace of the TCP transfer of a file from your computer to a remote server. You’ll do so by accessing a Web page that will allow you to enter the name of a file stored on your computer (which contains the ASCII text of Alice in Wonderland), and then transfer the file to a Web server using the HTTP POST method (see section 2.2.3 in the text). We’re using the POST method rather than the GET method as we’d like to transfer a large amount of data from your computer to another computer. Of course, we’ll be running Wireshark during this time to obtain the trace of the TCP segments sent and received from your computer.1 All references to the text in this lab are to Computer Networking: A Top-down Approach, 4th edition.Do the following:•Start up your web browser. Go the /wireshark-labs/alice.txt and retrieve an ASCII copy of Alice in Wonderland. Store this filesomewhere on your computer.•Next go to /wireshark-labs/TCP-wireshark-file1.html.•You should see a screen that looks like:•Use the Browse button in this form to enter the name of the file (full path name) on your computer containing Alice in Wonderland (or do so manually).Don’t yet press the “Upload alice.txt file” button.•Now start up Wireshark and begin packet capture (Capture->Options) and then press OK on the Wireshark Packet Capture Options screen (we’ll not need toselect any options here).•Returning to your browser, press the “Upload alice.txt file” button to upload the file to the server. Once the file has been uploaded, a shortcongratulations message will be displayed in your browser window.•Stop Wireshark packet capture. Your Wireshark window should look similar to the window shown below.If you are unable to run Wireshark on a live network connection, you can download a packet trace file that was captured while following the steps above on one of the author’s computers2. You may well find it valuable to download this trace even if you’ve captured your own trace and use it, as well as your own trace, when you explore the questions below.2 Download the zip file /wireshark-labs/wireshark-traces.zip and extract the file tcp-ethereal-trace-1. The traces in this zip file were collected by Wireshark running on one of the author’s computers, while performing the steps indicated in the Wireshark lab. Once you have downloaded the trace, you can load it into Wireshark and view the trace using the File pull down menu, choosing Open, andthen selecting the tcp-ethereal-trace-1 trace file.2. A first look at the captured traceBefore analyzing the behavior of the TCP connection in detail, let’s take a high level view of the trace.•First, filter the packets displayed in the Wireshark window by entering “tcp”(lowercase, no quotes, and don’t forget to press return after entering!) into thedisplay filter specification window towards the top of the Wireshark window. What you should see is series of TCP and HTTP messages between your computer and . You should see the initial three-way handshake containing a SYN message. You should see an HTTP POST message and a series of “HTTP Continuation” messages being sent from your computer to . Recall from our discussion in the earlier HTTP Wireshark lab, that is no such thing as an HTTP Continuation message – this is Wireshark’s way of indicating that there are multiple TCP segments being used to carry a single HTTP message. You should also see TCP ACK segments being returned from to your computer.Answer the following questions, by opening the Wireshark captured packet file tcp-ethereal-trace-1 in /wireshark-labs/wireshark-traces.zip (that is download the trace and open that trace in Wireshark; see footnote 2). Whenever possible, when answering a question you should hand in a printout of the packet(s) within the trace that you used to answer the question asked. Annotate the printout to explain your answer. To print a packet, use File->Print, choose Selected packet only, choose Packet summary line, and select the minimum amount of packet detail that you need to answer the question.1.What is the IP address and TCP port number used by the client computer (source)that is transferring the file to ? To answer this question, it’sprobably easiest to select an HTTP message and explore the details of the TCPpacket used to carry this HTTP message, using the “details of the selected packet header window” (refer to Figure 2 in the “Getting Started with Wireshark” Lab if you’re uncertain about the Wireshark windows).2.What is the IP address of ? On what port number is it sendingand receiving TCP segments for this connection?If you have been able to create your own trace, answer the following question:3.What is the IP address and TCP port number used by your client computer(source) to transfer the file to ?Since this lab is about TCP rather than HTTP, let’s change Wireshark’s “listing of captured packets” window so that it shows information about the TCP segments containing the HTTP messages, rather than about the HTTP messages. To have Wireshark do this, select Analyze->Enabled Protocols. Then uncheck the HTTP box and select OK. You should now see an Wireshark window that looks like:This is what we’re looking for - a series of TCP segments sent between your computer and . We will use the packet trace that you have captured (and/or the packet trace tcp-ethereal-trace-1 in /wireshark-labs/wireshark-traces.zip; see footnote 2) to study TCP behavior in the rest of this lab.3. TCP BasicsAnswer the following questions for the TCP segments:4.What is the sequence number of the TCP SYN segment that is used to initiate theTCP connection between the client computer and ? What is itin the segment that identifies the segment as a SYN segment?5.What is the sequence number of the SYNACK segment sent by to the client computer in reply to the SYN? What is the value of theACKnowledgement field in the SYNACK segment? How did determine that value? What is it in the segment that identifies the segment as aSYNACK segment?6.What is the sequence number of the TCP segment containing the HTTP POSTcommand? Note that in order to find the POST command, you’ll need to dig into the packet content field at the bottom of the Wireshark window, looking for asegment with a “POST” within its DATA field.7.Consider the TCP segment containing the HTTP POST as the first segment in theTCP connection. What are the sequence numbers of the first six segments in theTCP connection (including the segment containing the HTTP POST)? At whattime was each segment sent? When was the ACK for each segment received?Given the difference between when each TCP segment was sent, and when itsacknowledgement was received, what is the RTT value for each of the sixsegments? What is the EstimatedRTT value (see page 249 in text) after thereceipt of each ACK? Assume that the value of the EstimatedRTT is equal to the measured RTT for the first segment, and then is computed using theEstimatedRTT equation on page 249 for all subsequent segments.Note: Wireshark has a nice feature that allows you to plot the RTT foreach of the TCP segments sent. Select a TCP segment in the “listing ofcaptured packets” window that is being sent from the client to the server. Then select: Statistics->TCP Stream Graph->Round Trip Time Graph.8.What is the length of each of the first six TCP segments?39.What is the minimum amount of available buffer space advertised at the receivedfor the entire trace? Does the lack of receiver buffer space ever throttle thesender?10.Are there any retransmitted segments in the trace file? What did you check for (inthe trace) in order to answer this question?11.How much data does the receiver typically acknowledge in an ACK? Can youidentify cases where the receiver is ACKing every other received segment (seeTable 3.2 on page 257 in the text).12.What is the throughput (bytes transferred per unit time) for the TCP connection?Explain how you calculated this value.3 The TCP segments in the tcp-ethereal-trace-1 trace file are all less that 1460 bytes. This is because the computer on which the trace was gathered has an Ethernet card that limits the length of the maximum IP packet to 1500 bytes (40 bytes of TCP/IP header data and 1460 bytes of TCP payload). This 1500 byte value is the standard maximum length allowed by Ethernet. If your trace indicates a TCP length greater than 1500 bytes, and your computer is using an Ethernet connection, then Wireshark is reporting the wrong TCP segment length; it will likely also show only one large TCP segment rather than multiple smaller segments. Your computer is indeed probably sending multiple smaller segments, as indicated by the ACKs it receives. This inconsistency in report edsegment lengths is due to the interaction between the Ethernet driver and the Wireshark software. We recommend that if you have this inconsistency, that you perform this lab using the provided trace file.4. TCP congestion control in actionLet’s now examine the amount of data sent per unit time from the client to the server. Rather than (tediously!) calculating this from the raw data in the Wireshark window, we’ll use one of Wireshark’s TCP graphing utilities - Time-Sequence-Graph(Stevens) - to plot out data.•Select a TCP segment in the Wireshark’s “listing of captured-packets” window.Then select the menu : Statistics->TCP Stream Graph-> Time-Sequence-Graph(Stevens). You should see a plot that looks similar to the following plot,which was created from the captured packets in the packet trace tcp-ethereal-trace-1 in /wireshark-labs/wireshark-traces.zip (seefootnote 2):Here, each dot represents a TCP segment sent, plotting the sequence number ofthe segment versus the time at which it was sent. Note that a set of dots stackedabove each other represents a series of packets that were sent back-to-back by the sender.Answer the following questions for the TCP segments the packet trace tcp-ethereal-trace-1 in /wireshark-labs/wireshark-traces.zipe the Time-Sequence-Graph(Stevens) plotting tool to view the sequencenumber versus time plot of segments being sent from the client to the server. Can you identify where TCP’s slowstart phase begins and ends, and where congestion avoidance takes over? Comment on ways inwhich the measured data differs from the idealized behavior of TCP that we’ve studied in the text.14.Answer each of two questions above for the trace that you have gathered whenyou transferred a file from your computer to 。
- 1、下载文档前请自行甄别文档内容的完整性,平台不提供额外的编辑、内容补充、找答案等附加服务。
- 2、"仅部分预览"的文档,不可在线预览部分如存在完整性等问题,可反馈申请退款(可完整预览的文档不适用该条件!)。
- 3、如文档侵犯您的权益,请联系客服反馈,我们会尽快为您处理(人工客服工作时间:9:00-18:30)。
Wireshark Lab: Getting Started Version: 2.0© 2007 J.F. Kurose, K.W. Ross. All Rights ReservedComputer Networking: A Top-down Approach, 4th edition.“Tell me and I forget. Show me and I remember. Involve me and I understand.”Chinese proverbOne’s understanding of network protocols can often be greatly deepened by “seeing protocols in action” and by “playing around with protocols” – observing the sequence of messages exchanged between two protocol entities, delving down into the details of protocol operation, and causing protocols to perform certain actions and then observing these actions and their consequences. This can be done in simulated scenarios or in a “real” network environment such as the Internet. The Java applets that accompany this text take the first approach. In these Wireshark labs1, we’ll take the latter approach. You’ll be running various network applications in different scenarios using a computer on your desk, at home, or in a lab. You’ll observe the network protocols in your computer “in action,” interacting and exchanging messages with protocol entities executing elsewhere in the Internet. Thus, you and your computer will be an integral part of these “live” labs. You’ll observe, and you’ll learn, by doing.The basic tool for observing the messages exchanged between executing protocol entities is called a packet sniffer. As the name suggests, a packet sniffer captures (“sniffs”) messages being sent/received from/by your computer; it will also typically store and/or display the contents of the various protocol fields in these captured messages. A packet sniffer itself is passive. It observes messages being sent and received by applications and protocols running on your computer, but never sends packets itself. Similarly, received packets are never explicitly addressed to the packet sniffer. Instead, a packet sniffer receives a copy of packets that are sent/received from/by application and protocols executing on your machine.1 Earlier versions of these labs used the Ethereal packet analyzer. In May 2006, the developer of Ethereal joined a new company, and had to leave the Ethereal® trademarks behind. He then created the Wireshark network protocol analyzer, a successor to Ethereal®. Since Ethereal® is no longer being actively maintained or developed, we have thus switched these labs over to Wireshark with the 4th edition of our text.Figure 1 shows the structure of a packet sniffer. At the right of Figure 1 are the protocols (in this case, Internet protocols) and applications (such as a web browser or ftp client) that normally run on your computer. The packet sniffer, shown within the dashed rectangle in Figure 1 is an addition to the usual software in your computer, and consists of two parts. The packet capture library receives a copy of every link-layer frame that is sent from or received by your computer. Recall from the discussion from section 1.5 in the text (Figure 1.202) that messages exchanged by higher layer protocols such as HTTP, FTP, TCP, UDP, DNS, or IP all are eventually encapsulated in link-layer frames that are transmitted over physical media such as an Ethernet cable. In Figure 1, the assumed physical media is an Ethernet, and so all upper layer protocols are eventually encapsulated within an Ethernet frame. Capturing all link-layer frames thus gives you all messages sent/received from/by all protocols and applications executing in your computer.Figure 1: Packet sniffer structureThe second component of a packet sniffer is the packet analyzer, which displays the contents of all fields within a protocol message. In order to do so, the packet analyzer must “understand” the structure of all messages exchanged by protocols. For example, suppose we are interested in displaying the various fields in messages exchanged by the HTTP protocol in Figure 1. The packet analyzer understands the format of Ethernet frames, and so can identify the IP datagram within an Ethernet frame. It also understands the IP datagram format, so that it can extract the TCP segment within the IP datagram. Finally, it understands the TCP segment structure, so it can extract the HTTP message contained in the TCP segment. Finally, it understands the HTTP protocol and so, for example, knows that the first bytes of an HTTP message will contain the string “GET,” “POST,” or “HEAD,” as shown in Figure 2.8 in the text.2 Figure numbers refer to figures in the 4th edition of our text.We will be using the Wireshark packet sniffer [/] for these labs, allowing us to display the contents of messages being sent/received from/by protocols at different levels of the protocol stack. (Technically speaking, Wireshark is a packet analyzer that uses a packet capture library in your computer). Wireshark is a free network protocol analyzer that runs on Windows, Linux/Unix, and Mac computers. It’s an ideal packet analyzer for our labs – it is stable, has a large user base and well-documented support that includes a user-guide (/docs/wsug_html_chunked/), man pages (/docs/man-pages/), and a detailed FAQ(/faq.html), rich functionality that includes the capability to analyze hundreds of protocols, and a well-designed user interface. It operates in computers using Ethernet, Token-Ring, FDDI, serial (PPP and SLIP), 802.11 wireless LANs, and ATM connections (if the OS on which it's running allows Wireshark to do so).Getting WiresharkIn order to run Wireshark, you will need to have access to a computer that supports both Wireshark and the libpcap or WinPCap packet capture library. The libpcap software will be installed for you, if it is not installed within your operating system, when you install Wireshark.. See /download.html for a list of supported operating systems and download sitesDownload and install the Wireshark software:•Go to /download.html and download and install the Wireshark binary for your computer.•Download the Wireshark user guide.The Wireshark FAQ has a number of helpful hints and interesting tidbits of information, particularly if you have trouble installing or running Wireshark.Running WiresharkWhen you run the Wireshark program, the Wireshark graphical user interface shown in Figure 2 will de displayed. Initially, no data will be displayed in the various windows.Figure 2: Wireshark Graphical User InterfaceThe Wireshark interface has five major components:•The command menus are standard pulldown menus located at the top of the window. Of interest to us now are the File and Capture menus. The File menu allows you to save captured packet data or open a file containing previouslycaptured packet data, and exit the Wireshark application. The Capture menuallows you to begin packet capture.•The packet-listing window displays a one-line summary for each packet captured, including the packet number (assigned by Wireshark; this is not apacket number contained in any protocol’s header), the time at which the packetwas captured, the packet’s source and destination addresses, the protocol type,and protocol-specific information contained in the packet. The packet listing canbe sorted according to any of these categories by clicking on a column name. The protocol type field lists the highest level protocol that sent or received this packet,i.e., the protocol that is the source or ultimate sink for this packet.•The packet-header details window provides details about the packet selected (highlighted) in the packet listing window. (To select a packet in the packetlisting window, place the cursor over the packet’s one-line summary in the packet listing window and click with the left mouse button.). These details includeinformation about the Ethernet frame (assuming the packet was sent/receiverdover an Ethernet interface) and IP datagram that contains this packet. The amount of Ethernet and IP-layer detail displayed can be expanded or minimized byclicking on the plus-or-minus boxes to the left of the Ethernet frame or IPdatagram line in the packet details window. If the packet has been carried overTCP or UDP, TCP or UDP details will also be displayed, which can similarly beexpanded or minimized. Finally, details about the highest level protocol that sent or received this packet are also provided.•The packet-contents window displays the entire contents of the captured frame, in both ASCII and hexadecimal format.•Towards the top of the Wireshark graphical user interface, is the packet display filter field, into which a protocol name or other information can be entered inorder to filter the information displayed in the packet-listing window (and hencethe packet-header and packet-contents windows). In the example below, we’lluse the packet-display filter field to have Wireshark hide (not display) packetsexcept those that correspond to HTTP messages.Taking Wireshark for a Test RunThe best way to learn about any new piece of software is to try it out! We’ll assume that your computer is connected to the Internet via a wired Ethernet interface. Do the following1.Start up your favorite web browser, which will display your selected homepage.2.Start up the Wireshark software. You will initially see a window similar to thatshown in Figure 2, except that no packet data will be displayed in the packet-listing, packet-header, or packet-contents window, since Wireshark has not yetbegun capturing packets.3.To begin packet capture, select the Capture pull down menu and select Options.This will cause the “Wireshark: Capture Options” window to be displayed, asshown in Figure 3.Figure 3: Wireshark Capture Options Window4.You can use most of the default values in this window, but uncheck “Hide captureinfo dialog” under Display Options. The network interfaces (i.e., the physicalconnections) that your computer has to the network will be shown in the Interface pull down menu at the top of the Capture Options window. In case your computer has more than one active network interface (e.g., if you have both a wireless and a wired Ethernet connection), you will need to select an interface that is being used to send and receive packets (mostly likely the wired interface). After selecting the network interface (or using the default interface chosen by Wireshark), click Start.Packet capture will now begin - all packets being sent/received from/by yourcomputer are now being captured by Wireshark!5.Once you begin packet capture, a packet capture summary window will appear, asshown in Figure 4. This window summarizes the number of packets of various types that are being captured, and (importantly!) contains the Stop button that will allow you to stop packet capture. Don’t stop packet capture yet.Figure 4: Wireshark Packet Capture Window6.While Wireshark is running, enter the URL:/wireshark-labs/INTRO-wireshark-file1.html and have that page displayed in your browser. In order to display this page, your browser will contact the HTTP server at and exchange HTTP messages with the server in order to download this page, as discussed in section2.2 of the text. The Ethernet frames containing these HTTP messages will becaptured by Wireshark.7.After your browser has displayed the INTRO-wireshark-file1.html page, stopWireshark packet capture by selecting stop in the Wireshark capture window.This will cause the Wireshark capture window to disappear and the mainWireshark window to display all packets captured since you began packet capture.The main Wireshark window should now look similar to Figure 2. You now have live packet data that contains all protocol messages exchanged between yourcomputer and other network entities! The HTTP message exchanges with the web server should appear somewhere in the listing of packets captured. But there will be many other types of packets displayed as well (see,e.g., the many different protocol types shown in the Protocol column in Figure 2).Even though the only action you took was to download a web page, there wereevidently many other protocols running on your computer that are unseen by theuser. We’ll learn much more about these protocols as we progress through thetext! For now, you should just be aware that there is often much more going onthan “meet’s the eye”!8.Type in “http” (without the quotes, and in lower case – all protocol names are inlower case in Wireshark) into the display filter specification window at the top of the main Wireshark window. Then select Apply (to the right of where you entered “http”). This will cause only HTTP message to be displayed in the packet-listing window.9.Select the first http message shown in the packet-listing window. This should bethe HTTP GET message that was sent from your computer to the HTTP server. When you select the HTTP GET message, theEthernet frame, IP datagram, TCP segment, and HTTP message headerinformation will be displayed in the packet-header window3. By clicking plus-and-minus boxes to the left side of the packet details window, minimize theamount of Frame, Ethernet, Internet Protocol, and Transmission Control Protocol information displayed. Maximize the amount information displayed about theHTTP protocol. Your Wireshark display should now look roughly as shown inFigure 5. (Note, in particular, the minimized amount of protocol information forall protocols except HTTP, and the maximized amount of protocol information for HTTP in the packet-header window).10.Exit WiresharkCongratulations! You’ve now completed the first lab.3 Recall that the HTTP GET message that is sent to the web server is contained within a TCP segment, which is contained (encapsulated) in an IP datagram, which is encapsulated in an Ethernet frame. If this process of encapsulation isn’t quite clear yet, review section 1.5 in the textFigure 5: Wireshark display after step 9What to hand inThe goal of this first lab was primarily to introduce you to Wireshark. The following questions will demonstrate that you’ve been able to get Wireshark up and running, and have explored some of its capabilities. Answer the following questions, based on your Wireshark experimentation:1.List up to 10 different protocols that appear in the protocol column in theunfiltered packet-listing window in step 7 above.2.How long did it take from when the HTTP GET message was sent until the HTTPOK reply was received? (By default, the value of the Time column in the packet-listing window is the amount of time, in seconds, since Wireshark tracing began.To display the Time field in time-of-day format, select the Wireshark View pulldown menu, then select Time Display Format, then select Time-of-day.)3.What is the Internet address of the (also known as www-)? What is the Internet address of your computer?4.Print the two HTTP messages displayed in step 9 above. To do so, select Printfrom the Wireshark File command menu, and select “Selected Packet Only” and “Print as displayed” and then click OK.。