地理信息系统 专业外语 段落翻译
地信专业英语介绍
Hello,everyone! My name is xx, I come from AnYang, HeNan province. As one of the famous seven ancient capitals in China, AnYang is a beautiful city with many historical monuments. My major is GIS. Now please allow me to introduce some information about my major.My research area is the application of GIS. Geographic Information System, with its excellent spatial data process ability, has attracted a great attention in many aspects. For example, Resource Management, Urban Planning and Management, Emergency Response, Site Selecting Analysis, Distributed Geographic Information Application, and the urban address geo-coding database.During my school time, I learned some knowledge about address geo-coding. Address geo-coding is a kind of geo-coding method based on spatial orientation technique and it provides an information transformation method from described addresses to geographic coordinates, the address or the name of a place, to a location on the earth’s surface.I am also learning how to use Arcgis, the most popular GIS software, to enter and process the spatial data. This software has powerful functions and what I have learned is a tip of the iceberg. So I will keep studying and trying to know well of it.That’s all, thank you!。
中英文地理信息系统(GIS)英语词汇表
accreditation 委派accuracy 准确度acquisition 获取activity patterns 活动模式added value 附加值adjacency邻接Aeolian 伊奥利亚人的, 风的, 风蚀的Age of Discovery 发现的年代aggregation聚合algorithm, definition算法,定义ambiguity 不明确analytical cartography 分析制图application programming interfaces(APIs) 应用编程接口ARCGis 美国ESRI公司开发的世界先进的地理信息系统软件ArcIMS 它是个强大的,基于标准的工具,让你快速设计和管理Internet地图服务ArcInfo 在ArcGIS软件家族中,ArcInfo是GIS软件中功能最全面的。
它包含ArcView和ArcEditor 所有功能,并加上高级空间处理和数据转换ArcNews 美国ESRI向用户终生免费赠送的ArcNews报刊ArcSDE ArcSDE在ESRI GIS软件和DBMS之间提供通道,是一个空间数据引擎ArcUser Magazine 为ESRI用户创建的报刊ArcView 桌面GIS和制图软件,提供数据可视化,查询,分析和集成功能,以及创建和编辑地理数据的能力ARPANET ARPA 计算机网(美国国防部高级研究计划局建立的计算机网)aspatial data 非空间数据?Association of Geographic Information (AGI) 地理信息协会attribute data 属性数据attributes, types 属性,类型attributive geographic data 属性地理数据autocorrelation 自相关Autodesk MapGuide 美国Autodesk公司生产的Web GIS软件Automated mapping/facility management(AM/FM) systems 自动绘图/设备管理系统facilities 设备avatars 化身A VIRIS 机载可见光/红外成像光谱仪azimuthal projections 方位投影batch vectorization 批量矢量化beer consumption 啤酒消费benchmarking 基准Berry, Brianbest fit line 最优线binary counting system 二进制计算系统binomial distribution 二项式分布bivariate Gaussian distribution 二元高斯分布block encoding 块编码Bosnia, repartitioning 波斯尼亚,再分离成两个国家buffering 缓冲区分析Borrough, PeterBusiness and service planning(retailing) application in petroleum and convenience shopping 石油和便利购物的业务和服务规划(零售)应用business drivers 业务驱动business, GIS as 业务,地理信息系统作为Buttenfield, Barbaracadasters 土地清册Callingham, Martincannibalizing 调拨Cartesian coordinate system笛卡尔坐标系Cartograms 统计地图cartographic generalization 制图综合cartographic modeling 地图建模cartometric transformations 量图变换catalog view of database 数据库目录视图census data人口普查数据Census of Population 人口普查central Place Theory 中心区位论central point rule 中点规则central tendency 中心倾向centroid 质心choropleth mapping分区制图choosing a GIS 选择一个地理信息系统class 类别classification generalization 分类综合client 客户端client-server C/S结构客户端-服务器cluster analysis 聚类分析clutter 混乱coastline weave 海岸线codified knowledge 编码知识COGO data 坐标几何数据COGO editing tools 坐标几何编辑工具Collaboration 协作Local level 地方级National level 国家级Collection-level metadata 获取级元数据Commercial-off-the-shelf (COTS) systems 成熟的商业化系统chemas-microsoft-comfficeffice" />>> Commom object request broker architecture (CORBA) 公共对象请求代理体系结构Community, GIS 社区,地理信息系统Competition 竞争Component GIS 组件地理信息系统Component object model (COM) 组件对象模型Computer assisted mass appraisal (CAMA) 辅助大量估价,>>Computer-aided design (CAD)-based GIS 基于计算机辅助制图的地理信息系统Models 数据模型Computer-aided software engineering (CASE) tool 计算机辅助软件工程工具Concatenation 串联Confidence limits 置信界限Conflation 异文合并Conformal property 等角特性Confusion matrix 混淆矩阵Conic projections 圆锥投影Connectivity 连接性Consolidation 巩固Constant term 常数项Contagious diffusion 传染扩散Continuing professional development (CPD) 持续专业发展Coordinates 坐标Copyright 版权Corridor 走廊Cost-benefit analysis 成本效益分析Cost-effectiveness evaluation 成本效率评估Counting method 计算方法Cresswell, PaulCustomer support 客户支持Cylindrical Equidistant Projection 圆柱等距投影Cylindrical projections 圆柱投影> >Dangermond, Jack 美国ESRI总裁>> dasymetric mapping 分区密度制图>>data 数据>>automation 自动化>>capture costs 获取代价>>capture project 获取工程>>collection workflow 采集工作流>> compression 压缩>>conversion 转换>>definition 定义>>geographic, nature of 地理数据,数据的性质>> GIS 地理信息系统>>industry 产业>>integration 集成>>mining 挖掘>>transfer 迁移>>translation 转化>>data model 数据模型>> definition 定义>>levels of abstraction 提取等级>> in practice 实际上>>types 类型>>database 数据库>>definition 定义>>design 设计>>generalization 综合>>global 全球的>>index 索引>>multi-user editing 多用户编辑>> structuring 结构>>database management system (DBMS) 数据库管理系统>>capabilities 能力>>data storage 数据存储>>geographic extensions 地理扩展>>types 类型>>Dayton Accord 达顿协定,1995年12月达顿协定(DAYTON ACCORD)签订,巴尔干和平已经实现,波斯尼亚(包括黑塞哥维那)再被分解成两个国家>>decision support 决策支持>>deductive reasoning 演绎推理>>definitions of GIS 地理信息系统的各种定义>>degrees of freedom 自由度>>density estimation 密度估算>>dependence in space 空间依赖>>desktop GIS 桌面地理信息系统>>desktop paradigms 桌面范例>>Digital Chart of the World (DCW) 世界数字化图>>digital divide 数字鸿沟>>Digital Earth 数字地球>>Digital elevation models (DEMs) 数字高程模型>>Digital line graph (DLG) 数字线划图>>Digital raster graphic (DRG) 数字影像图>>Digital representation 数字表现>>Digital terrain models 数字地形模型>>Digitizing 数字化>>DIME (Dual Independent Map Encoding) program 美国人口调查局建立的双重独立地图编码系统>> Dine CARE >>Discrete objects 离散对象>>Douglas-Poiker algorithm 道格拉斯-普克算法,一种矢量数据抽稀算法>>Dublin Core metadata standard 都柏林核心元数据标准>>Dynamic segmentation 动态分割>>Dynamic simulation models 动态仿真模型>>> >Easting 朝东方>>Ecological fallacy 生态谬误>>e-commerce 电子商业>>editing 编辑>>education 教育>>electromagnetic spectrum 电磁光谱>>ellipsoids 偏振光椭圆率测量仪>>of rotation 旋转的>>emergency evacuation 应急撤退>>encapsulation 封装>>environmental applications 环境应用>>environmental impact 环境影响>>epidemiology 流行病学>>equal area property 等面积特性>>Equator 赤道>>ERDAS ERDAS公司是世界上最大的专业遥感图像处理软件公司,用户遍布100多个国家,软件套数超过17000套。
GIS专业英语原文及翻译结果

Is What You See, What You Get? GeospatialVisualizations Address Scale and UsabilityAashishChaudhary and Jeff BaumesUnlimited geospatial information now is at everyone’s fingertips with the proliferation of GPS-embedded mobile devices and large online geospatial databases. To fully understand these data and make wise decisions, more people are turning to informatics and geospatial visualization, which are used to solve many real-world problems.To effec tively gather information from data, it’s critical to address scalability and intuitive user interactions and visualizations. New geospatial analysis and visualization techniques are being used in fields such as video analysis for national defense, urban planning and hydrology.Why Having Data Isn’t Good Enough AnymorePeople are realizing that data are only useful if they can find the relevant pieces of data to make better decisions. This has broad applicability, from finding a movie to watch to elected officials deciding how much funding to allocate for an aging bridge. Information can easily be obtained, but how can it be sorted, organized, made sense of and acted on? The field of informatics solves this challenge by taking large amounts of data and processing them into meaningful, truthful insights.In informatics, two main challenges arise when computers try to condense information down to meaningful concepts: disorganization and size. Some information is available in neat, organized tables, ready for users to pull out the needed pieces, but most is scattered across and hidden in news articles, blog posts and poorly organized lists.Researchers are feverishly working on new ways to retrieve key ideas and facts from these types of messy data sources. For example, services such as Google News use computers that constantly "read" news articles and posts worldwide, and then automatically rank them by popularity, group them by topic, or organize them based on what the computer thinks is important to viewers. Researchers at places such as the University of California, Irvine, and Sandia National Laboratories are investigating the next approaches to sort through large amounts of documents using powerful supercomputers.The other obstacle is the sheer vo lume of data. It’s difficult to use informatics techniques that only work on data of limited size. Facebook, Google and Twitter have data centers that constantly process huge quantities of information to deliver timely and relevant information and advertisements to each person currently logged on..Figure 1. A collection of videos are displayed without overlap (top). The outline color represents how close each video matches a query. An alternate view (bottom) places thevideos on top of each other in a stack, showing only the strongest match result.Informatics is a key tool, but it’s not enough to simply find these insights that explain the data. Geospatial visualization bridges the gap from computer number-crunching to human understanding. If informatics is compared to finding the paths in a forest, visualization is like creating a visual map of those paths so a person can navigate through the forest with ease.Most people today are familiar with basic geospatial visualizations such as weather maps and Web sites for driving directions. The news media are starting to test more-complex geospatial visualizations such as online interactive maps to help navigate politicians’ stances on issues, exit polls and precinct reports during election times. People are just beginning to see the impact that well-designed geospatial visualizations have on their understanding of the world..Geospatial Visualization in the Real WorldPeople have been looking at data for decades, but the relevant information that accompanies the data has changed in recent years. In late 1999, Esri released a new software suite, ArcGIS, that could use data from various sources. ArcGIS provides an easy-to-use interface for visualizing 2-D and 3-D data in a geospatial context. In 2005, Google Earth launched and made geospatial visualization available to the general public.Geospatial visualization is becoming more significant and will continue to grow as it allows people to look at the totality of the data, not just one aspect. This enables better understanding and comprehension, because it puts the data in context with their surroundings. The following three cases demonstrate geospatial visualization use in real-world scenarios:1. Urban PlanningPlanners use geomodeling and geovisualization tools to explore possible scenarios and communicate their design decisions to team members or the general public. For example, urban planners may look at the presence of underground water and the terrain’s surrounding topology before deciding to build a new suburb. This is relevant for areas around Phoenix, for example, where underground water presence and proximity to a knoll or hill can determine the suitability of a location for construction.Figure 2. Videos from the same location are partially visible, resembling a stack of cards. Each video is outlined by the color representing the degree to which it matches the query.Looking at a 3-D model of a house with its surroundings gives a completely different perspective than just looking at the model of a house by itself. This also can help provide clear solutions to problems, such as changing the elevation of a building’s base to make it stand better.Urban planning is one of the emerging applications of computer-generated simulation. Cities’ rapid growth places a strain on natural resources that sustain growth. Water management, in particular, becomes a critical issue.The East Valley Water Forum is a regional cooperative of water providers east of Phoenix, and it’s designing a water-management plan for the next 100 years. Water resources in this region come from the Colorado River, the Salt River Project, groundwater, and other local and regional water resources. These resources are affected directly and indirectly by local and global factors such as population, weather, topography, etc.To best understand the relationship among water resources and various factors, the Arizona Department of Water Resources analyzes hydrologic data in the region using U.S. Geological Survey MODFLOW software, which simulates the status of underground water resources in the region. For better decision making and effective water management, a comprehensive scientific understanding of the inputs, outputs and uncertainties is needed. These uncertainties include local factors such as drought and urban growth.Looking at numbers or 2-D graphs to understand the complex relationship between input, output and other factors is insufficient in most cases. Integrating geospatial visualizations with MODFLOW simulations, for example, creates visuals that accurately represent the model inputs and outputs in ways that haven’t been previously presented.For such visualizations, two water surfaces are positioned side-by-side—coming from two different simulations—with contour lines drawn on top. In this early prototype, a simple solution—providing a geospatial plane that can be moved vertically—brings the dataset into a geospatial context. This plane includes a multi-resolution map with transparency. Because these water layers are drawn in geospatial coordinates, it matches exactly with the geospatial plane. This enables researchers to quickly see the water supplies of various locations.2. Image and Video AnalysisDefense Advanced Research Projects Agency launched a program, Video and Image Retrieval nd Analysis Tool (VIRAT), for understanding large video collections. The project’s core requirement is to add video-analysis capabilities that perform the following:• Filter and prioritize massive amounts of archived and strea ming video based on events.• Present high-value intelligence content clearly and intuitively to video analysts.• Reduce analyst workload while increasing quality and accuracy of intelligence yield.Visualization is an integral component of the VIRAT system, which uses geospatial metadata and video descriptors to display results retrieved from a database.Analysts may want to look at retrieval result sets from a specific location or during a specific time range. The results are short clips containing the object of interest and its recent trajectory. By embedding these results in a larger spatiotemporal context, analysts can determine whether a retrieved result is important.3. Scientific VisualizationU.S. Army Corps of Engineers’ research organ ization, the Engineer Research and Development Center, is working to extend the functionality of the Computational Model Builder (CMB) environment in the area of simulation models for coastal systems, with an emphasis on the Chesapeake and Delaware bays.The CMB environment consists of a suite of applications that provide the capabilities necessary to define a model (consisting of geometry and attribute information) that’s suitable for hydrological simulation. Their simulations are used to determine the impact that environmental conditions, such as human activities, have on bodies of water.Figure 3. Google Earth was used to display Chesapeake Bay’s relative salt (top) and oxygen (bottom) content (higher concentrations in red).One goal is to visualize simulation data post-processed by CMB tools. Spatiotemporal information, for example, is included in oxygen content and salinity data. Drawing data in geospatial context lets users or analysts see which locations are near certain features, giving the data orientation and scale that can easily be understood. Figure 3 shows the oxygen and salt content of Chesapeake Bay, where red shows higher concentrations and blue shows lower concentrations.Moving ForwardVisualizations that can be understood at all levels will be key in politics, economics, national security, urban planning and countless other fields. As information becomes increasingly complex, it will be harder for computers to extract and display those insights in ways people can understand.More research must be done in new geospatial analysis and visualization capabilities before we drown in our own data. And it’s even more important to educate people in how to use and interpret the wealth of analysis tools already available, extending beyond the basic road map.High schools, colleges and the media should push the envelope with new types of visuals and animations that show data in richer ways. The price of explaining these new views will be repaid when audiences gain deeper insights into the real issues otherwise hidden by simple summaries. Progress isn’t limited by the volume of available information, but by the ability to consume it.翻译:你所看到的,你得到了什么?地理空间可视化的处理规模和可用性作者:AashishChaudhary和包密斯·杰夫无限的空间信息现在就在每个人的指尖,其与扩散的嵌入式GPS移动设备和大型网上地理空间数据库。
地理信息系统专业英语
资源配置 (Resource Configuration)
city utilities
disaster relief materials distribution
energy security ……
In this type of application , GIS is to guarantee the most reasonable allocation of resources and to maximize the efficiency.
find the best locate place for a plant
return
On the consumer level
GIS applications combined with Global Positioning System as well as remote sensing technologies enable us
to
***Find the nearest Starbucks ***Get turn-by-turn directions to the closest gas station. ***Find the best locate place
consumer
Resource management
Mainly applied in agriculture and forestry fields, solve the agriculture and forestry resources questions (such as land area, forests and grasslands) classification, statistical ,distribution, etc. Main answering "localization" and "mode" two kinds of problems.
GIS English
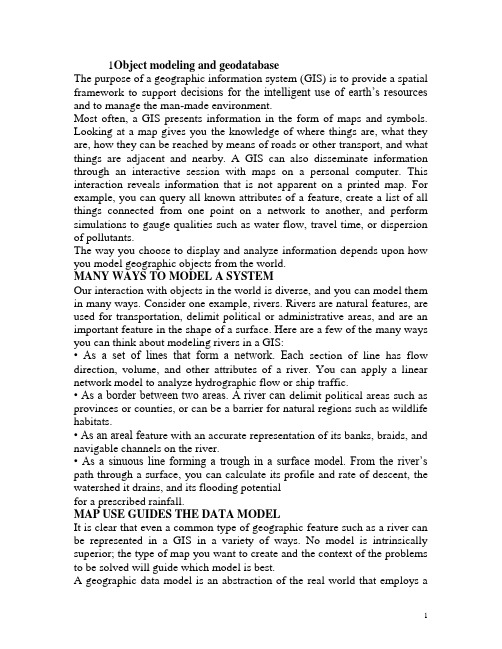
1Object modeling and geodatabaseThe purpose of a geographic information system (GIS) is to provide a spatial framework to support decisions for the intelligent use of earth’s resources and to manage the man-made environment.Most often, a GIS presents information in the form of maps and symbols. Looking at a map gives you the knowledge of where things are, what they are, how they can be reached by means of roads or other transport, and what things are adjacent and nearby. A GIS can also disseminate information through an interactive session with maps on a personal computer. This interaction reveals information that is not apparent on a printed map. For example, you can query all known attributes of a feature, create a list of all things connected from one point on a network to another, and perform simulations to gauge qualities such as water flow, travel time, or dispersion of pollutants.The way you choose to display and analyze information depends upon how you model geographic objects from the world.MANY WAYS TO MODEL A SYSTEMOur interaction with objects in the world is diverse, and you can model them in many ways. Consider one example, rivers. Rivers are natural features, are used for transportation, delimit political or administrative areas, and are an important feature in the shape of a surface. Here are a few of the many ways you can think about modeling rivers in a GIS:• As a set of lines that form a network. Each section of line has flow direction, volume, and other attributes of a river. You can apply a linear network model to analyze hydrographic flow or ship traffic.• As a border between two areas. A river can delimit political areas such as provinces or counties, or can be a barrier for natural regions such as wildlife habitats.• As an areal fe ature with an accurate representation of its banks, braids, and navigable channels on the river.• As a sinuous line forming a trough in a surface model. From the river’s path through a surface, you can calculate its profile and rate of descent, the watershed it drains, and its flooding potentialfor a prescribed rainfall.MAP USE GUIDES THE DATA MODELIt is clear that even a common type of geographic feature such as a river can be represented in a GIS in a variety of ways. No model is intrinsically superior; the type of map you want to create and the context of the problems to be solved will guide which model is best.A geographic data model is an abstraction of the real world that employs aset of data objects that support map display, query, editing, and analysis. ArcInfo 8 introduces a new object-oriented data model—the geodatabase data model—that is capable of representing natural behaviors and relationships of features. To understand the impact of this new model, it is instructive to review three generations of geographic data models.THE CAD DATA MODELThe very first computerized mapping systems drew vector maps with lines displayed on cathode ray tubes and raster maps using overprinted characters on line printers. From this genesis, the 1960s and 1970s saw the refinement of graphics hardware and mapping software that could render maps with reasonable cartographic fidelity. In this era, maps were usually created with general purpose CAD (computer-aided design) software. The CAD data model stored geographic data in binary file formats with representations for points, lines, and areas. Scant information about attributes was kept in these files; map layers and annotation labels were the primary representation of attributes.THE COVERAGE DATA MODELIn 1981, Environmental Systems Research Institute, Inc. (ESRI), introduced its first commercial GIS software, ArcInfo, which implemented a second generation geographic data model, the coverage data model (also known as the georelational datamodel). This model has two key facets:• Spatial data is combined with attribute data. The spatial data is stored in indexed binary files, which are optimized for display and access. The attribute data is stored in tables with a number of rows equal to the number of features in the binary tables and joined by a common identifier.• Topological relationships between vector features can be stored. This means that the spatial data record for a line contains information about which nodes delimit that line, and by inference, which lines are connected; it also contains information about which polygons are on its right and left sides. The major advance of the coverage data model was the user’s ability to customize feature tables; not only could fields be added, but database relates could be set up to external database tables. Because of the performance limitations of computer hardware and database software of the time, it was not practical to store spatial data directly in a relational database. Rather, the coverage data model combined spatial data in indexed binary files with attribute data in tables. Despite this compromise of partitioning spatial and attribute data, the coverage data model has become the dominant data model in GIS. This has been for good reason—the coverage data model made high performance GIS possible, and stored topology facilitated and improvedgeographic analysis and more accurate data entry.Limitations of the coverage data modelHowever, the coverage data model has an important shortcoming—features are aggregated into homogeneous collections of points, lines, and polygons with generic behavior. The behavior of a line representing a road is identical to the behavior of a line representing a stream. The generic behavior supported by the coverage data model enforces the topological integrity of a dataset. For example, if you add a line across a polygon, it is automatically split into two polygons. But it is desirable to also support the special behaviors of streams, roads, and other real-world objects. An example is that streams flow downhill and when two streams merge into one, the flow of the merged stream is the addition of the two upstream flows. Another example is that when two roads cross, a traffic intersection should be at their junction unless there is an overpass or underpass.Customizing features in coveragesWith the coverage data model, ArcInfo application developers had some notable success in adding this type of behavior to features through macro code written in the ARC Macro Language (AML™). Many successful, large-scale, industry-specific applications were built. However, as applications became more complex, it became apparent that a better way to associate behavior with features was needed. The problem was that the developer had the task of keeping the application code in synchronicity with feature classes—no easy task. The time had come for a new geographic data model with an infrastructure to tightly couple behavior with features.THE GEODATABASE DATA MODELArcInfo 8 introduces a new object-oriented data model called the geodatabase data model. The defining purpose of this new data model is to let you make the features in your GIS datasets smarter by endowing them with natural behaviors, and to allow any sort of relationship to be defined among features.The geodatabase data model brings a physical data model closer to its logical data model. The data objects in a geodatabase are mostly the same objects you would define in a logical data model, such as owners, buildings, parcels, and roads.Further, the geodatabase data model lets you implement the majority of custom behaviors without writing any code. Most behaviors are implemented through domains, validation rules, and other functions of the framework provided in ArcInfo. Writing software code is only necessary for the more specialized behaviors of features.SCENARIOS OF OBJECT INTERACTIONSTo get a sense of why an object-oriented data model is important, review the following scenarios that illustrate common tasks you might perform with features. From these scenarios, you can sift out the benefits of an object-oriented data model and then review some specific characteristics of the geodatabase data model.Adding and editing featuresWhen you add geographic features to your GIS database, you want to ensure that features are placed correctly according to rules such as these:• That the values you assign to an attribute fall within a prescribed set of permissible values. A parcel of land may only have certain land uses such as residential, agricultural, or industrial. That a feature can be placed adjacent or connected to another feature only if certain constraints are met. Placing a liquor store near a school is not permitted by law. A city road cannot be connected to a highway without a transition segment such as an on-ramp. That collections of certain features conform to their natural spatial arrangement. A stream system should always flow downhill. Flow down from a junction is the sum of flows upstream.• That the geometry of a feature follows its logical place ment. The lines and curves that make up a road should be tangent. Building corners most often form right angles.Relationships among featuresAll objects in the world are entangled in relationships with other objects. From the perspective of a GIS, these relationships can be considered to fall within three general categories: topological, spatial, and general. These are some examples of each of these types of relationships:• When you edit features in an electric utility system, you want to be sure that the ends of primary and secondary lines connect exactly and that you are able to perform tracing analysis on that electric network. A set of topological relationships is defined for you when you load or edit features within a connected system.• When you work with a map with buildings, blocks, and school districts, you might want to determine which block contains a particular building, the set of all buildings within a school district, and which blocks contain no buildings.A fundamental function of a GIS is to determine whether a feature is inside, touching, outside, or overlapping another feature. Spatial relationships are inferred from the geometry of features.• Some objects have relationships that are not present on a map. A parcel has a relationship to an owner, but the owner is not a feature on a map. A general relationship connects the parcel and the owner. Some features on amap have relationships, but their spatial relationship is ambiguous. A utility meter is in the general vicinity of an electric transformer, but it is not touching the transformer. The meter and the transformer might not be reliably related by their spatial proximity in crowded areas, so a general relationship ties the two features together.Cartographic displayMost of the time, you will draw features on a map with predefined symbols, but sometimes you will want more control over how your features are drawn. These are some specialized drawing behavior When you display a contour line, you want its elevation annotated along a flat section of the contour, at an average interval such as 4 inches, and not obscuring other features.• When you draw roads on a detailed map, you would like the road drawn as parallel lines with clean intersections wherever there is a road intersection.When multiple electrical wires are physically mounted on the same set of utility poles, you would like to depict them as spread in a set of parallel lines with a standard offset in map units.Interactive analysisDynamic map displays invite the user to touch features, find properties and relationships, and launch analyses. These are examples of some tasks you may want to perform upon selected features:• Touch a feature on a map display and invoke a form to query and update its properties.• Select a part of an elect ric network where line maintenance is planned, find all affected downstream customers, and make a mailing list to notify them. BENEFITS OF THE GEODATABASE DATA MODELThe common thread throughout these scenarios is that it is very useful to apply object-oriented data modeling to features. Object-oriented data modeling lets you characterize features more naturally by letting you define your own types of objects, by defining topological, spatial, and general relationships, and by capturing how these objects interact with other objects. Some of the benefits of the geodatabase data model are:• A uniform repository of geographic data. All of your geographic data can be stored and centrally managed in one database.• Data entry and editing is more accurate. Fewer mistakes are made because most of them can be prevented by intelligent validation behavior. For many users, this alone is a compelling reason to adopt the geodatabase data model. • Users work with more intuitive data objects.Properly designed, a geodatabase contains data objects that correspond to the user’s model of data. Instead of generic points, lines, and areas, the users work with objects of interest, such astransformers, roads, and lakes.• Features have a richer context. With topological associations, spatial representation, and general relationships, you not only define a feature’s qualities, but its context with other features. Thislets you specify what happens to features when a related feature is moved, changed, or deleted. This context also lets you locate and inspect a feature that is related to another.• Better maps can be made. You have more control over how features are drawn and you can add intelligent drawing behavior. You can apply sophisticated drawing methods directly in the ArcInfo mapping application, ArcMap. Highly specialized drawing methods can be executed by writing software code.• Features on a map display are dynamic. When you work with features in ArcInfo, they can respond to changes in neighboring features. You can also associate custom queries or analytic tools with features.• Shapes of features are better defined. The geodatabase data model lets you define the shapes of features using straight lines, circular curves, elliptical curves, and Bézier splines.• Sets of features are continuous. By their design, geodatabases can accommodate very large sets of features without tiles or other spatial partitions.• Many users can edit geographic datasimultaneously. The geodatabase data model permits work flows where many people can edit features in a local area, and then reconcile any conflicts that emerge.To be sure, you can realize some of these benefitswithout an object-oriented data model, but you would be at a disadvantage—you would need to write external code loosely coupled to features and prone to complexity and error. A principal advantage of the geodatabase data model is that it includes a framework to make it as easy as possible to create intelligent features that mimic the interactions and behaviors of real-world objects.2 How maps informWHAT MAPS DOMaps are uniquely capable for sharing knowledge about our world in many ways. Maps identify what is at a location. You can point to a location on a map and learn the name of the place or object and any other descriptive attributes. Maps can locate where you are. If your map has real-time input from the Global Positioning System (GPS), you can see where you are, how fast you are traveling, and the direction you are headed. Maps let you identify distributions, relationships, and trends not otherwise discernible. A demographer can compare maps of urban areas compiled in the past with present-day maps to guide public policy. An epidemiologist can correlate the locations of rare disease outbreaks with environmental factors to find possible causes. Maps can integrate data from diverse sources into a common geographic reference. A municipal government can merge street maps with maps from utilities to coordinate construction. An agricultural scientist can couple images from weather satellites with maps of farms and crops to boost productivity. Maps let you combine and overlay data to solve spatial problems. A state or provincial government can combine many layers of data to find suitable locations for a waste disposal site. Maps can find the best path between one place and another. A package delivery firm can find the most efficient route for trucks. A public transportation planner can create optimized bus routes. Maps can model future events. A utility company can simulate the impact of a new subdivision and determine the necessary system upgrades. A regional planner can model serious accidents such as a toxic spill and develop evacuation scenarios.WHAT MAPS AREGIS technology has broadened our view of a map. Instead of a static entity, a map is now a dynamic presentation of geographic data. A map is the graphical presentation of geographic data. To be effective, a map must be visually compelling. Principles of graphic design—layout, proportion, balance, symbology, and typography—apply to maps as well as to other types of illustration. A map is the interface between geographic data and ourperception. Maps utilize people’s inherent cognitive abilities to identify spatial patterns and provide visual cues about the qualities of geographic objects and locations.A map is an abstraction of geographic data. A map is a view of geography for a particular class of user. A map filters information for intended use—only information for the intended purpose is displayed. A map simplifies data—some of the complexity and internal structure of data is hidden. A map adds descriptive content to data—labels reveal names, categories, types, and other information. The goal of a data modeler is to design a data structure that supports the creation of informative and aesthetic maps. Understanding how maps inform is the prerequisite to building a data model. When you read a map, you observe facts about the shape and position of geographic features, the attribute information associated with geographic features, and the spatial relationships among features.HOW MAPS EXPRESS GEOGRAPHIC INFORMATION Geographic features are located at or near the surface of the earth. They can occur naturally (rivers, vegetation, and peaks), can be constructions (roads, pipelines, and buildings), and can be subdivisions of land (counties, land parcels, and political divisions).Three primary ways of presenting a geographic area on a map are as a set of discrete features, as an image or sampled grid, and as a surface.DISPLAYING DISCRETE FEATURESMany geographic features have distinct shapes that can be portrayed by points, lines, and polygons.Points represent geographic features too small to be depicted as lines or areas, such as well locations, telephone poles, and buildings. Points can also represent locations that have no area, such as mountain peaks.Lines represent geographic features too narrow to be depicted as areas, such as streets and streams, or slices through a surface, such as elevation contours.Polygons are closed figures that represent the shape and location of homogeneous features, such as states, counties, parcels, soil types, or land-use zones.DISPLAYING IMAGES AND SAMPLED GRIDSMuch of the information we collect about the earth is in the form of aerial photographs or satellite images. These images often form a backdrop to other map data. Similar in format to images are sampled data grids, which represent a continuous phenomenon such as temperature, rainfall, or elevation. Images and sampled data grids are called rasters. A raster is comprised of a two-dimensional matrix of cells, which have attributes that represent qualities such as color, spectral reflectance, or rainfall.DISPLAYING SURFACESThe shape of the earth’s surface is continuous. Some aspects of a surface can be drawn as features, such as ridges, peaks, and streams. Lines of equal elevation can be drawn as contour lines.To portray the shape of the earth, you can create a surface display that uses a range of colors to characterize sun illumination, elevation, slope, and aspect. Most often, the vertical values represent an elevation, but other attributes such as population density can define a surface as wellHOW MAPS PORTRAY ATTRIBUTESThe features on a map have any number of associated attribute values. These attributes reside within the database table for a set of features or can be accessed through links to other databases. The most common types of attributes are these:• A descriptive string gives a feature its name or characterizes a category, condition, or type.• A coded value represents a type of feature. It can be a numeric value or an abbreviated string.• A discrete numeric value represents something that is counted, such as the lanes on a road.• A real numeric value represents continuous data that is measured or calculated, such as distance, area, or flow.• An object identifier is rarely displayed, but it is the key to access attributes in external databases. There are a variety of techniques for illustrating descriptive information on a map.Depicting type attributesCoded values are used to draw symbols that depict a type of object. Points are drawn with recognizable symbols for schools, mines, and ports. Lines are drawn with distinct pen patterns that represent continuous or intermittent streams. Areas are drawn with fill patterns that portray any classification. Illustrating measured attributesNumeric values can be drawn on a map by varying the size of symbols. These values can be integers or real numbers and can be grouped into classifications.Drawing classified attributesCoded values or numeric values can be presented on a map by using colors.A color can represent the features that share a common value. A color can represent a numeric value within a range by a blend from one color to another or a gradation in hue, brightness, or saturation.Labeling descriptive attributesDescriptive strings can be drawn next to, along, or inside the features theydescribe.HOW MAPS EXHIBIT SPATIAL RELATIONSHIPSWhen you look at a map, your mind discerns spatial patterns. Many maps are built for purposes such as identifying business locations, optimizing routes, and understanding habitats.Maps visually reveal these spatial relationships:• Which features connect to others• Which features are a djacent to others• Which features are contained within an area• Which features intersect• Which features are near others• The difference in elevation of features• The relative position among featuresMaps in a GIS also support spatial queries thatcreate lists and selections.3 GIS data representationsIn this chapter you will review some basic concepts of modeling geographic data. You will learn some options for modeling continuous surfaces, discrete features, and imagery. Sometimes, there is more than one reasonable choice for a data model.DATA REPRESENTATION MODELSWith a GIS, you can model data in three basic ways: as a collection of discrete features in vector format, as a grid of cells with spectral or attribute data, or as a set of triangulated points modeling a surface.Modeling with vector dataVector data represents features as points, lines, and polygons and is best applied to discrete objects with defined shapes and boundaries. Features have a precise shape and position, attributes and metadata, and useful behavior.Modeling with raster dataRaster data represents imaged or continuous data. Each cell (or pixel) in a raster is a measured quantity. The most common source for a raster dataset is a satellite image or aerial photograph. A raster dataset can also be a photograph of a feature, such as a building. Raster datasets excel in storing and working with continuous data, such as elevation, water table, pollution concentration, and ambient noise level.Modeling with triangulated dataA TIN is a useful and efficient way to capture the surface of a piece of land. TINs support perspective views. You can drape a photographic image on top of a TIN for a photorealistic terrain display. TINs are particularly useful for modeling watersheds, visibility, line-ofsight, slope, aspect, ridges and rivers, and volumetrics. TINs can model points, lines, and polygons. A triangulation is made of many mass points, each an x,y,z tuple. Breaklines represent streams, ridges, and other linear discontinuities. Exclusion areas represent polygons with same elevation, such as lakes or project boundaries. Contour maps can be generated from a TIN, using linear interpolation or a smoothing algorithm.Implementing data representation modelsA geodatabase implements the vector data representation with feature datasets and feature classes, the raster data representation with raster datasets, and the triangulated data representation with triangulated irregular networks (TINs).A GIS can model a surface in three general ways: as a surface raster, ascontour lines, or as a triangulated irregular network. Each approach has merit, but the triangulated irregular network has special analytic powers and the surface raster can also perform interesting analysis.SURFACE RASTERSome terrain data comes in the form of a uniform grid with elevation values. An example is the Digital Elevation Model (DEM) data product from the United States Geological Survey. A raster dataset can represent point elevations spaced at regular intervals. Each cell in the raster has an associated elevation value. From a raster dataset with elevations, the elevation for any point on a surface can be estimated and a set of contours can be derived.The advantages of raster datasets are:• The co nceptual model of raster datasets is simple. Data storage is very compact.• The raster model has well-established algorithms to process raster data. • Elevation data in raster format is relatively abundant and inexpensive to obtain.The disadvantages of raster datasets are:• The rigid grid structure does not conform to the variability of terrain.• The original data is not maintained when it is interpolated to a regularly spaced grid.• Linear features cannot be represented well for many applications. CONTOUR LINESContour lines can be used to represent surfaces. A contour is a line following an equal elevation value. Contours are the most accessible source of terrain information for most map users. Contours are good for human interpretation. Closely spaced contours are a clear visual cue that the local terrain is steep.A sharp angle in a contour is a clue of a stream or ridge line. You can get a sense of the “lay of the land” by reading contours on a map.However, contours are generally poor for computer surface models. The collection of all points on contours does not make a good dataset for surfaces. It is difficult to remove data artifacts introduced from converting contours to rasters or TINs. Converting contours is usually a last resort for building a surface model. You can make a perspective view or perform surface analysis of contours only after they have been converted to a raster or a TIN. TRIANGULATED IRREGULAR NETWORKSA triangulated irregular network (TIN) is an efficient and accurate model for representing continuous surfaces. TIN software includes many functions that analyze surfaces.A TIN dataset is built in this way:1. Collect a set of points with x,y,z coordinates through photogrammetric instruments, GPS data collection, or other means. Collect breaklines where the shape of the surface changes sharply. Collect exclusion areas for features such as lakes.2. From this point data, GIS software creates an optimal network of triangles, called a Delaunay triangulation. In a TIN, each triangle is created to be as close to equilateral as possible.3. Each triangle forms a face with a gradient slope. From a TIN, an elevation can be calculated for any point with x and y values by first locating the triangle and then interpolating the height inside it. A TIN is efficient because the point density on any part of the surface can be proportional to the variation in terrain. A flat plain suffices with a low point density and mountainous terrain requires a high point density, especially where the surface changes abruptly.RASTER DATASETSRaster data can be used as a backdrop to a map display, as a source for feature extraction, for gridded surface models, or for modeling proximal geographic functions such as dispersion. GIS software can rapidly overlay stacked raster datasets. A raster dataset stores a two-dimensional matrix with sampled values for each cell. Each cell has the same width and height. The geographic coordinate of the upper-left corner of the grid, together with the cell size and number of grid rows and columns, uniquely defines the spatial extent of the raster dataset. Cell values for raster datasets can be integer or floating numbers. Some representative types of values for raster cells include:• Light reflectance (albedo) in a photograph.• Li ght intensity at a specific part of the spectrum in a satellite image.• A derived attribute, such as land-use type, or a feature type, such as a building or street.• A z value, such as elevation or concentration.A value attribute table (VAT) can be optionallyassociated with a raster dataset. This table keeps track of your value classification. You can add custom attributes by adding more columns. Raster datasets can have one or many bands. Eachband in a raster dataset has an identical grid layout but represents a different attribute. The most common use of multiple bands is to represent the multispectral data captured by satellite imagery.Raster datasets as feature attributesNot all raster datasets have a geographic reference. An image can be used as an attribute to a feature. If you are building a GIS to sell homes, you may。
GIS专业英语
GIS专业英语Abscissa 横坐标absolute accuracy 绝对精度absolute coordinates 绝对坐标Absorption 吸收abstraction 抽取accuracy 精度Add Data 添加数据Across-track scanner 跨径扫描仪active remote sensing 主动遥感Address geocoding 地址地理编码address locator地址定位器Address matching 地址匹配agreement licensee 协议被许可人Advanced Very High Resolution Radiometer 高级甚高分辨率辐射仪Air station 航摄站alidade照准仪along-track scanner 沿径扫描仪Alphanumeric grid 字母数字网格Anaglyph 视差立体图analog image模拟图像Analysis mask 分析掩模anisotropy各向异性Antipode对跖点apogee远地点Arc 弧architecture 架构archive档案argument参数Arithmetic expression 算术表达式aspatial data 非空间数据aspect ratio纵横比Astrolabe 星盘atlas grid地图集网格atmospheric window大气窗口Atomic clock 原子钟attenuation 衰减authentication 身份验证author 作者Autocorrelation 自相关automated cartography 自动化制图automation scale 自动化比例Autovectorization 自动矢量化axis 轴azimuthal projection 方位投影Backscatter 后向散射band 波段band ratio 波段比band-pass filter 带通滤波器Bandwidth 带宽bar scale比例尺(图形比例尺) base layer 底层base station基站Batch 批量batch geocoding 批量地理编码batch processing 批处理Batch vectorization 批量矢量化bathymetric curve 等深线battleships grid战舰网格Bayesian statistics 贝叶斯统计bearing方位角Bézier curve 贝塞尔曲线Bilinear interpolation 双线性内插法binding绑定binomial distribution 二项式分布Biogeography 生物地理学blind digitizing 盲目数字化block group街区群Block kriging 块段克里金法bookmark 书签boolean 1.布尔数据类型; 2.布尔值Boolean operator 布尔运算符boundary边界boundary line 界线Boundary monument 界标boundary survey 边界测量bounding rectangle边界矩形Bowditch rule 包狄法则break point 断点breakline断裂线browser 浏览器Buffer area 缓冲区business logic 业务逻辑CAD 计算机辅助设计(computer-aided design)Cadastral survey 地籍测量cadastre 地籍calibration 校准,定标callout line标注线Camera station 摄站capacity容量cardinal point方位基点cardinality基数Cartesian coordinate system 笛卡尔坐标系cartogram 统计图cartographer 制图员Cartography 制图学cartouche地图饰框catalog tree 目录树catchment流域Categorical raster 类目栅格celestial sphere天球cell size栅格大小cells 栅格Cellular automaton 元胞自动机census block人口普查区块Census geography人口普查地理学center 中心点centerline中心线centerpoint中点Central meridian中央子午线centroid 重心chart 图表chi-square statistic卡方统计Choropleth map 面量图chroma色度chronometer 天文钟circle圆Circular variance 圆方差civilian code民用码Clarke Belt克拉克带Clarke ellipsoid 克拉克椭球Clarke spheroid 克拉克椭球面Clearinghouse(信息或服务)交换中心clinometric map坡度图code-phase GPS 码相位GPS Cognitive map认知图coincident重叠cokriging协同克里金法command 命令Command line 命令行compass north罗经北compass point 罗经点compass rose罗经盘Compass rule罗盘仪法则compression program 压缩程序Computational geometry计算几何学Containment 包含Conformal projection 等角投影,保角投影,正形投影conformality保形性Conic projection 圆锥投影conjoint boundary共同边界constant azimuth恒定方位Content Standard for Digital Geospatial Metadata 数字地理空间元数据的内容标准Continuous raster 连续栅格contour 等高线,等值线contour drawings 等高线图,等值线图Contour interval 等高线间距,等值线间距contour line等高线,等值线Contour tagging 等高线标注,等值线标注contrast ratio 对比度Contrast stretch 对比度扩展convergence angle收敛角conversion转换Convex hull 凸包coordinate geometry坐标几何学coordinate system 坐标系Coordinated universal time 协调世界时correlation相关Corridor analysis走廊分析, 廊道分析county subdivision县级分区Covariance 协方差Coverage 1.覆盖面;2.ESRI图层Cracking 裂化Crandall rule Crandall 法则crop guide 裁切参考线crop marks 裁切标记Cross correlation 交叉相关cross covariance 交叉协方差cross tabulation 交叉表Cross validation 交叉验证Cross variogram交叉变差函数Cubic convolution立方卷积插值法cultural feature人文要素Cultural geography文化地理学curb approach路边通道curve fitting曲线拟合Customizations 自定义cylindrical projection圆柱投影Dangle length悬线长度Dangle tolerance 悬线容差dangling arc 悬弧Dasymetric mapping分区制图(多用于人口数据)data management 数据管理Data table 数据表dataset 数据集datum基准DBMS 数据库管理系统(data-base management system) Dead reckoning 航位推测法Declination 1.偏角;2.磁偏角degree slope坡度Delaunay triangulation 德洛内三角Delimiter 分隔符demography人口统计学Densify 增密densitometer密度计Density slicing 密度分割deploy 部署或安装(硬件、软件等)Depression contour 洼地等高线depth contour等深线Depth curve 深度曲线Descending node 降交点Desire-line analysis期望线分析desktop 桌面Desktop clients 桌面客户端Desktop GIS 桌面GIS destination目标Determinate flow direction确定性流向Deterministic model 确定性模型Detrending 趋势分离developable surface可展表面developer 开发人员Development environment 开发环境Diazo process重氮晒印法difference 差异Differential correction 差分校正Differential Global Positioning System 差分全球定位系统Diffusion 扩散Digital elevation model 数字高程模型Digital Geographic Information Exchange Standard 数字化地理信息交换标准Digital Geographic Information Working Group 数字地理信息工作组Digital image processing 数字图像处理Digital line graph 数字线划图Digital nautical chart 数字海图Digital number 数值Digital orthophoto quadrangle 数字正射影像图Digital orthophoto quarter quadrangle 数字正射影像象限图Digital raster graphic 数字栅格图digital terrain elevation data 数字地形高程数据Digital terrain model 数字地形模型digitizer数字化仪Dijkstra’s algorithm狄捷斯特拉算法dilution of precision精度衰减因子Dimension 尺寸,维,维度directed network flow有向网络流Direction 方向Dirichlet tessellation荻瑞斯莱特镶嵌,荻瑞斯莱特剖分Discovery 发现discrete data离散数据discrete digitizing离散数字化Discrete raster 离散栅格数据Displacement 位移display scale显示比例Display unit显示单位dissemination扩散,传播distance距离Distance decay距离衰减Distance unit距离单位Distortion变形district 地区Dithering 抖动Diurnal arc周日弧docking停靠Doppler shift多普勒位移Doppler-aided GPS 多普勒辅助GPS dot density map点密度图Dot distribution map 点分布图double precision双精度Double-coordinate precision 双坐标精度Douglas-Peucker algorithm 道格拉斯-普克算法downstream下游Drafting 描绘draping叠加,披盖drift漂移drive-time area驾车时间区Drop-down list 下拉列表drum scanner鼓式扫描仪Dual Independent Map Encoding 双重独立坐标地图编码Dynamic zoom 动态缩放Easting 东距eccentricity 偏心率ecliptic 黄道edge边Edgematching 边缘匹配elastic transformation弹性变形Electromagnetic spectrum 电磁光谱electronic atlas电子地图集element 元素Electronic navigational chart 电子航海图Elevation guide 高程指南ellipsoid 椭球体Ellipticity 椭圆率End offset 末端偏移endpoint 端点enterprise GIS 企业级GIS Entity objects 实体对象envelope包络矩形environmental model 环境模型Ephemeris 星历表equal competition area平等竞争区equal-area classification等积分类Equal-area projection 等积投影equal-interval classification等距分类Equatorial plane 赤道面equidistant projection等距投影ESRI Data ESRI 数据Event 事件exponent指数export导出exposure station 摄站expression表达式Extended 扩展extent范围extrapolation 外插法extrude 拉伸extrusion拉伸Face 平面false easting 东移假定值false northing北移假定值feature 要素Federal Geographic Data Committee 美国联邦地理数据委员会field 字段Fill 填充fillet圆角filter过滤器,过滤flow direction流向flow map流向图Focal analysis邻域分析focal functions邻域函数form 地形,形式fractal 分形Framework 框架frequency 频率from-node 起点Full Extent 完整范围Fuzzy boundary 模糊边界Fuzzy classification 模糊分类fuzzy set 模糊集合Fuzzy tolerance 模糊容差Gauss-Krüger projection 高斯-克吕格投影Generalization 概化,(数据库或地图的)综合技术Geocentric coordinate system 地心坐标系geocode地理编码geocoding 地理编码Geocomputation 地理计算geodata 地理数据geodatabase 地理数据库Geodatabase data model 地理数据库数据模型Geodataset 地理数据集Geodesic 测地线Geodetic 测地学geographic coordinate system 地理坐标系Geographic information science 地理信息学Geographic Information System (GIS) 地理信息系统(GIS)Geography 地理学geography level 地理等级Geography Markup Language地理标记语言Geoid 大地水准面geoid-ellipsoid separation大地水准面-地球椭球面分离Geolocation 几何定位geometric coincidence 几何重叠Geometric correction 几何校正Geometric dilution of precision 几何精度衰减因子Geometric network 几何网络Geometric transformation 几何变换Geometry 几何学geomorphology 地貌学Geoprocessing 地理处理Georectification地理校正Georeference 地理参考Georeferencing 地理参考georelational data model 地理相关数据模型Geospatial data 地理空间数据geospatial data clearinghouse 地理空间数据交换中心Geospatial technology 地理空间技术Geospecific model 地学相关模型Geostationary 对地静止geostatistics地理统计学geosynchronous 对地同步Geotypical model 典型地理模型GIS地理信息系统GIScience地理信息学Global Navigation Satellite System 全球卫星导航系统Global Positioning System 全球定位系统GUI GUI (图形用户界面)Global spatial data infrastructure 全球空间数据基础架构Glyph 字形gnomonic projection日晷投影Go to ǿȀ转至ǿȀGPS 全球定位系统Grad 梯度(原英文单词可能有误) gradian 梯度gradient 坡度,斜率graticule 经纬网Gravimeter 重力计gravimetric geodesy 大地重力学gravity model 引力模型Gray scale 灰度great circle 大圆Greenwich mean time格林尼治标准时间Greenwich meridian格林尼治子午线grid 网格grid cell网格单元ground 大地,地面Hachure 晕渲线Hamiltonian circuit汉密尔顿回路Hamiltonian path汉密尔顿路径Height 高度Helmert transformation 线性正形变换hemisphere半球Heuristic 试探算法,试探函数hexadecimal 十六进制High Accuracy Reference Network高精度基准网High Precision Geodetic Network高精度大地基准网Hillshading 坡面阴影,晕渲histogram equalization直方图均衡化Hole 孔洞Horizontal geodetic datum 水平大地基准human geography 人文地理学Hydrography 水文地理学hydrologic cycle水循环hydrology水文学hyperlink 超链接Hypsography 测高学,地势图hypsometric curve等高线hypsometric map地势图Hypsometry 测高法Identify 识别identity link一致性链接illumination照度image coordinate图像坐标Image data 图像数据image division图像除法运算image scale 图像比例尺Image space 图像空间imager成像仪impedance阻抗import 导入IMS IMS (网络地图服务器,Internet Map Server) incident energy入射能量Index 索引index map索引图infrared scanner红外扫描仪Infrastructure 基础设施inset map插图instance 实例instantiation实例化Integer data 整数型数据integration 集成intensity 亮度Interactive vectorization 交互矢量化Interchange format 交换格式Interferogram干涉图intermediate data中间数据International date line 国际日期变更线international meridian国际子午线International Organization for Standardization 国际标准化组织Interpolation内插法interrupted projection分瓣投影intrinsic stationarity 内在稳态Inverse distance weighted interpolation 反距离加权内插法Irregular triangular mesh 不规则三角网Irregular triangular surface model 不规则三角面模型Isanomal 等地平Isarithm 等数线Isobar 等压线isochrone 等时线Isohyet 等雨量线Isolines 等值线isometric line 等容线isopleth 等值线isotherm等温线Isotropy无向性iteration 迭代iterative procedure迭代过程Jaggies 锯齿Jenks’ optimization詹克斯优化joint operations graphic 联合作战地图Junction element 交点元素Kernel 内核key identifier 主标识符kinematic positioning 动态定位Knockout 分离区(信号或通讯的中断) known point 已知点Kohonen map 柯霍南图Kriging 克里金法label标签labeling 标注lag 间隔land cover土地覆盖land information system土地信息系统land use土地利用landform 地形landmark 地标Landsat 陆地卫星landscape ecology景观生态学large scale 大比例尺lattice 点阵面layers 层layout 布局least squares 最小二乘法level 水平leveling 水平测量library 类库license 许可证license agreement 许可协议licensee 被许可人lidar 激光雷达line线line feature线要素line of sight 视线line simplification 线条简化line smoothing 线条平滑linear dimension 线性尺寸linear feature 线性要素linear interpolation 线性内插法linear referencing 线性参考(用于交通GIS) linear unit 线性单位localization 本地化location query 位置查询location-allocation 位置分配location-based services 基于位置的服务logarithm 对数logical network逻辑网络loop traverse 闭合导线loxodrome 恒向线Magnetic bearing 磁方位magnetometer 磁力计majority resampling 多数重新采样Map algebra 地图代数map collar地图边缘map display 地图显示Map document地图文档map element地图元素map extent地图范围Map feature 地图要素map generalization 地图概化,地图综合Map projection 地图投影Map query 地图查询map reading地图阅读map scale 地图比例尺map series地图系列Map service 地图服务map sheet地图map style地图风格map unit 地图单位Mapping 制图mask掩模mass point散点mathematical operator 数学运算符Matrix 矩阵mean center平均中心mean sea level 平均海平面Mean stationarity 平均稳态Measure 测量measure value 测量值Measurement residual 测量残差median中间数median center平均中心Mental map 意境图meridian子午线metadata 元数据Metropolitan statistical area 大都市统计区microdensitometer 测微密度计Micrometer 1.测微计; 2.微米minimum bounding rectangle 最小边界矩形Minimum map unit 最小地图单位minor axis短轴misclosure 闭合差Mitigation 减轻mobile clients 移动客户端Mobile GIS 移动GIS Model 模型Monument 标石morphology 形态学mosaic 镶嵌图mud pit 泥浆池Multichannel receiver 多频道接收器multidimensional data多维数据Multipart feature 多部分要素multipatch feature 带纹理要素Multiplexing channel receiver 多路复用频道接收器multipoint feature 多点要素Multispectral scanner 多光谱扫描仪multivariate analysis 多元分析My Places 我的位置National Spatial Data Infrastructure 美国国家空间数据基础设施Natural breaks classification 自然分类navigation 导航Navstar Navstar (美国国防部全球定位系统联合服务项目)Neighborhood statistics 邻域统计networked 联网node 节点Noncoterminous polygon 非相连多边形nonversioned 非版本normal distribution 正态分布Normal probability distribution 正态概率分布northing 北距Oblate ellipsoid扁椭球体oblate spheroid扁椭球面offset 偏移Oill spill 溢油(原文oill 应为Oil) Online GIS 在线GISOpen Geodata Interoperability Specification 开放地理空间数据互操作规范Open Geospatial Consortium 开放地理空间协会open traverse 不闭合导线OpenGIS Consortium OpenGIS 协会OpenLS OpenLS (OpenGIS所包含的Open Location Service)Operand 运算数operator运算符optical center 光学中心ordinal data序数数据Ordinary kriging 普通克里金法ordinate 纵坐标Ordnance Survey 英国陆地测量局Orientation 方向origin point 原点orthogonal offset 正交偏移Orthographic 正交orthomorphic 正形orthophoto 正射影像Orthophotograph 正射影像orthophotoquad 无等高线正射影像overview map 总览图Orthophotoscope 正射投影仪orthorectification 正射校正outlier 异常值Outline vectorization 轮廓矢量化output data 输出数据Overlay 重叠Overprinting 套印Pan 平移panchromatic sharpening 全色锐化parallax bar 视差尺Parameter 参数parametric curve 参数曲线passive remote sensing 被动遥感Passive sensors 被动传感器Path 路径Pathfinding 路径搜寻peak山峰Percent slope 斜率perigee 近地点persistence 持久性photogeology 摄影地质学Photogrammetry 摄影测量学Photomap 摄影地图photometer光度计Physical geography 自然地理学pit 洼地,山谷placement 放置Planar coordinate system 平面坐标系planar enforcement 平面强化planarize平面化Plane 平面planimetric map 平面图planimetric shift 平面位移Platform 平台Plot 绘图plotter绘图仪plumb line铅垂线point 点point digitizing 点数字化Point event 点事件point feature 点要素point line 点线Point mode digitizing 点模式数字化point size点大小Point-in-polygon overlay 多边形内点重叠polar aspect 极方位坡向Polar flattening 极向扁率polar orbit 极轨道polar radius 极半径Policy and management 政策与管理Polygon overlay 多边形重叠Polyhedron 多面体Polyline 折线position位置postal code 邮政编码precision code 精确码Prime meridian 本初子午线prime vertical 东西圈probability map概率图Profile graph 剖面图projected coordinate system 投影坐标系Projective transformation 射影变换prolate ellipsoid 长椭球体property属性Proximity analysis 邻近分析pseudo node 伪节点pseudo-random number伪随机数Public Land Survey System美国公共土地测量系统pyramid金字塔QQ plot QQ 图quadrangle maps 梯形图幅quadrant象限quadrat analysis样方分析Quadtree 四叉树quantile 分位数quantile classification 分位数分类Quantile scatter chart 分位数散点图quantitative data 数量数据Quantitative geography 数量地理学query 查询Radar altimeter 雷达测高计Radar interferometry 雷达干涉测量Radian 弧度Radiation 辐射radio button 单选按钮radio waves 无线电波radiometer 辐射计Radiometric 辐射测量radius半径random noise随机噪声range范围,距离Range domain 范围域,距离域raster 栅格raster band栅格层raster cell 栅格单元Raster data model栅格数据模型Raster dataset band 栅格数据层Raster model 栅格模型Raster preprocessing 栅格预处理Raster snapping 栅格贴齐Raster tracing 栅格跟踪Rasterization 栅格化ratioing 比值法ray tracing 光线跟踪RDBMS 关系数据库管理系统reclassification 重分类Record 记录Record selector 记录选择器rectangular survey 矩形测量rectification 校正Rectilinear 直线,纵横线redistricting 重新区划reference data 参考数据Reference grid 参考网格Reference level 基准面Reference map 基准图Reference spheroid 参考椭球面Reference system 参考系统Referential integrity 参照完整性Reflectance 反射率reflected back 反射Region 地区,区域regression回归relational join 关系结合Relational operator 关系运算符relationship 关系relative accuracy相对精度Relative bearing 相对方位relative mode 相对模式relative path 相对路径Release of hazardous liquids 有害液体的泄漏relief efforts 救助Relief shading 地貌晕渲remote-sensing imagery 遥感图像Replaced hachuring 替代晕渲法replication 复制Representation 表示法,表现Representative fraction数字比例尺reprojection 重新投影resampling 重采样Residuals 残差resolution merging 分辨率融合restriction 限制Reverse geocoding 反地理编码rhumb line 恒向线ring 圆环ring study圆环分析River addressing 河道寻址rotation 旋转route路线row行R-tree R 树Satellite image 卫星图像satellite imagery 卫星图像saturation饱和度Scalable 可伸缩scale bar 比例尺scale factor 比例系数scale range 比例尺范围Scatter chart 散点图scene 场景,景(卫星图像单位) Schema 架构Seamless pan 无缝平移secant projection 正割投影section 弧段segment线段Self-organizing map 自组织影射图semantics 语义semimajor axis 半长轴Semiminor axis 半短轴semivariogram 半变差函数Sensitivity analysis 敏感度分析Sensor 传感器sequence 序列sequential analysis 顺序分析Serialization 序列化Server GIS 服务器GIS sextant 六分仪shaded relief image 晕渲地貌图Shaded relief map 晕渲地貌图shading 晕渲Shape 形状Shapefile 形状文件(ESRI数据格式) shield盾牌,(地质学)地盾shift位移Shortcuts 快捷方式short-range variation 短程变化signal 信号Signal-to-noise ratio 信噪比signature特征significance level 显著性水平Sill 基台simple kriging 简单克里金法simultaneous conveyance 同时传达Sink 端点,汇点site prospecting 选址分析slope坡度smooth 平滑Snapping tolerance 捕捉容差soil 土壤sonar 声纳soundex 语音编码算法Source 起点,源点source data 源数据space coordinate system 空间坐标系Spaghetti data 无位相数据spaghetti digitizing 无位相数字化spatial analysis 空间分析Spatial cognition 空间认知spatial data 空间数据Spatial Data Transfer Standard空间数据传输标准spatial database空间数据库Spatial join 空间结合spatial modeling 空间建模spatial overlay空间叠加Spatial query 空间查询spatial reference空间参考spatial weights matrix空间权重矩阵Spatialization 空间化spectral resolution 光谱分辨率spectral signature 光谱特征Spectrometer 光谱仪spectrophotometer分光光度计Spectroscopy 光谱学Spectrum 光谱sphere球体spheroid 椭球面,椭球体spider diagram蛛网图Spike 尖峰,异常线spline 样条函数spot 点spurious polygon 伪多边形Standard deviation 标准偏差Standard Generalized Markup Language 标准通用标记语言Standard Industrial Classification codes 标准工业分类代码Star diagram 星形图state状态state plane coordinate system 国家平面坐标系Static positioning 静态定位Stationarity 稳态Stationing 定位参考Statistical surface 统计表面steep 陡峭steradian 球面度Stereocompilation 立体测图Stereogrammatic organization 立体法结构Stereographic projection 球极平面投影Stereometer 体积计Stereomodel 立体模型Stereopair 立体像对Stereoplotter 立体绘图仪stochastic model 随机性模型stream digitizing 流数字化Stream mode digitizing 流模式数字化stream tolerance 流容差streaming 数据流Stretch 拉伸string 线段串,字符串Structure 结构study area 研究区域Surface fitting 曲面拟合surface model 曲面模型surround element 周边元素Survey marker 方位标survey monument方位标survey station测点Symbol 符号Tangent projection 切面投影taskbar 任务栏temporal data 时态数据Temporal GIS 时态GIS territory 地域Tessellation 网格化textbox 文本框Texture 纹理thematic map 专题地图theodolite 经纬仪Thiessen polygons 泰森多边形Thinning 细化third normal form 第三范式three-dimensional shape 三维形状Three-tier configuration 三层结构threshold ring analysis 阈值环分析Tidal datum 潮位基准面tie point 连接点tie survey 连接测量Tissot indicatrix 天梭指示线tolerance 容差toolbar 工具栏,工具条toolbox 工具箱Tools toolbox 工具工具箱topographic contours 地形等高线topography地形学, 地形Topological overlay 拓扑重叠Topology error 拓扑误差toponym 地名tour巡回路线Township 镇区tracing 跟踪tracking data 跟踪数据tract 人口普查区transaction事务Transformation 变换transit rule 过渡法则translation平移,转换Transverse aspect横轴法投影traverse 导线triangulated irregular network 不规则三角网Triangulation 三角测量trilateration 三边测量true bearing 真实方位true curve 真实曲线True north 真北tuple 元组turn impedance转弯阻抗turn-by-turn maps多段显示地图Tutorial 教程uninitialized flow direction 未初始化的流向United States Geological Survey 美国地质勘测局univariate distribution 一元分布Universal kriging 通用克里金法universal polar stereographic 通用极球面投影坐标网Universal Soil Loss Equation 通用土壤流失方程universal time 世界时Universal transverse Mercator 统一横轴墨卡托投影upstream 上游Urban geography 城市地理学Urban Vector Map 城市矢量图Valency 度validation验证variable 变量variance 方差Variance-covariance matrix 方差协方差矩阵 Variogram 变差函数Variography 变差法Vector 矢量vectorization 矢量化verbal scale 言语比例尺Vertex 顶点Vertical axis 纵轴vertical coordinate system 垂直坐标系Vertical exaggeration 垂直夸大Vertical geodetic datum垂直大地基准Vertical photograph 垂直航拍图viewshed 视域visible scale range 可见比例范围Visual center 视觉中心visual hierarchy 视觉层次visualization可视化V oronoi diagram V oronoi 图V oxel 三维像素Warping 变形waterfall model 瀑布模型Watershed 分水岭Wavelength 波长wavelet compression 小波压缩wayfinding 路线搜寻Waypoint 路点Web clients Web 客户端Web-enabled 支持Web Weight 权重Weighted mean center 加权平均中心weighted moving average 加权移动平均Weighted overlay 加权重叠weird polygon 复杂多边形well 水井World 世界Windowing 窗口Wireframe 线框workbook 工作簿,练习册workflow 工作流Zenithal projection 天顶投影zonal analysis 区域分析zonal functions 区域函数zone of interpolation 内插区zoning 分区zoom 缩放。
GIS英文介绍
Geographic Information SystemsGeographic Information Systems integrate computer hardware, software, and trained personnel to link resource data that are geographically referenced (NASA’s define). Computer allows one to access or display data spatially, locate points, lines or areas geographically, associate data with them, and allows retrievals and calculations to be made based upon geographic locations. They store where’s and what’s, coordinates and associated attributes. A GIS staff (trained personnel) is organised to take care of maintaining the system, guiding and controlling input of data, and supporting users during the project period.The U.S. Geological Survey offers a frequently cited definition of GIS: “A computer system capable of capturing, storing, analyzing, and displaying geographically referenced information; that is, data identified according to location. Practitioners also define a GIS as including the procedures, operating personnel, and spatial data that go into the system.”GIS allows any data with a geographic component (city, ZIP Code, country, etc.) to be displayed on a map.Much of the power of GIS lies in its ability to layer information and data. Data that mean little in table format can make a strong visual impact as a map. For instance, a table of rainfall amounts in major Virginia cities may not be as effective as a map of Virginia displaying the cities and their rainfall amounts. GIS takes this idea a step further: it enables sets of data from a database to be displayed together on demand, even in unusual combinations, and therefore can reveal patterns that otherwise would be difficult to see.Historical BackgroundThe predecessors to GIS are unique uses of maps. Historically, maps were used solely for displaying geographic boundaries and features. One famous exception is a map of London created by Dr. John Snow in 1854. He suspected that an outbreak of cholera was tied to the water system. To investigate, he plotted the London water system and locations where people died from cholera on a map. This map revealed a possible relationship between the water system and the disease —an idea contrary to mainstream thinking at the time. The outbreak was eventually traced to acontaminated pump shown on Snow’s map.Another well-known example of a unique use of a map is Charles Joseph Minard’s “Losses of French Army in Napoleon’s Russian Campaign.”This 1869 map represents Napoleon’s army as a bar and plots its locations as it enters and exits Russia over time. The start of the campaign is represented as a wide bar along the Polish-Russian border. The bar narrows as it proceeds into Russia, and by the time it returns to Poland the bar has thinned to the width of a pen stroke—a dramatic representation of the army’s losses.The first technological forerunner of modern GIS was the Canada Geographic Information System, created by the Canadian government to classify uses of land. This system, developed in the 1960s, brought about many technological advances that eventually led to today’s GIS technologies. The most widely used technology today is ESRI’s ArcGIS system. Similar systems are available, such as those by MapInfo.FeaturesGIS gives new visual access to data by layering them with mapping/spatial information. Layering data allows you to adjust their display and conduct analysis ranging from basic to complex. Some typical uses for GIS include the following: ﹒Mapping: creating maps for basic analysis and communication﹒Planning: using GIS as an analytical tool to assist in planning decisions, such as selecting the site for a new store location﹒Research: using GIS as an analytical tool to explore research questions, find new relationships between data, and find new patterns in data﹒Routing: using GIS to delineate efficient route options (for example, shipping companies plotting delivery routes).Recently developed Web-based GIS (the integration of Web technology into GIS) applications make the technology even more powerful. These applications offer several benefits:﹒Inexpensive distribution of electronic maps and mapping data, whether over the Internet or a corporate intranet﹒Interactivity, which permits users to adjust the appearance of maps to meet their needs﹒Electronic map formats, which allow users to use the electronic maps generated in other documents or formatsTypes of GISGeographical variation, in the real worlds is infinitively complex. The closer you look the more detail you see almost without limit. It would take an infinitively large database to capture the real world precisely data must somehow be reduced to a finite and manageable quantity by a process of generalization or abstraction. Geographical variation must be represented in terms of discrete elements or objects. The rules used to convert real geographical variation into discrete objects is the data model. Data model is set of guidelines for the representation of the logical organization of the data in a database.Current GISs differ according the way in which they organize reality through the data model. Each model tends to fit certain types of data and applications better than others. The software available, the training of the key individuals and historical precedent, also influences the data model chosen for a particular project or application. There are two major choices of data model: raster and vector.Raster model divides the entire study area into a regular grid of cells in specific sequence. The conventional sequence is row by row from the top left corner. Each cell contains a single value. It is space-filling since every location in the study area corresponds to a cell in the raster. One set of cells and associated values is called as layer or coverage. There maybe many layers in a database, e.g. soil type, elevation, land use, land cover.Vector model uses discrete line segments or points to identify locations. Discrete objects (boundaries, streams, cities) are formed by connecting line segments. Vector objects do not necessarily fill space, not all locations in space need to be referenced in the area.A raster model tells what occurs everywhere at each place in the area. A vector model tells where everything occurs and gives a location for every object.Conceptually the raster models are the simplest of the available data models.Raster GISConsider a raster by coding each cell with a value that represents the rock type, which appears in the majority of that cell areas, when finished every cell, will have a coded value. There are several methods for creating raster databases. Direct entry of each layer cell by cell is the simplest. Much raster data is already in digital form, as images. Remote sensing generates images in the digital form. The type of values contained in a raster depends on both the reality being coded and the GIS. Each pixel or cell is assumed to have only one value.The data for an area can be visualised as a set of maps of layers. Only one item of information is available for each location within a single layer. Multiple items of information require multiple layers. Typical raster databases contain up a hundred layers. Each layer typically contains hundreds or thousands of cells.Important characteristics of a layer are its resolution, orientation and zone(s). In general resolution can be defined as the minimum linear dimension of the smallest unit geographic space for which data are recorded. The smallest units are known as cells, pixels. High resolution refers to rasters with small cell dimensions. Orientation is the angle between through north and the direction defined by the columns of the raster. Each zone of a map layer is a set of contiguous locations that exhibit the same value. These might be: ownership parcels, political units such as countries or nations, lakes or islands or individual patches of the same soil or vegetation type.Value is the item of information stored in a layer for each pixel or cell. Cells in the same zone have the same value. Location is defined by an ordered pair of coordinates that identify the location of each unit of geographic space in the raster.The vector or object GISVector data model based on vectors. Fundamental primitive is a point. Connecting points with straight lines create objects. Areas are defined by sets of lines. The term polygon is synonymous with area in vector databases because of the use of straight-line connection between points. Very large vector databases have been built for different purposes.Area objects in one class or layer cannot overlap and must exhaust the space of a layer. Every piece of boundary line is a common boundary between two areas. The strech of common boundary between two junctions (nodes) has various names such as edge, chain or arc. Arc is used by several systems and has attributes, which identify the polygons on either side. Arcs are fundamental in vector GIS. There are two ways of storing areas. In polygon storage every polygon is stored as a sequence of coordinates. Although most boundaries are shared between two adjacent areas, all are in out and coded twice, once for each adjacent polygon. This method is used by many automated mapping packages. The second method is arc storage. In this method every arcs is stored as a sequence of coordinates. Areas are built by linking arcs. Only one version of each internal shared boundary is input and stored. Used in most current vector-based GISs.Sampling the worldThe world is infinitely complex. The contents of a spatial database represent a particular view of the world. The used sees the real world through the medium of the database. The measurements and samples contained in the database must present as complete and accurate a view of the world as possible. The contents of the database must be relevant in terms of themes and characteristics captured, the time period covered and the study area.A database consists of digital representation of discrete objects. The features shown on a map, e.g. lakes, benchmarks, contours can be through of as discrete objects. Thus the contents of a map can be captured in a database by turning map features into database objects. Many of the features shown on a map are fictitious and do not exist in the real world. Contours do not really exist, but houses and lakes are real objects. The contents of a spatial database include: digital versions of real objects, e.g. houses, digital versions of artificial map features, e.g. contours and artificial objects created for the purpose of the database, e.g. pixels.Some characte ristics exist everywhere and vary continuously over the earth’s surface e.g. elevation, atmospheric temperature and pressure, natural vegetation or soil type. This kind of variation can be represented in a several ways: by takingmeasurements at sampling points, e.g. weather station; by taking transects; by dividing the area into patches or zones, and assuming the variable is constant, within each zone, e.g. soil mapping; by drawing contours, e.g. topographic mapping.Each of these methods creates discrete objects. The objects in each case are points, lines or areas.Since the 1960s, GIS has quietly transformed decision-making in universities, government, and industry by bringing digital spatial data sets and geographic analysis to desktop computers. Geographic Information Sciences include Geographic Information Systems as well as the disciplines of geography (examining the patterns of the Earth’s people and physical environment), cartography (mapmaking), geodesy (the science of measuring and surveying the Earth), and remote sensing (studying the Earth from space). GIS also provide a technology and method to analyze spatial data, or information about the Earth. The earth’s climate, natural hazards, population, geology, vegetation, soils, land use, and other characteristics can be analyzed in a GIS using computerized maps, aerial photographs, satellite images, databases, and graphs. By analyzing phenomena about the Earth’s hydrosphere, lithosphere, atmosphere, and biosphere, a GIS helps people understand patterns, linkages, and trends about our planet.《地理信息系统》参考译文根据NASA的定义,地理信息系统(GIS)是指由专业人员利用计算机硬件和软件将各种地理资源数据连接的系统。
地理信息系统电力系统网络应用中英文对照外文翻译文献
地理信息系统电⼒系统⽹络应⽤中英⽂对照外⽂翻译⽂献中英⽂对照外⽂翻译(⽂档含英⽂原⽂和中⽂翻译)英⽂原⽂:A GIS WEB –APPLICATION FOR POWER SYSTEM OF CRETEABSTRACTGeographical Information System (GIS) applications are very helpful tools for displaying and analyzing informationfor several technological fields. The research group of Electrical Power System Lab (EPSL) of TEIC is developing aGIS software application for displaying the operational conditions of the power system of Crete, presenting alsocritical information and statistical data for system?s characteristics. This tool is intended to help training of engineersin the Electrical Department of TEIC to simulate and visualize power system operation and characteristics. Besides,this tool is very helpful for a power system engineer in observing the whole system operations an d system?s data. Alldata used are derived from a database developed by EPSL. Digitalized maps of Crete Island use this database anddisplay them optionally according to user?s demand or choice. So, an authorized user can decide which data will bedisplayed on the map, and with a simple mouse click on a selected element of the map he can b informed about its characteristics. Furthermore, this application is being uploaded on web. This means that this application runson aserver of EPSL, which can serve distant users after authorization procedure. That distance user could be a trainee inhis desk, or an engineer, or a researcher in the lab. One of the services that application provides is the load flow calculation on a specific part of the system, or for a specifi c scenario of system?s operation.Key-Words:-GIS applications, Power Systems observation, power systems web-applications1. INTRODUCTIONCrete?s electrical power system is a large autonomous system with large wind power penetration. The customer?s power & energy demand is increasing with highrates. The operation of the whole system is in charge of the Greek PPC (public power corporation)control center, located in Iraklion, where a SCADA system has been installed. In terms of integration of dispersed generation new methods and computer applications are adopted toward adaptation of the critical information of system?s operational conditions.Mapping and Geographic Information Systems (GIS)are key to a utility's business. These software applications store and map a vast amount of information about the utility's electric system and other outside plants. People and applications across theorganization typically require information from the GIS.The benefits of adaptation of a GIS for a power system are many. Descriptive presentation of data (graphics,maps, tables etc) and presentation of data in real space are offered. They offer, also,convenience concerning data processing since, as wellas to examine them in different layers. It analyzes and presents information related to spatial places. It can combine elements – data from digital database, GPS for concerning the specific definition of places,sampling and distant measurements. The relation between the data basis and the maps give the chance to the user to interact with the system of an interactivecommunication between the user and the system.Moreover many data basis can be connected andcombined improving the flexibility of the/doc/9e74597be53a580217fcfe61.html ing specific tools of software design (like map objects) we can display the results of a load flow test on the digital map of Crete.It?s possible to use GIS to define the number of people as well as forecast of load demand. Further more if we know the density (people, space) we can rate the placesper load demand.The amount of data can be presented on maps for a quick estimation of the network-system operational condition.The GIS can observe external factors such as weather conditions. For example if we know the temperature of an area, we?re able to predict the load demand there,for the next hours.GIS is a helpful tool for new types of energymanagement.2. SYSTEM MODELLING – TECHNICAL INFORMATION2.1 Power ProductionThe power system of the island of Crete is the largest autonomous power system in Greece with the highest rate of increase nation-wide in energy and power demand. The conventional generation system consists of three major power plants one in Linoperamata, one in Chania and one in Atherinolakos (the latest). The first two power plants are located near the major load points of the island. There are 20 thermal, oil-fired generating units with a total installed capacity of about 742MW. The percentage of the participation of each generator type in the total electrical power production and the annual fuelconsumption are depicted in figures1 and 2(These two figures correspond to the system in 2001, before atherinolakos installation.The power system comprises the following power stations:Six steam turbines in LinoperamataFour diesel engines in LinoperamataFour gas turbines in Linoperamata & five gas turbines in Chania.One combined cycle in Chania of 133.4 MW (2gas turbines and 1 steam turbine) Two diesel engines in Atherinolak o s2.2 Load demandThe base load is mainly supplied by the steam and diesel units. The gas turbines normally supply the daily peak load. Until 1988 the annual peak load demand always occurred in winter, from then on it always appears in summer evenings. Figure 3 shows the increase of energy demand and peak load since 1964.One characteristic of the load profile is the large variations (low night valleys – high evening peaks).Gas turbines have a high operating cost that increases significantly the average cost of electricity being supplied.2.3 Transmission systemThe transmission network (figure 4) consists mainly of 150 kV lines. There are only 2 lines of 66kV from Linop33 (production sub) to 1Irak31 (substation). The distribution network consists of 20 kV (21 kV) and 15kV (15.75 kV) lines. The generation system and the transmission network are supervised by a control center located in one of the substations in Iraklio (2IRAK), using a SCADA system.2.4 Wind ParksAbout 15 Wind Parks(WPs) have been installed in Crete since 1995 of total capacity of up to 134.7 MW and there are plans for more WPs in the next years. The peak wind penetration was up to 41.2%. Most of the wind parks have been installed at the eastern part of the island (Sitia) that presents the most favourable wind conditions. As a result, in case of faults on some particular lines, the majority of the wind parks will be disconnected.Furthermore, the protections of the WPs might be activated in case of frequency variations, decreasing additionally the dynamic stability of the system.Extensive transient analysis studies have therefore been conducted in order to assess the dynamic behaviour of the system under various disturbances and with different combinations of the generating units.2.5 Technical constraintsThe start up preparation time of a generator depends on its type. The gas turbines require 6-12 minutes for preparation. The steam turbines require 1-2 hours in …hot? state, and 8 or more hours for the …cold? state. The diesels require about 20 minutes. In addition, the increase rate of power of each generator also depends on its type. For the steam turbines is low. For the gas turbines it is 16-17 MW/min. Diesel? s rate is also high, as they react rapidly to load variations. In order to avoid undesirable frequency increase, the generator is at its technical minimum when it is connected to the system.One of the biggest problems of the system is the high fuel cost. Gas turbinesconsume diesel oil which is expensive and increases the energy cost per KWh. Steam turbines and diesel engines consume crude oil. (diesel engines consume diesel oil only at the start up state and the stop state) Diesel engines, steam turbines and wind parks reduce the cost per KWh.3. CREATION OF GISThe first part of this project was the creation of GIS maps that represent the Electrical Power System of Crete. For this reason we created a Geographical Information System (GIS) using ArcGIS and Microsoft Access. Using ArcGIS and Microsoft Access we represented substations, transmission lines, renewable sources, power plants of Crete presented over a digitized map.For every substation the elements that were imported in the database and can be viewed on the map are:1. Name of the substation2. Number of busses3. Type of the substation4. Transformer data5. Capacitor banks6. Load Demand dataFor the transmission lines the elements that were imported in the database and can be viewed on the map are:1. Circuit type2. Circuit length3. electrical data such as R,X,B4. 1st,2nd and 3rd loading limitsFor the renewable sources and the power plants the elements that were imported in the database were:1. location2. Installed Power3. Electrical dataAfter the completion of the first part of the project, the result was the creation of digitalized maps of Crete where the user can work with, using programs such as ArcGIS or other similar programs. One simple program which presents system?s data is cmd01(fig.9). It has been developed by EPSL using ESRI?s map objects. The use r chooses the layers (data) he wants to be displayed on the map of Crete. He can alsozoom in or zoom out in order to observe the desired area of the network.4. WEB PARTOn the second part of this project our aim was to transform the digitized mapsthat were created with the use of ARCGIS in a format that can be viewed in Web. Forthis reason we used technologies such as Apache, MySQl and SVG (Scalable VectorGraphics).We developed a Web server on a Linux SuSe 10.0 Server where ApacheWeb Server was installed. The second step was to import the database that wasanalyzed in step 1 from windows access to MySQL. The choice for MySQL wasbased on the fact that is a database capable to work on Webenvironment(figure11).The third step was the transformation of GIS maps in a formatthat can be viewed in Web explorers. Our choice was by default SVG. SVG is aplatform for twodimensional graphics. It has two parts: an XML-based file format anda programming API for graphical applications. Key features include shapes, text andembedded raster graphics, with many different painting styles. It supports scriptingthrough languages such as ECMAScript and has comprehensive support for animation.SVG is used in many business areasincluding Web graphics, animation, user interfaces, graphics interchange, print and hardcopy output, mobile applications and high-quality design. SVG is a royalty-free vendor-neutral open standard developed under the W3C Process. It has strong industry support; Authors of the SVG specification include Adobe, Agfa, Apple, Canon, Corel, Ericsson, HP, IBM, Kodak, Macromedia, Microsoft, Nokia, Sharp and Sun Microsystems. SVG viewers are deployed to over 100 million desktops, and there is a broad range of support in many authoring tools. SVG builds upon many other successful standards such as XML (SVG graphics are text-based and thus easy to create), JPEG and PNG for image formats, DOM for scripting and interactivity, SMIL for animation and CSS for styling. SVG is interoperable. The W3C release a test suite and implementation results to ensure conformance. The tool that was used to transform the GIS maps to SVG format was the MapViewSVG from UisMedia. The result was the creation of digitized maps of the Power System of Crete were a user using a Web explorer such as IE of Firefox can interact with the map and decide which parts of the Power System to be shown (Power Plants, substations etc).5. LOAD FLOW ANALYSISThe Last part of the project is the creation a Load Flow Analysis of the network where the user can interact with the SVG map and perform a Load flow Analysis ofthe power system of Crete. This application is under construction and it will be accomplished till May 2007. The Gauss-Seidel Algorithm is used and it has been performed on a simplified 9-buses model of the network. An authorized distant user will be able to input in a appropriate form the load demand (P(MW) and Q(MVar)) data for the 9 specific high voltage buses (High V oltage/Low V oltage Substations) and generators? production. The server w ill execute the Gauss-Seidel load flow calculations. Results will be displayed on web, on the specific elements (substations) of the map of Crete. The realization of the algorithm is going to be、constructed using PHP and Jscript that will use the data elements of the Mysql database described above.6. CONCLUSIONSGIS applications are very helpful in displaying a variety of data for power systems? characteristics and operation. EPSL has developed a database and a GIS tool for the power system of Crete. This work has been uploaded on web. Students of Electrical Department of TEI of Crete can be training on power systems? operation and can observe systems? electrical characteristics. There is a compl ete model of a real autonomous power system on web, featuring all related data such as transmission lines, generators, capacitors etc. Besides an authorized user can apply changes to the model in case of changes of the power system (for example new capacitors, transmission lines, substationsetc). The above mentioned system will be capable to support load flow analysis based on real data of the Crete Power System. For the end-user (for example a student) there will be the capability to accomplish that Load Flow Analysis without the need to use specialized software.7. ACKNOWLEDGEMENTSThis work is a part of a project which is co-funded by the European Social Fund and Greek National Resources, “EPEAEK II –ARXIMIDES”.中⽂译⽂:地理信息系统⽹络——应⽤电⼒系统克⾥特岛摘要地理信息系统(GIS )的应⽤是⾮常有⽤的⼯具,可以展⽰和分析⼏个技术领域的信息。
GIS专业英语第一章翻译
D efinitions of GIS“GIS”is an acronym meaning of Geographic Information System . In order to provide a good understanding of GIS , the following two definitions given by Rhind ( 1989 ) and the United States Geological Survey ( USGS , 1997 ) respectively are presented first.地理信息系统”是一个缩写含义,地理信息系统。
为了提供一个很好的了解,下面给出的定义由兰德(1989)和美国地质调查局(美国地质勘探局,1997)分别是第一次提出.1 “. . . . a system of hardware, software, and procedures designed to support the captu re, management, manipulation, analysis, modeling, and display of spatially referenced data for solving complex planning and manage ment problems .”1“GIS是一个由硬件,软件,和程序设计,支持捕获,管理,处理,分析,建模,并显示空间参照的数据,以解决复杂的规划和管理的问题的一个系统。
”2 “. . . . a computer system capable of assembling , storing, manipulating, and displaying geographically referenced information , i . e ., data identified according to their location .”2“。
地理信息科学专业英语
专业术语英译汉affine 仿射band 波段cartography 制图学clip 剪切digitizer 数字化仪DLG 数字线划图dpi 每英寸点数edgematching 边缘匹配equator 赤道equiarea 等积geoid 大地水准面geospatial 地理空间GPS 全球定位系统Habitat 栖息地Interface 接口Item 项目Latitude 纬度legend 图例longitude 经度median 中值meridian 子午线metadata 元数据neatline 图廓线Object-Based 基于对象的parcel 宗地photogrammetry 摄影测量precipitation 降水量range 范围raster 栅格resample 重采样resolution 分辨率RMS 均方根scanner 扫描仪siting 选址TIGER 拓扑统一地理编码topology 拓扑tuple 数组UTM 通用横轴墨卡托投影vector 矢量专业术语汉译英保护区protected area比例尺Scale bar标准差Standard deviation标准图幅Standard picture frame 单精度Single precision地理空间数据Geospatial data点缓冲区Point buffer动态分段Dynamic segmentation度量标准Metrics多项式变换Polynomial transformation 高程基准Elevation base跟踪算法Tracking algorithm规则格网Rules grid过渡带Transition zone基于位置服务Based on location service畸形线Malformation line几何变换Geometric transformation 检验图Inspection chart解析几何Analytic geometry空间要素Space element平面坐标系统Planar coordinate system曲流河Meandering river人口普查地段Census Lot上四分位数The upper quartile矢量数据模型Vector data model数据可视化data visualization数据探查Data exploration双精度Double precision水文要素Hydrological elements泰森多边型Tyson Polygons统一建模语言Unified Modeling Language投影坐标系统Projection coordinate system 线缓冲区Line buffer遥感数据Remote sensing data用材林Timber forest晕渲法Halo rendering method 指北针Compass属性表Property sheet最短路径分析Shortest path analysis最小二乘法Least squares method翻译例子如下。
- 1、下载文档前请自行甄别文档内容的完整性,平台不提供额外的编辑、内容补充、找答案等附加服务。
- 2、"仅部分预览"的文档,不可在线预览部分如存在完整性等问题,可反馈申请退款(可完整预览的文档不适用该条件!)。
- 3、如文档侵犯您的权益,请联系客服反馈,我们会尽快为您处理(人工客服工作时间:9:00-18:30)。
1.
The science and technology of acquiring , storing , processing , managing , analyzing and presenting geographically referred information (geo-spatial data ). This broad term applies both to science and technology,and integrates the following more specific disciplines and technologies including surveying and mapping ,geodesy , satellite positioning , photogrammetry ,remote sensing, geographic information system(GIS), land management ,computer systems ,environmental visualization and computer graphics .
2.
A horizontal angle is the angle formed in a horizontal plane by two intersecting vertical planes , or a horizontal angle between two lines is the angle between the projections of the lines onto a horizontal plane .For example ,observations to different elevation points
B and
C from A will give the horizontal angle BAC which is the angle between the projections of two lines (AB and AC) onto the horizontal plane . It follows that , although the points observed are at different elevations ,it is always the horizontal angle and not the space angle that is measured . The horizontal angle is used primarily to obtain relative direction to a survey control point ,or to topographic detail points ,or to points to be set out .
3.
The first step in measuring the distance between the GPS receiver and a satellite requires measuring the time it takes for the signal to travel from the satellite to the receiver . Once the receiver knows how much time has elapsed , the travel time of the signal multiplies the speed of light (because the satellite signals travel at the speed of light , approximately 186,000 miles per second )to compute the distance . Distance measurements to four satellites are require to compute a 3-dimensional (latitude ,longitude and altitude )position .。