中科院刘莹大数据挖掘课程作业2
数据挖掘作业讲解
《数据挖掘》作业第一章引言一、填空题(1)数据库中的知识挖掘(KDD)包括以下七个步骤:数据清理、数据集成、数据选择、数据变换、数据挖掘、模式评估和知识表示(2)数据挖掘的性能问题主要包括:算法的效率、可扩展性和并行处理(3)当前的数据挖掘研究中,最主要的三个研究方向是:统计学、数据库技术和机器学习(4)在万维网(WWW)上应用的数据挖掘技术常被称为:WEB挖掘(5)孤立点是指:一些与数据的一般行为或模型不一致的孤立数据二、单选题(1)数据挖掘应用和一些常见的数据统计分析系统的最主要区别在于:(B )A、所涉及的算法的复杂性;B、所涉及的数据量;C、计算结果的表现形式;D、是否使用了人工智能技术(2)孤立点挖掘适用于下列哪种场合?(D )A、目标市场分析B、购物篮分析C、模式识别D、信用卡欺诈检测(3)下列几种数据挖掘功能中,( D )被广泛的应用于股票价格走势分析A. 关联分析B.分类和预测C.聚类分析D. 演变分析(4)下面的数据挖掘的任务中,( B )将决定所使用的数据挖掘功能A、选择任务相关的数据B、选择要挖掘的知识类型C、模式的兴趣度度量D、模式的可视化表示(5)下列几种数据挖掘功能中,(A )被广泛的用于购物篮分析A、关联分析B、分类和预测C、聚类分析D、演变分析(6)根据顾客的收入和职业情况,预测他们在计算机设备上的花费,所使用的相应数据挖掘功能是( B )A.关联分析B.分类和预测C. 演变分析D. 概念描述(7)帮助市场分析人员从客户的基本信息库中发现不同的客户群,通常所使用的数据挖掘功能是( C )A.关联分析B.分类和预测C.聚类分析D. 孤立点分析E. 演变分析(8)假设现在的数据挖掘任务是解析数据库中关于客户的一般特征的描述,通常所使用的数据挖掘功能是( E )A.关联分析B.分类和预测C. 孤立点分析D. 演变分析E. 概念描述三、简答题(1)什么是数据挖掘?答:数据挖掘是指从大量数据中提取或“挖掘”知识。
实验4:大数据的分析与挖掘
3.数据的预处理:在理解数据之后,需要对数据进行预处理,例如数据清洗、数据归一化、特征提取等,以确保数据质量和可用性。如果数据集较大,可能需要使用分布式计算平台进行处理。
五、实训体会
最终,通过数据挖掘方法得到的结果可以帮助我们更好地理解和解决实际问题,例如优化产品推荐、预测市场需求、检测欺诈、识别风险等等。
4.模型的训练:接下来,需要确定哪种数据挖掘算法才能解决我们的问题,并训练相应的模型。例如,我们可以使用决策树算法、神经网络算法或者基于规则的算法等。
5.模型的预测与评价:训练好模型之后,需要对新的数据进行预测,并根据实际结果对模型进行评价。这个过程需要注意模型的可解释性、预测的准确性和稳定性等指标。
“大数据技术概论”课程实验报告
实验名称:
教师评语
教师签字日期
成绩
学生姓名
学号
一、实验目标
展示数据挖掘方法如何解决实际问题
二、实验环境
Python
三、实验内容
1. 数据的读入与理解
2. 数据的预处理
3. 模型的训练
4. 模型的预测与评价
四、实验成果
1.确定问题和目的:首先要明确需要解决的问题,以及期望得到什么样的结果。例某个产品优化推荐算法等。
第6章 大数据分析与挖掘习题答案

(1)请阐述什么是大数据分析。
大数据分析的主要任务主要有:第一类是预测任务,目标是根据某些属性的值,预测另外一些特定属性的值。
被预测的属性一般称为目标变量或因变量,被用来做预测的属性称为解释变量和自变量;第二类是描述任务,目标是导出概括数据中潜在联系的模式,包括相关、趋势、聚类、轨迹和异常等。
描述性任务通常是探查性的,常常需要后处理技术来验证和解释结果。
具体可分为分类、回归、关联分析、聚类分析、推荐系统、异常检测、链接分析等几种。
(2)大数据分析的类型有哪些?大数据分析主要有描述性统计分析、探索性数据分析以及验证性数据分析等。
(3)举例两种数据挖掘的应用场景?(1)电子邮件系统中垃圾邮件的判断电子邮件系统判断一封Email是否属于垃圾邮件。
这应该属于文本挖掘的范畴,通常会采用朴素贝叶斯的方法进行判别。
它的主要原理就是,根据电子邮件中的词汇,是否经常出现在垃圾邮件中进行判断。
例如,如果一份电子邮件的正文中包含“推广”、“广告”、“促销”等词汇时,该邮件被判定为垃圾邮件的概率将会比较大。
(2)金融领域中金融产品的推广营销针对商业银行中的零售客户进行细分,基于零售客户的特征变量(人口特征、资产特征、负债特征、结算特征),计算客户之间的距离。
然后,按照距离的远近,把相似的客户聚集为一类,从而有效地细分客户。
将全体客户划分为诸如:理财偏好者、基金偏好者、活期偏好者、国债偏好者等。
其目的在于识别不同的客户群体,然后针对不同的客户群体,精准地进行产品设计和推送,从而节约营销成本,提高营销效率。
(4)简述数据挖掘的分类算法及应用。
K-Means算法也叫作k均值聚类算法,它是最著名的划分聚类算法,由于简洁和效率使得它成为所有聚类算法中最广泛使用的。
决策树算法是一种能解决分类或回归问题的机器学习算法,它是一种典型的分类方法,最早产生于上世纪60年代。
决策树算法首先对数据进行处理,利用归纳算法生成可读的规则和决策树,然后使用决策对新数据进行分析,因此在本质上决策树是通过一系列规则对数据进行分类的过程。
中科院刘莹数据挖掘课程课后复习2
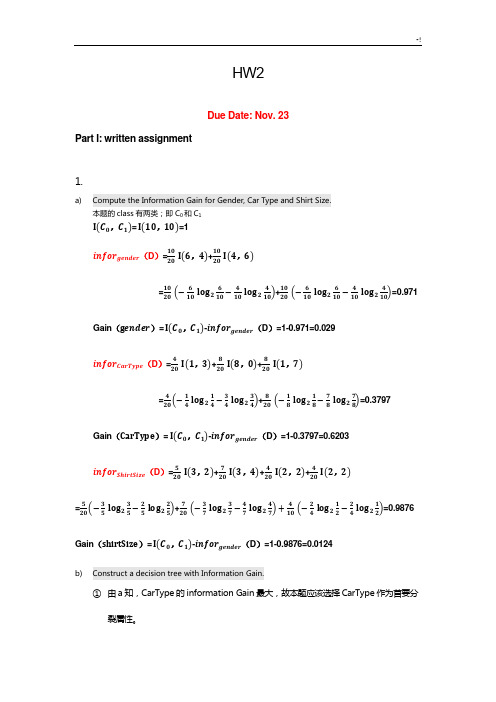
HW2Due Date: Nov. 23Part I: written assignment1.a)Compute the Information Gain for Gender, Car Type and Shirt Size.本题的class有两类;即C0和C1I(C0,C1)= I(10,10)=1infor gender(D)=1020 I(6,4)+1020I(4,6)=10 20 (−610log2610−410log2410)+1020(−610log2610−410log2410)=0.971Gain(gender)= I(C0,C1)-infor gender(D)=1-0.971=0.029infor CarType(D)=420 I(1,3)+820I(8,0)+820I(1,7)=4 20(−14log214−34log234)+820(−18log218−78log278)=0.3797Gain(CarType)= I(C0,C1)-infor gender(D)=1-0.3797=0.6203infor ShirtSize(D)=520 I(3,2)+720I(3,4)+420I(2,2)+420I(2,2)=5 20(−35log235−25log225)+720(−37log237−47log247)+410(−24log212−24log212)=0.9876Gain(shirtSize)= I(C0,C1)-infor gender(D)=1-0.9876=0.0124b)Construct a decision tree with Information Gain.①由a知,CarType的information Gain最大,故本题应该选择CarType作为首要分裂属性。
CarType的类别有Luxury family Sport(因全部属于C0类,此类无需再划分)②对Luxury进一步划分:I(C0,C1)= I(1,7)=0.5436infor gender(D)=18 I(1,0)+78I(1,6)=0+78(−17log217−67log267)=0.5177Gain(gender)= I(C0,C1)-infor gender(D)=0.5436-0.5177=0.0259infor ShirtSize(D)=28 I(0,2)+38I(0,3)+28I(1,1)+18I(0,2)=0.25Gain(shirtSize)= I(C0,C1)-infor gender(D)=0.5436-0.25=0.2936 故此处选择ShirtSize进行属性分裂。
大数据时代的教育数据挖掘:方法工具与应用

大数据时代的教育数据挖掘:方法工具与应用随着信息技术的迅猛发展和数据量的急剧增长,大数据时代已经来临。
在教育领域,数据也扮演着越来越重要的角色。
教育数据挖掘作为利用大数据技术来发现教育领域中的模式、趋势和规律的一种方法,已经成为教育研究和教学实践中的重要工具。
本文就大数据时代的教育数据挖掘进行探讨,从方法、工具以及应用进行分析和讨论。
一、教育数据挖掘的方法1. 数据预处理数据预处理是教育数据挖掘的第一步,它包括数据清洗、数据集成、数据变换和数据规约。
数据清洗是指对原始数据进行筛选、过滤和去除不完整或错误的数据,以保证数据质量;数据集成是指将来自不同来源的数据整合到一个数据源中,以便进行综合分析;数据变换是指将数据进行标准化、规范化或转换为适合挖掘的形式;数据规约是指对数据进行简化或抽取,以减少数据量和提高挖掘效率。
2. 数据挖掘模型构建数据挖掘模型构建是教育数据挖掘的核心环节,它包括特征选择、算法选择、模型构建和模型评估。
特征选择是指从大量的数据特征中挑选出对研究问题有意义的特征;算法选择是指选择适合数据挖掘任务的挖掘算法,如分类、聚类、关联规则挖掘等;模型构建是指利用选定的算法对数据进行训练,从而生成一个可用于预测和分析的模型;模型评估是指通过交叉验证、混淆矩阵等方法对模型进行性能评估。
3. 模型应用与结果解释模型应用与结果解释是教育数据挖掘的最终目的,它包括模型应用到实际问题中进行预测、推荐或决策,以及对挖掘结果进行解释和分析。
模型应用可以帮助教育管理者、教师和学生等各方在学校管理、教学设计、学习辅导等方面作出更加科学和有效的决策;结果解释则可以帮助理解学生学习行为、认知过程和学习成就等方面的规律和趋势。
二、教育数据挖掘的工具1. 数据挖掘软件数据挖掘软件是进行教育数据挖掘的必备工具,目前市面上有很多常用的数据挖掘软件,如WEKA、RapidMiner、KNIME等。
这些软件都提供了丰富的数据挖掘算法和功能模块,可以帮助研究人员和分析师进行数据预处理、模型构建和结果解释等工作。
数据挖掘技术与应用实验报告

数据挖掘技术与应用 实 验 报 告专业:_______________________班级:_______________________学号:_______________________姓名:_______________________2012-2013学年 第二学期经济与管理学院实验名称:SPSS Clementine 软件安装、功能演练指导教师: 实验日期: 成绩:实验目的1、熟悉SPSS Clementine 软件安装、功能和操作特点。
2、了解SPSS Clementine 软件的各选项面板和操作方法。
3、熟练掌握SPSS Clementine 工作流程。
实验内容1、打开SPSS Clementine 软件,逐一操作各选项,熟悉软件功能。
2、打开一有数据库、或新建数据文件,读入SPSS Clementine,并使用各种输出节点,熟悉数据输入输出。
(要求:至少做access数据库文件、excel文件、txt文件、可变文件的导入、导出)实验步骤一 实验前准备:1.下载SPSS Clementine 软件安装包和一个虚拟光驱。
2.选择任意盘区安装虚拟光驱,并把下载的安装包的文件(后缀名bin)添加到虚拟光驱上,然后双击运行。
3.运行安装完成后,把虚拟光驱中CYGiSO文件中的lservrc文件和PlatformSPSSLic7.dll文件复制替换到安装完成后的bin文件中,完成破解,获得永久免费使用权。
4.运行中文破解程序,对SPSS Clementine 软件进行汉化。
二 实验操作:从 Windows 的“开始”菜单中选择:所有程序/SPSS 1、启动 Clementine:Clementine 12.0/SPSS Clementine client 12.02、Clementine窗口当第一次启动 Clementine 时,工作区将以默认视图打开。
中中,这将是用来工作的主要区域。
间的区域称作流工作区。
中科院数据挖掘作业2
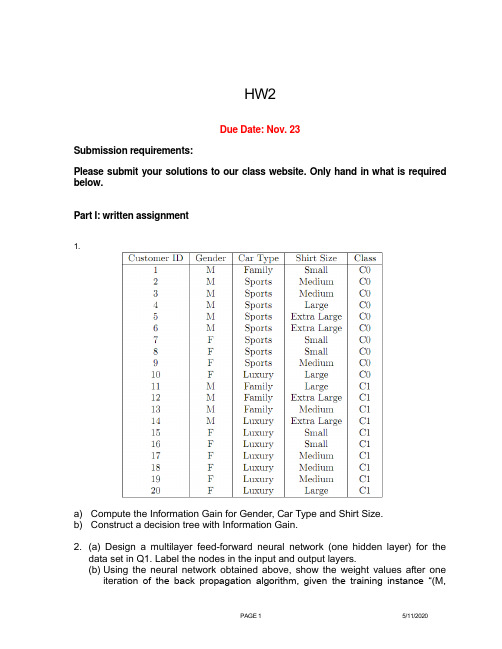
HW2Due Date: Nov. 23Submission requirements:Please submit your solutions to our class website. Only hand in what is required below.Part I: written assignment1.a) Compute the Information Gain for Gender, Car Type and Shirt Size.b) Construct a decision tree with Information Gain.2. (a) Design a multilayer feed-forward neural network (one hidden layer) for thedata set in Q1. Label the nodes in the input and output layers.(b) Using the neural network obtained above, show the weight values after oneitera tion of the back propagation algorithm, given the training instance “(M,Family, Small)". Indicate your initial weight values and biases and the learning rate used.3.a) Suppose the fraction of undergraduate students who smoke is 15% and thefraction of graduate students who smoke is 23%. If one-fifth of the college students are graduate students and the rest are undergraduates, what is the probability that a student who smokes is a graduate student?b) Given the information in part (a), is a randomly chosen college student more likelyto be a graduate or undergraduate student?c) Suppose 30% of the graduate students live in a dorm but only 10% of theundergraduate students live in a dorm. If a student smokes and lives in the dorm, is he or she more likely to be a graduate or undergraduate student? You can assume independence between students who live in a dorm and those who smoke.4. Suppose that the data mining task is to cluster the following ten points (with(x, y, z) representing location) into three clusters:A1(4,2,5), A2(10,5,2), A3(5,8,7), B1(1,1,1), B2(2,3,2), B3(3,6,9), C1(11,9,2),C2(1,4,6),C3(9,1,7), C4(5,6,7)The distance function is Euclidean distance. Suppose initially we assign A1,B1,C1 as the center of each cluster, respectively. Use the K-Means algorithm to show only(a) The three cluster center after the first round execution(b) The final three clustersPart II: LabQuestion 1Assume this supermarket would like to promote milk. Use the data in “transactions” as training data to build a decision tree (C5.0 algorithm) model to predict whether the customer would buy milk or not.1. Build a decision tree using data set “transaction s” that predicts milk as a function of theother fields. Set the “type” of each field to “Flag”, set the “direction” of “milk” as “out”, set the “type” of COD as “Typeless”, select “Expert” and set the “pruning severity” to 65, and set the “minimum records per child branch” to be 95. Hand-in: A figure showing your tree.2. Use the model (the full tree generated by Clementine in step 1 above) to make apredic tion for each of the 20 customers in the “rollout” data to determine whether the customer would buy milk. Hand-in: your prediction for each of the 20 customers.3. Hand-in: rules for positive (yes) prediction of milk purchase identified from the decisiontree (up to the fifth level. The root is considered as level 1). Compare with the rules generated by Apriori in Homework 1, and submit your brief comments on the rules (e.g., pruning effect)Question 2: Churn ManagementThe goal of this assignment is to introduce churn management using decision trees, logistic regression and neural network. You will try different combinations of the parameters to see their impacts on the accuracy of your models for this specific data set. This data set contains summarized data records for each customer for a phone company. Our goal is to build a model so that this company can predict potential churners.Two data sets are available, churn_training.txt and churn_validation.txt. Each data set has 21 variables. They are:State:Account_length: how long this person has been in this planArea_code:Phone_number:International_plan: this person has international plan=1, otherwise=0Voice_mail_plan: this person has voice mail plan=1, otherwise=0Number_vmail_messages: number of voice mailsTotal_day_minutes:Total_day_calls:Total_day_charge:Total_eve_minutes:Total_eve_calls:Total_eve_charge:Total_night_minutes:Total_night_calls:Total_night_charge:Total_intl_minutes:Total_intl_calls:Total_intl_charge:Number_customer_service_calls:Class: churn=1, did not churn=0Each row in “churn_training” represents the customer record. The training data contains 2000 rows and the validation data contains 1033 records.1. Perform decision tree classification on training data set. Select all the input variablesexcept state, area_code, and phone_number (since they are only informative for this ana lysis). Set the “Direction” of class as “out”, “type” as “Flag”. Then, specify the “minimum records per child branch”as 40, “pruning severity” as 70, click “use global pruning”. Hand-in the confusion matrices for validation data.2. Perform neural network on training data set using default settings. Again, select all the input variables except state, area_code, and phone_number. Hand-in the confusion matrix for validation data.3. Perform logistic regression on training data set using default settings. Again, select all the input variables except state, area_code, and phone_number. Hand-in the confusion matrix for validation data.4. Hand-in your observations on the model quality for decision tree, neural network and logistic regression using the confusion matrices.。
大数据环境下人工智能在企业财务风险防控中的应用探究

【摘要】大数据及人工智能技术在财务风险防控中的应用,在提高财务数据处理效率及准确性的基础上,还可以建立财务风险预警系统,防范企业财务风险。
本文主要从大数据环境下人工智能与企业财务风险的概述情况入手,分析大数据环境下人工智能在企业财务风险防控中的重要性及现存问题,并提出针对性应对措施,以期希望可以促进人工智能技术在企业财务风险防控中的广泛应用,全面提高企业财务风险防控能力。
【关键词】人工智能;企业财务风险;问题及措施一、引言从当前我国科学技术的发展速度来看,人工智能技术发展较为完善,能为企业财务风险防控信息化提供技术保障。
大部分企业在实施财务风险管控时,都对人工智能进行了合理应用,运用人工智能技术大幅降低财务人员的工作量,智能化预警潜在的财务危机、评估财务危机及把控财务数据处理质量,人工智能技术在企业财务风险防控中具有较强的应用价值,因此探究大数据环境下人工智能在企业财务风险防控中的应用非常具有现实意义。
二、人工智能及企业财务风险情况概述1.人工智能概述人工智能是计算机科学的一个分支,从字面意思理解就是“人工”和“智能”的结合,通过利用计算机技术并了解智能的实质,生产出一种可以与人类智能做出相似反应的智能机器,人工智能包括智能机器人、语言识别、图像识别及各行业专业系统的建立等。
大数据环境下,人工智能呈现出深度学习、跨界融合、人机协同、群智开放和自主智能的特点,促进人工智能技术与各行各业的深度融合,有助于全面提高我国社会生产力。
2.企业财务风险概述企业财务风险是指企业在经营管理活动中,受到市场竞争及内外部不利因素的影响,最终导致企业财务状况出现问题,可能会使企业受到经济损失,严重时可引起企业破产。
财务风险通常包括以下几种:(1)筹资风险。
筹资风险是由于资金供需市场、宏观经济环境的变化,为保障经营管理顺利进行必要的筹资活动给财务成果带来不确定性,主要包括利率风险、再融资风险、财务杠杠效应、汇率风险、购买力风险等。
- 1、下载文档前请自行甄别文档内容的完整性,平台不提供额外的编辑、内容补充、找答案等附加服务。
- 2、"仅部分预览"的文档,不可在线预览部分如存在完整性等问题,可反馈申请退款(可完整预览的文档不适用该条件!)。
- 3、如文档侵犯您的权益,请联系客服反馈,我们会尽快为您处理(人工客服工作时间:9:00-18:30)。
HW2Due Date: Nov. 23 Part I: written assignment1.a)Compute the Information Gain for Gender, Car Type and Shirt Size.本题的class有两类;即C0和C1I(C0,C1)= I(10,10)=1infor gender(D)=1020 I(6,4)+1020I(4,6)=10 20 (−610log2610−410log2410)+1020(−610log2610−410log2410)=0.971Gain(gender)= I(C0,C1)-infor gender(D)=1-0.971=0.029infor CarType(D)=420 I(1,3)+820I(8,0)+820I(1,7)=4 20(−14log214−34log234)+820(−18log218−78log278)=0.3797Gain(CarType)= I(C0,C1)-infor gender(D)=1-0.3797=0.6203infor ShirtSize(D)=520 I(3,2)+720I(3,4)+420I(2,2)+420I(2,2)=5 20(−35log235−25log225)+720(−37log237−47log247)+410(−24log212−24log212)=0.9876Gain(shirtSize)= I(C0,C1)-infor gender(D)=1-0.9876=0.0124b)Construct a decision tree with Information Gain.①由a知,CarType的information Gain最大,故本题应该选择CarType作为首要分裂属性。
CarType的类别有Luxury family Sport(因全部属于C0类,此类无需再划分)②对Luxury进一步划分:I(C0,C1)= I(1,7)=0.5436infor gender(D)=18 I(1,0)+78I(1,6)=0+78(−17log217−67log267)=0.5177Gain(gender)= I(C0,C1)-infor gender(D)=0.5436-0.5177=0.0259infor ShirtSize(D)=28 I(0,2)+38I(0,3)+28I(1,1)+18I(0,2)=0.25Gain(shirtSize)= I(C0,C1)-infor gender(D)=0.5436-0.25=0.2936 故此处选择ShirtSize进行属性分裂。
③对family进一步划分:I(C0,C1)= I(1,3)=0.811Gain(gender)= I(C0,C1)-infor gender(D)=0.811- I(1,3)=0 Gain(shirtSize)= I(C0,C1)-infor gender(D)=0.811-14 I(1,0)-14I(0,1)- 14I(0,1)- 14I(0,1)=0.811故此处选择ShirtSize进行属性分裂。
④根据以上的计算可得本题的决策数如下:2.CarTypeFamilyShirtTypeSportsC0LuxuryShirtTypesmallC0mediumC1largeC1Extra LargeC1C1C1C0 C1C1Small Medium Large ExtraLargeCarTypeFamilyShirtTypeSportsC0LuxuryShirtTypesmallC0OtherC1C0 C1C1Large Other(a) Design a multilayer feed-forward neural network (one hidden layer) for the data set in Q1. Label the nodes in the input and output layers.根据数据的属性特点易知输入层有8个节点,分别为:x1 Gender ( Gender = M: x1 = 1; Gender = F: x1 = 0 )x2 Car Type = Sports ( Y = 1; N = 0)x3 Car Type = Family( Y = 1; N = 0)x4 Car Type = Luxury ( Y = 1; N = 0)x5 Shirt Size = Small ( Y = 1; N = 0)x6 Shirt Size = Medium ( Y = 1; N = 0)x7 Shirt Size = Large ( Y = 1; N = 0)x8 Shirt Size = Extra Large ( Y = 1; N = 0)隐藏层有三个节点x9、x10和x11. 输出为二类问题, 因此只有1个节点x12(C0=1;C2=0).神经网络图如下:(其中Wij表示输入层第i个节点到隐藏层第j个节点所付权重,为方便计算,第i个节点到第9/10/11个节点的权重设置一样;Wi-j则表示隐藏层第i个节点到输出层节点所赋予的权重)1 23 4 5 6 7 89101112 w1jW 2jw3jw4jw5jw6jw7jw8jW10-12W9-12W11-12X1X2X3X4X5X6X7X8输入层隐藏层输出层c)Using the neural network obtained above, show the weight values after one iteration of the back propagationalgorithm, given the training instance “(M, Family, Small)". Indicate your initial weight values and biasesand the learning rate used.对于 (M, Family, Small), 其类标号为C0, 其训练元祖为{1, 0, 1, 0, 1, 0, 0, 0}.表 1初始输入、权重、偏倚值和学习率表 2净输入和净输出计算表 3每个节点误差的计算表 4权重和偏差更新计算3.a)Suppose the fraction of undergraduate students who smoke is 15% and the fraction of graduate students whosmoke is 23%. If one-fifth of the college students are graduate students and the rest are undergraduates, what is the probability that a student who smokes is a graduate student?U for Undergraduate student, G for Graduate student. and S for Smoking则,P(S|U)=0.15, P(S|G)=0.23, P(G)=0.2, P(U)=0.8.故P(G|S)=P(S|G)×P(G)p(S)=P(S|G)×P(G)P(S|U)× P(U)+P(S|G)×P(G)=0.23×0.20.15×0.8+0.23×0.2=0.277.b)Given the information in part (a), is a randomly chosen college student more likely to be a graduate orundergraduate student?因为P(U)>P(G)故 Undergraduate student,c)Suppose 30% of the graduate students live in a dorm but only 10% of the undergraduate students live in a dorm.If a student smokes and lives in the dorm, is he or she more likely to be a graduate or undergraduate student?You can assume independence between students who live in a dorm and those who smoke.令D for Dorm.P(D|U)=0.1, P(D|G)=0.3.P(G|D∩S)×P(D∩S)=P(D∩S|G)×P(G)=P(D|G)×P(S|G)×P(G)=0.3×0.23×0.2=0.0138.P(U|D∩S)×P(D∩S)=P(D∩S|U)×P(U)=P(D|U)×P(S|U)×P(U)=0.1×0.15×0.8=0.012.因为P(G|D∩S)×P(D∩S)> P(U|D∩S)×P(D∩S),所以P(G|D∩S)>P(U|D∩S), 所以更可能是graduate student.4.(a) The three cluster center after the first round execution第一轮:center A1(4,2,5) B1(1,1,1) C1(11,9,2)表格 1各点与原始中心点距离① 判断各点与中心点的距离(A1在表格中的点表示为(A4,A5,A6),piA1表示各点到A1点的距离,piB1表示各点到B1点的距离,piC1表示各点到C1点的距离,下同) ② 由以上表格可知:Cluster1: A1 A3 B3 C3 C4Cluster2: B2 B1 Cluster3: C1 A2(b) The final three clusters第二轮:计算每簇的均值。
Cluster1: M1(5.2, 4.4, 7.2 ) Cluster2: M2(1.5, 2, 1.5) Cluster3: M3(10.5, 7, 2)① 各点到簇中心点的距离:表格 2各点与第一次聚类中心点距离② 再次聚类后的类簇为:Cluster1: A1 A3 B3 C3 C4 Cluster2: B2 B1 Cluster3: C1 A2③结果分析:第二轮聚类结果与第一轮一致,故算法停止Part II: LabQuestion 11.Build a decision tree using data set “transactions”that predicts milk as a function of the other fields. Set the“type”of each field to “Flag”, set the “direction”of “milk”as “out”, set the “type”of COD as “Typeless”, select “Expert”and set the “pruning severity”to 65, and set the “minimum records per child branch”to be 95. Hand-in: A figure showing your tree.2. Use the model (the full tree generated by Clementine in step 1 above) to make a prediction for each of the 20customers in the “rollout”data to determine whether the customer would buy milk. Hand-in: your prediction for each of the 20 customers.由程序运行的结果可知:customer(2,3,4,5,9,10,13,14,17,18) 会购买Milk。