环路稳定性评价规范
用示波器测试电源环路稳定性的方法
用示波器测试电源环路稳定性的方法首先开关电源的环路补偿基础知识内容涉及广,需要的数理知识比较庞杂。
1、反馈控制系统开关电源是一种典型的反馈控制系统,其有响应速度和稳定性两个重要的指标。
响应速度就是当负载变化或者输入电压变化时,电源能迅速做出调整的速度。
因为开关电源的负载多数情况下都是数字IC,其电流会随着逻辑功能的变化而变化,比如FPGA在进行配置时,电流会增大一倍以上。
而开关电源的输入电压也会有一定程度的波动。
为了保证电源稳定输出,不产生跌落或者过冲,就要求电源必须迅速做出调整,使得最终输出的电压没有变化。
而电源的响应速度就决定了电源的调整速度。
由于电源加入了反馈系统,就可能发生震荡。
如果电源系统的参数没有设置好,就会产生震荡,结果就是电压上会被叠加一个固定频率的波动。
导致电源不稳定。
开关电源如下图所示:从开关电源的框图中可以看出,该系统是通过一个反馈电路,将最终输出的变化反馈给比例电路,经过比例电路的等比例衰减,输入到误差放大器中。
而后误差放大器通过比较该信号和内部参考信号的差异,来驱动后级脉宽调制器等一系列的输出环节,最终与干扰信号相互抵消,从而保证电源的稳定。
2、波特图幅度曲线的频率响应是电压增益改变与频率改变的关系,这种关系可以用波特图上一条以分贝(dB)来表示的电压增益比频率(Hz)曲线来描述.波特幅度图被绘成一种半对数曲线:x轴为采用对数刻度的频率(Hz),y轴则为采用线性刻度的电压增益(dB),波特图的另一半则是相位曲线(相移比频率),并被描述成以”度”来表示的相移比频率关系.波特相位曲线亦被绘成一种半对数曲线:x轴为采用对数刻度的频率(Hz),y轴为采用线性刻度的相移(度)。
很多同学容易把波特图看不明白,是因为用一个坐标系,把增益和相位画到一张图上,导致的认知错乱。
如下图,注意左边纵坐标是增益,单位是dB;右边的纵坐标是相位,单位是°。
横坐标是频率,是两个变量曲线共用的。
运放稳定性分析环路稳定性基础

运放稳定性分析环路稳定性基础引言本系列所采用的所有技术都将“以实例来定义”,而不管它在其他应用中能否用普通公式来表达。
为便于进行稳定性分析,我们在工具箱中使用了多种工具,包括数据资料信息、技巧、经验、SPICE仿真以及真实世界测试等,都将用来加快我们的稳定运放电路设计。
尽管很多技术都适用于电压反馈运放,但上述这些工具尤其适用于统一增益带宽小于20MHz的电压反馈运放。
选择增益带宽小于20MHz的原因是,随着运放带宽的增加,电路中的其他一些主要因素会形成回路,如印制板(PCB) 上的寄生电容、电容中的寄生电感以及电阻中的寄生电容与电感等。
我们下面介绍的大多数经验与技术并非仅仅是理论上的,而且是从利用增益带宽小于20MHz的运放、实际设计并构建真实世界电路中得来的。
本系列的第1部分回顾了进行稳定性分析所需的一些基本知识,并定义了将在整个系列中使用的一些术语。
波特图(曲线)基础幅度曲线的频率响应是电压增益改变与频率改变的关系。
这种关系可用波特图上一条以分贝(dB) 来表示的电压增益比频率(Hz) 曲线来描述。
波特幅度图被绘成一种半对数曲线:x轴为采用对数刻度的频率(Hz)、y轴则为采用线性刻度的电压增益(dB) ,y轴最好是采用方便的每主格45°刻度。
波特图的另一半则是相位曲线(相移比频率),并被描绘成以“度”来表示的相移比频率关系。
波特相位曲线亦被绘成一种半对数曲线:x轴为采用对数刻度的频率(Hz)、y轴为采用线性刻度的相移(度),y轴最好是采用方便的每主格45°刻度。
幅度波特图要求将电压增益转换成分贝(dB) 。
进行增益分析时,我们将采用以dB(定义为20Log10A)表示的电压增益,其中A为以伏/伏表示的电压增益。
在电压增益波特图上,增益随频率变化的斜线可定义成按+20dB/decade或-20dB/decade增加或减小。
另一种描述同样斜线的方法是按+6dB/octave 或-6dB/octave增加或减小(参见图1.4)以下推导证明了20dB/decade与6dB/octave的等效性:?A(dB) = A(dB) at fb – A(dB) at fa?A(dB) = [Aol(dB) - 20log10(fb/f1)] – [Aol(dB) - 20log10(fa/f1)]?A(dB) = Aol(dB) - 20log10(fb/f1) – Aol(dB) + 20log10(fa/f1)]?A(dB) = 20log10(fa/f1) – 20Log10(fb/f1)]?A(dB) = 20log10(fa/fb)?A(dB) = 20log10(1k/10k) = -20dB/decade?A(dB) = 20log10(fb/fc)?A(dB) = 20log10(10k/20k) = -6db/octave-20dB/decade = -6dB/octave因此:+20dB/decade = +6dB/octave -20dB/decade = -6dB/octave+40dB/decade = +12dB/octave -40dB/decade = -12dB/octave+60dB/decade = +18dB/Octave -60dB/decade = -18dB/Octave极点à单个极点响应在波特图(幅度或增益曲线)上具有按-20dB/decade 或-6db/octave斜率下降的特点。
简单环路稳定性判定
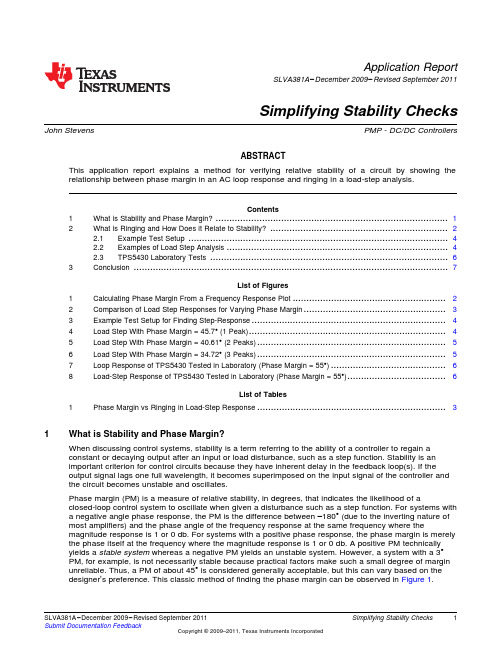
Application ReportSLVA381A–December2009–Revised September2011Simplifying Stability Checks John Stevens PMP-DC/DC ControllersABSTRACTThis application report explains a method for verifying relative stability of a circuit by showing the relationship between phase margin in an AC loop response and ringing in a load-step analysis.Contents1What is Stability and Phase Margin? (1)2What is Ringing and How Does it Relate to Stability? (2)2.1Example Test Setup (4)2.2Examples of Load Step Analysis (4)2.3TPS5430Laboratory Tests (6)3Conclusion (7)List of Figures1Calculating Phase Margin From a Frequency Response Plot (2)2Comparison of Load Step Responses for Varying Phase Margin (3)3Example Test Setup for Finding Step-Response (4)4Load Step With Phase Margin=45.7°(1Peak) (4)5Load Step With Phase Margin=40.61°(2Peaks) (5)6Load Step With Phase Margin=34.72°(3Peaks) (5)7Loop Response of TPS5430Tested in Laboratory(Phase Margin=55°) (6)8Load-Step Response of TPS5430Tested in Laboratory(Phase Margin=55°) (6)List of Tables1Phase Margin vs Ringing in Load-Step Response (3)1What is Stability and Phase Margin?When discussing control systems,stability is a term referring to the ability of a controller to regain aconstant or decaying output after an input or load disturbance,such as a step function.Stability is animportant criterion for control circuits because they have inherent delay in the feedback loop(s).If theoutput signal lags one full wavelength,it becomes superimposed on the input signal of the controller and the circuit becomes unstable and oscillates.Phase margin(PM)is a measure of relative stability,in degrees,that indicates the likelihood of aclosed-loop control system to oscillate when given a disturbance such as a step function.For systems witha negative angle phase response,the PM is the difference between–180°(due to the inverting nature ofmost amplifiers)and the phase angle of the frequency response at the same frequency where themagnitude response is1or0db.For systems with a positive phase response,the phase margin is merely the phase itself at the frequency where the magnitude response is1or0db.A positive PM technically yields a stable system whereas a negative PM yields an unstable system.However,a system with a3°PM,for example,is not necessarily stable because practical factors make such a small degree of margin unreliable.Thus,a PM of about45°is considered generally acceptable,but this can vary based on the designer’s preference.This classic method of finding the phase margin can be observed in Figure1.1 SLVA381A–December2009–Revised September2011Simplifying Stability Checks Submit Documentation FeedbackCopyright©2009–2011,Texas Instruments IncorporatedFigure1.Calculating Phase Margin From a Frequency Response PlotAs can be seen in the plot of Figure1,an AC response,(Magnitude on top and Phase underneath),isgiven.The Magnitude Response plot is shown to be0db at15.99kHz.The phase at15.99kHz is80.88°.Thus,the phase margin of this system is80.88°.Although this method is acceptable for simulated devices,in real systems it creates many problems.For example,many devices with control systems cannot tolerate the wide range of frequencies necessary for such an analysis.Further,to conduct such a test requires an isolation of the feedback loop which in some cases is difficult or impossible.Although tools such as network analyzers can test stability directly,the cost sometimes restricts their availability.Therefore,an alternate method to test stability using a commonlaboratory oscilloscope is now considered.2What is Ringing and How Does it Relate to Stability?Ringing is the unwanted oscillation seen in a voltage or current signal when the input or load is changed very quickly.If the controller cannot correct the output properly,overshoot and/or undershoot can occur, until it is damped out according to the damping factor of the system.In the extreme case,the systembecomes unstable and the output oscillates indefinitely at the frequency where the gain=1and phase margin is0dB.In a circuit with a positive phase margin,the oscillations decay and are limited in number.Considering this,it can be stated that fewer bumps(peaks)or ripples in the transient load-step response correspond to more damping and a higher phase margin.In Figure2,this relationship can be observed.2Simplifying Stability Checks SLVA381A–December2009–Revised September2011Submit Documentation FeedbackCopyright©2009–2011,Texas Instruments Incorporatedparison of Load Step Responses for Varying Phase Margin As Figure2illustrates,the response with the highest PM,54.08°,(in brown),damps the fastest.As PM decreases,the number of oscillatory peaks increases until eventually,at very low PM,the circuit is inlightly damped oscillation.For a quick reference,see Table1.Table1.Phase Margin vs Ringing in Load-Step ResponsePhase Margin(Degrees)Ringing(Bumps)80.88060.75057.64054.08050.16145.7 1.540.61234.72327.78419.4369.09173 SLVA381A–December2009–Revised September2011Simplifying Stability Checks Submit Documentation FeedbackCopyright©2009–2011,Texas Instruments IncorporatedScope2.1Example Test SetupThe device under test (DUT)can be set up as seen in Figure 3Figure 3.Example Test Setup for Finding Step-Response2.2Examples of Load Step AnalysisFor a better definition of what an oscillatory bump or peak is,see Figure 4,Figure 5,and Figure 6.Figure 4.Load Step With Phase Margin =45.7°(1Peak)4Simplifying Stability ChecksSLVA381A –December 2009–Revised September 2011Submit Documentation FeedbackCopyright ©2009–2011,Texas Instruments IncorporatedFigure5.Load Step With Phase Margin=40.61°(2Peaks)Figure6.Load Step With Phase Margin=34.72°(3Peaks)5 SLVA381A–December2009–Revised September2011Simplifying Stability Checks Submit Documentation FeedbackCopyright©2009–2011,Texas Instruments Incorporated2.3TPS5430Laboratory TestsTo verify that these simulations produce realistic results,the TPS5430was tested in a laboratory.Figure7.Loop Response of TPS5430Tested in Laboratory(Phase Margin=55°)NOTE:Uses a50%Load Step at1-10µs Slew RateFigure8.Load-Step Response of TPS5430Tested in Laboratory(Phase Margin=55°) In the laboratory test of the load-step response in Figure8,there are no oscillatory peaks.At a phasemargin of55°,this result matches what is found in Table1.6Simplifying Stability Checks SLVA381A–December2009–Revised September2011Submit Documentation FeedbackCopyright©2009–2011,Texas Instruments Incorporated Conclusion 3ConclusionThis application report explains the link between the load-step response and the loop response of a given circuit.Based on this relationship,this document provides details to make an estimate at relative stability based on phase margin.The designer must always consider that this measurement requires someinterpretation of load-step response and that these measurements can vary.Revision HistoryChanges from Original(December,2009)to A Revision Page •Corrected notation in Figure2and related description for better clarification (2)NOTE:Page numbers for previous revisions may differ from page numbers in the current version.7 SLVA381A–December2009–Revised September2011Revision History Submit Documentation FeedbackCopyright©2009–2011,Texas Instruments IncorporatedIMPORTANT NOTICETexas Instruments Incorporated and its subsidiaries(TI)reserve the right to make corrections,modifications,enhancements,improvements, and other changes to its products and services at any time and to discontinue any product or service without notice.Customers should obtain the latest relevant information before placing orders and should verify that such information is current and complete.All products are sold subject to TI’s terms and conditions of sale supplied at the time of order acknowledgment.TI warrants performance of its hardware products to the specifications applicable at the time of sale in accordance with TI’s standard warranty.Testing and other quality control techniques are used to the extent TI deems necessary to support this warranty.Except where mandated by government requirements,testing of all parameters of each product is not necessarily performed.TI assumes no liability for applications assistance or customer product design.Customers are responsible for their products and applications using TI components.To minimize the risks associated with customer products and applications,customers should provide adequate design and operating safeguards.TI does not warrant or represent that any license,either express or implied,is granted under any TI patent right,copyright,mask work right, or other TI intellectual property right relating to any combination,machine,or process in which TI products or services are rmation published by TI regarding third-party products or services does not constitute a license from TI to use such products or services or a warranty or endorsement e of such information may require a license from a third party under the patents or other intellectual property of the third party,or a license from TI under the patents or other intellectual property of TI.Reproduction of TI information in TI data books or data sheets is permissible only if reproduction is without alteration and is accompanied by all associated warranties,conditions,limitations,and notices.Reproduction of this information with alteration is an unfair and deceptive business practice.TI is not responsible or liable for such altered rmation of third parties may be subject to additional restrictions.Resale of TI products or services with statements different from or beyond the parameters stated by TI for that product or service voids all express and any implied warranties for the associated TI product or service and is an unfair and deceptive business practice.TI is not responsible or liable for any such statements.TI products are not authorized for use in safety-critical applications(such as life support)where a failure of the TI product would reasonably be expected to cause severe personal injury or death,unless officers of the parties have executed an agreement specifically governing such use.Buyers represent that they have all necessary expertise in the safety and regulatory ramifications of their applications,and acknowledge and agree that they are solely responsible for all legal,regulatory and safety-related requirements concerning their products and any use of TI products in such safety-critical applications,notwithstanding any applications-related information or support that may be provided by TI.Further,Buyers must fully indemnify TI and its representatives against any damages arising out of the use of TI products in such safety-critical applications.TI products are neither designed nor intended for use in military/aerospace applications or environments unless the TI products are specifically designated by TI as military-grade or"enhanced plastic."Only products designated by TI as military-grade meet military specifications.Buyers acknowledge and agree that any such use of TI products which TI has not designated as military-grade is solely at the Buyer's risk,and that they are solely responsible for compliance with all legal and regulatory requirements in connection with such use. TI products are neither designed nor intended for use in automotive applications or environments unless the specific TI products are designated by TI as compliant with ISO/TS16949requirements.Buyers acknowledge and agree that,if they use any non-designated products in automotive applications,TI will not be responsible for any failure to meet such requirements.Following are URLs where you can obtain information on other Texas Instruments products and application solutions:Products ApplicationsAudio /audio Communications and Telecom /communicationsAmplifiers Computers and Peripherals /computersData Converters Consumer Electronics /consumer-appsDLP®Products Energy and Lighting /energyDSP Industrial /industrialClocks and Timers /clocks Medical /medicalInterface Security /securityLogic Space,Avionics and Defense /space-avionics-defense Power Mgmt Transportation and Automotive /automotiveMicrocontrollers Video and Imaging /videoRFID OMAP Mobile Processors /omapWireless Connctivity /wirelessconnectivityTI E2E Community Home Page Mailing Address:Texas Instruments,Post Office Box655303,Dallas,Texas75265Copyright©2011,Texas Instruments Incorporated。
环路稳定性分析
图3.3 调节器电路
调节器的输入信号即为与参考电压相比较的误差放大器的输出信号。 调节器的输出即为PHASE节点,调节器的增益可以简便地看成是入 电压 VIN 与IC 内部集成振荡器的峰峰值电压 DVOSC 的比值。 即为:
GAIN Modulator =
(2) 输出滤波器
VIN DVOSC
传递函数为:
H comp
1 ) R2 gC 2 1 = g R1 gC1 s g( s + C1 + C 2 ) R 2 gC1 gC 2 (s +
图3.9 TypeⅡ型补偿网络幅频及相频图
TypeⅡ型闭环系统结构图如下图所示:
图3.10 TypeⅡ型闭环系统结构图 系统传递函数为:
1 ) V 1 + s gESR gCOUT 1 R2 gC2 H= g g IN g R1 gC1 s g( s + C1 + C2 ) DVOSC 1 + s g( ESR + DCR )gCOUT + s 2 gLOUT gCOUT R2 gC1 gC2 (s +
X2(s) 为控制
开环控制的传递函数为:
X 2 ( s) G1 ( s ) = X 1 ( s)
两个环节串联:
图1.2 两环节控制模型
可以得出:
X 2 (s) G1 ( s ) = X1 (s)
X 3 (s) G2 ( s ) = X 2 (s)
X3 (s) X2 (s) X3 (s) G(s) = = g = G1(s)g 2 (s) G X1(s) X1(s) X2 (s)
系统波特效果图:
图3.11 系统波特效果图
2)TypeⅢ 型结构如图所示
20140310反馈环路分析及稳定性V0.2
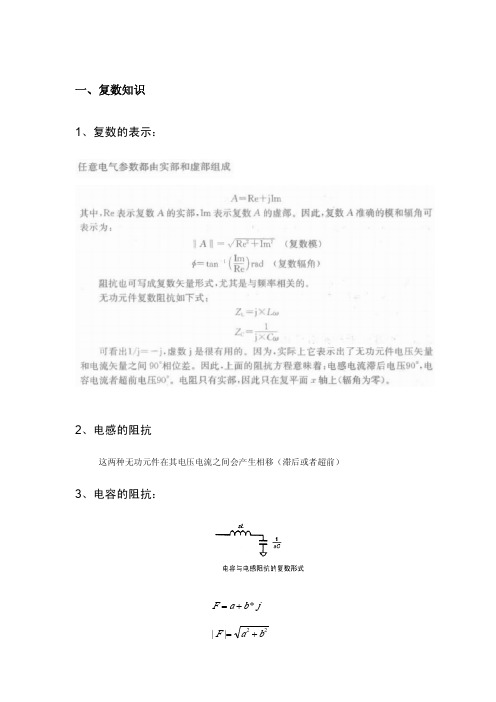
一、复数知识1、复数的表示:2、电感的阻抗这两种无功元件在其电压电流之间会产生相移(滞后或者超前)3、电容的阻抗:jb a F *+=22||b a F +=arctan(ab =φLw X L *=cw X C *1=二、反馈控制基础知识:1、S 平面复平面:w j S *+=σ。
但是一般分析稳态,考虑稳态激励时,w j S *=。
增益和相位定义在稳态时2、波特图:波特图由两个图组成:一个是传递函数幅值(以db 表示)与对数频率之间的关系。
另一个是角度相位与对数频率之间的关系。
因为幅频特性图中,两个坐标都是用对数表示的,单极点(如电容阻抗,在零频率处的为无穷大),或者单一零点(如电感阻抗,在零频率处的为零)的传递函数其波特图是一条直线。
对数幅频特性|))(lg(|*20)(jw G w L =对数相频特性)(jw G ∠=ϕ单位为db/十倍频,横坐标是w 的对数,lg w 每增加单位长度(即w 每增加十倍时),纵坐标)(w L 减少20db ,故斜率为-20db/十倍频。
若x 轴和y 周围同比例刻度坐标,增益曲线将会与x 轴成-45度,此斜率也就为该角度的正切值,即为)45tan(°−=—1。
因此-20db/十倍频(-6/倍频)也称“—1”斜率。
注意这里说的“—1”斜率只是在横坐标和纵坐标取同比例刻度的坐标时成立的,即频率每变化十倍,增益减小十倍,即为“—1”斜率3、零极点:在稳定性设计中,我们对函数的这两部分很感兴趣:在什么参数(即频率)下,函数值为零,什么时候为无穷大。
这两个条件被称之为函数的零点和极点如果在任何一个频率点,闭环传递函数)(s G 为无穷大,也就是说,如果闭环传递函数有一个极点,那么变换器就是不稳定的。
传递函数只有当分母为零时才为无穷大传递函数中分母中含S ,若S 取特定值,可使分母等于0,传递函数则为无限大,定义这样的S 值为极点。
使传递函数分母等于0的S 的频率为谐振频率(或者转折频率),也就是极点位置。
开关电源的环路稳定性-总论-工控论坛-技术中心-中国工控网

开关电源的环路稳定性-总论-工控论坛-技术中心-中国工控网环路稳定的标准.只要在增益为1时(0dB),剪切频率下,整个环路的相移小于360度,环路就是稳定的,一般设计相角余量为45度。
对于环路带宽的选择有以下几个限制:根据采样定理,剪切频率不可能大于1/2 Fs;为了抑制电网纹波(120Hz)能够减小并且保证直流控制精度,设计该频率点附近的增益(开环增益)要足够大。
【抑制输入电压的低频噪声和使得输出电压相对于参考电压的直流误差减小】误差放大器的带宽不是无穷大(运放的开环增益随着频率的上升而减小),当把剪切频率设的很高时会受到补偿放大器无法提供增益的限制,及电容零点受温度影响等.所以一般实际剪切频率最大取开关频率的1/6-1/10。
对于三种误差放大器我做了一些推导并导出了它们的图形:1型:“单极点补偿,适用于电流型控制和工作在DCM方式并且滤波电容的ESR零点频率较低的电源.其主要作用原理是把控制带宽拉低,在功率部分或加有其他补偿的部分的相位达到180度以前使其增益降到0dB. 也叫主极点补偿. ”2型:“双极点,单零点补偿,适用于功率部分只有一个极点的补偿.如:所有电流型控制和非连续方式电压型控制.”以2型为例,分析一下,R2,C2,C1的作用。
从以下的分析来看,电阻R1和电容C1在原点(理论上)形成一个极点,受放大器开环增益的限制,这个极点并不是从原点开始的,它的作用是提高低频时候的增益。
电阻R2和电容C2形成一个零点,作用是提升设定的某一点的相位电阻R2和电容C1(忽略C2的影响,频率较高时C2的阻抗很小,近似于短路,导纳=2×pi×f×C,电容越大同样的频率的阻抗越低,导纳越大)形成一个高频极点,它的目的是来衰减高频噪音和开关频率的影响,提高系统的增益裕度.对于元件的取值一般的来说: R3<<R1 C1<<C23型:“三极点,双零点补偿.适用于输出带LC谐振的拓扑,如所有没有用电流型控制的电感电流连续方式拓扑. ”一般的我们要求只要在增益为1时(0dB),剪切频率下,整个环路的相移小于360度,环路就是稳定的,一般设计相角余量为45度。
利用Pspice模型分析放大器环路的稳定性

利用Pspice模型分析放大器环路的稳定性放大器放大器放大器的稳定性,但评估一个较为复杂的电路是否稳定,难度可能会大得多。
本文使用常见的Pspice宏模型结合一些简单的电路设计技巧来提高设计工程师的设计能力,以确保其设计的实用性与稳定性。
导致放大器不稳定的原因在任何相关频率下,只要环路增益不转变为正反馈,则闭环系统稳定。
环路增益是一个相量,因而具有幅度和相位特性。
环路由理想的负反馈转变为正反馈所带来的额外相移即是最常见的不稳定因素。
环路增益相位的&ldquo;相关&rdquo;频率,一般出现在环路增益大于或等于0dB之处。
图1:总等效噪声密度-反馈电阻关系曲线.的放大器电路,通过断开环路,测量信号在环路中传播一次所产生的相移,即可推算出电路的稳定情况.以下例子介绍的方法可利用仿真软件,运算放大器宏模型以及Pspice提供的理想元器件来实现。
图2:跨阻抗放大器。
高速低噪声跨阻放大器(TIA)稳定性示例我们以一个跨阻放大器(TIA)为例,通过分析其稳定性来阐述我们将要推荐的技术。
TIA广泛应用在工业领域和消费领域,例如LIDAR(光探测和测距)、条形码扫描仪、工厂自动化等。
设计工程师遇到的挑战是,在不会造成衰减和老化的情况下,如何最大化信噪比(SNR),以及如何获得足够的速度/带宽来传递所需的信号.图2为采用了LMH6629的放大器示意图,这款超高速(GBWP=4GHz)低噪声(0。
69nV/RtHz)器件具有+10V/V的最小稳定增益(COMP引脚连至VCC)的。
LMH6629的补偿(COMP)输入可以连至VEE,从而进一步将最小稳定增益降低到4V/V。
为获得最大的转换速率和带宽(小信号和大信号),在这个例子中,COMP引脚被连接到VCC。
可获得的带宽与放大器GBWP直接相关,与跨阻增益(RF)和光电二极管内的寄生电容成反比。
确定一个给定放大器所使用的反馈电阻(RF)有一个简单方便的办法:在使用了LMH6629的情况下,总等效输入电流噪声密度“ini&rdquo;与RF的关系.图中的&ldquo;in&rdquo;是LMH6629的输入噪声电流,&ldquo;en”是LMH6629的输入噪声电压,&ldquo;k&rdquo;是波尔兹曼常数,而&ldquo;T&rdquo;是用℃表示的绝对温度。
环路稳定性分析范文

环路稳定性分析范文环路稳定性分析是指对系统的闭环控制回路进行稳定性评估的一种方法。
在控制系统中,闭环控制回路的稳定性是一个至关重要的指标,它决定了系统的性能和可靠性。
在本文中,我将介绍环路稳定性的概念、常见的分析方法以及如何通过稳定性分析来优化系统的闭环控制回路。
闭环控制回路由控制器、系统和反馈组成。
控制器接收反馈信号,并根据系统的输出进行调整,以使系统的输出接近期望值。
为了确保控制系统的稳定性,必须满足闭环控制回路的极点位置位于左半平面。
根轨迹法是一种通过绘制系统的开环传递函数极点随控制器参数变化的路径来评估系统的稳定性的方法。
通过绘制根轨迹图,可以直观地观察系统的极点位置,从而判断系统是否稳定。
根轨迹法还可以通过调整控制器参数来优化系统的闭环控制回路。
频域法是一种使用频率响应函数来分析系统稳定性的方法。
通过将系统的传递函数表示为复频域上的表达式,我们可以使用频率响应函数来分析系统的频率特性和稳定性。
常见的频域法包括振荡饱和法和Bode图法。
这些方法可以用来评估系统的衰减比、相位裕度和增益裕度等指标,从而判断系统的稳定性。
状态空间法是一种使用系统的状态方程来分析稳定性的方法。
通过求解系统状态方程的特征根,可以判断系统的稳定性。
状态空间法是一种更为准确和全面的稳定性分析方法,它可以考虑系统的所有状态变量,并提供系统的详细动态特性信息。
在进行环路稳定性分析时,我们通常关注系统的相位裕度、增益裕度和衰减比等指标。
相位裕度是指系统的相位与临界相位之间的差距,是评估系统稳定性的重要指标。
增益裕度是指系统增益与临界增益之间的差距,也是判断系统稳定性的重要依据。
衰减比是指系统在闭环控制下输出与输入的幅值比值,它可以通过计算系统的频率响应函数来得到。
对于不稳定的系统,我们可以通过调整控制器参数、增加补偿网络或采取其他控制策略来提高系统的稳定性。
例如,可以通过增加比例增益、增加积分时间常数或增加滤波器来提高系统的稳定性。
- 1、下载文档前请自行甄别文档内容的完整性,平台不提供额外的编辑、内容补充、找答案等附加服务。
- 2、"仅部分预览"的文档,不可在线预览部分如存在完整性等问题,可反馈申请退款(可完整预览的文档不适用该条件!)。
- 3、如文档侵犯您的权益,请联系客服反馈,我们会尽快为您处理(人工客服工作时间:9:00-18:30)。
6环路稳定性评价方法...............................................................................................................................................3
在实际测试过程中应注意的环节是注入电阻的位置,以及阻值大小。为了减小测量误差,实测一般选取10~100Ω的电阻;干扰信号的大小一般要求其幅度不能超过输出电压的5%,否则测出来的结果是不准确的。
图2环路稳定性测试接线图
6.3环路稳定性评价指标判定
表1(环路稳定性评价指标)给出了相位裕度和增益裕度的数值变化与环路稳定性的关系。
5.4穿越频率............................................................................................................................................................ 2
5.2增益裕度(GainMargin):又称增益容限,是指当开关电源的输出随着负载特性的改变而控制环路所对应频率点的相位为0deg时的增益量。
5.3相位裕度(PhaseMargin):又称相位容限,是指当开关电源的输出随着负载特性的改变而控制环路的增益量下降到0dB时所对应频率点的相位。(实际是衰减)。
3引用标准.................................................................................................................................................................. 2
5定义.......................................................................................................................................................................... 2
5.1环路稳定性.............................................................................................................................. ......................... 2
(3)、同时依据测试的波德图对电源特性进行分析,穿越频率按20dB/Dec闭合,频带宽度一般为开关频率的1/20~1/6。
7.附录
无
环路稳定性测试接线图如图2所示,将信号电阻(Inserted Resistor)接入电源的环路控制电路中,注入一特定幅度和频率范围的扫频干扰信号(OUT),当干扰信号达到一定的幅度时,环路系统便对干扰信号有所响应,然后使用频率响应分析仪对电源环路输出端(CH2)和电源环路干扰信号注入端(CH1)同时进行比值跟踪测量,则可以得出频率与增益和相位的关系曲线图——波德曲线图(Bode Plot Graph),如图1所示。
穿越频率,又称为频带宽度,频带宽度的大小可以反映控制环路响应的快慢。一般认为带宽越宽,其对负载动态响应的抑制能力就越好,过冲、欠冲越小,恢复时间也就越快,系统从而可以更稳定。但是由于受到右半平面零点的影响,以及原材料、运放的带宽不可能无穷大等综合因素的限制,电源的带宽也不能无限制提高,一般取开关频率的1/20~1/6。
2适用范围.................................................................................................................................................................. 2
5.2相位裕度............................................................................................................................................................ 2
6.1环路稳定性评价指标........................................................................................................................................ 3
综合以上,一般可从以下三个原则判定电源环路稳定性:
(1)、在室温和标准输入、正常负载条件下,闭环回路增益为0dB(无增益)的情况下,相位裕度是应大于45度;如果输入电压、负载、温度变化范围非常大,相位裕度不应小于30度。
(2)、同步检查在相位接近于0deg时,闭环回路增益裕度应大于7dB,为了不接近不稳定点,一般认为增益裕度12dB以上是必要的。
7附录.........................................................................................................................................................................4
5.4穿越频率(Crossover Frequency):又称频带宽度,是指在频率-增益曲线上,增益为零时所对应的频率值。
6.环路稳定性评价方法
6.1环路稳定性评价指标
衡量开关电源稳定性的指标是相位裕度和增益裕度。同时穿越频率,也应作为一个参考指标。
(1)相位裕度是指:增益降到0dB时所对应的相位。
6.2开关电源控制环路稳定性验证........................................................................................................................ 3
6.3环路稳定性评价指标判定................................................................................................................................ 3
1目的
本规范为产品验证阶段的环路稳定性测试提供指导,保证正确测量环路特性和合理评估电源产品的稳定程度。
2适用范围
本规范适用于MOSO消费类电源和LED电源验证过程中进行的电路环路稳定性评价。
3引用标准
无
4测试仪器/设备
N4LPSM2200频率响应分析仪
5、定义
5.1环路稳定性:是评价电源输出电压品质的一项重要指标,即直接决定电源启动特性、输入电压跃变响应特性、负载跃变响应特性、高低温稳定性以及影响生产和调试难易度等的特性。
5.3增益裕度............................................................................................................................................................ 2表1环路Biblioteka 定性评价指标相位裕度[度]
增益裕度[dB]
评价指标
20
3
严重的减幅振荡,数据极差
30
5
少量的减幅振荡,数据较差
45
7
临界阻尼,减幅振荡最佳响应时间
60
10
合适数据
72
12
希望作为基准的值,闭环响应中无峰值
工程中一般认为在室温和标准输入、正常负载条件下,环路的相位裕量要求大于45°,以确保系统在各种误差和参数变化情况下的稳定性。当负载特性、输入电压变化较大时,需考虑在所有负载状况下以及输入电压范围内的环路相位裕量应大于30°。
目录
1目的.......................................................................................................................................................................... 2
(2)增益裕度是指:相位为0deg时所对应的增益大小(实际是衰减)。
(3)穿越频率是指:增益为0dB时所对应的频率值。
相位裕度,增益裕度,穿越频率,如图2(波德图)所示。
图1波德图
注:图1中,相位容限即相位裕度,增益容限即增益裕度。
6.2开关电源控制环路稳定性验证
开关电源环路的频响特性,如果电源的负载特性在某一频率下增益等于1(0dB)且相移量为180°时,那么电源控制环路将因出现同相正反馈(此相移量加原设定180°相移,总相移量为360°),因而有足够能量返回系统,并在此频率下维持振荡。为避免电源系统出现类似破坏性的不稳定现象,通常情况下,环路控制电路都会采用反馈补偿组件来降低高频端的增益,使得开关电源在预设频率范围内都保持稳定。