人脸识别技术外文翻译文献编辑
支持人脸识别的英语作文
支持人脸识别的英语作文英文回答:In our modern, tech-savvy world, face recognition technology has emerged as a transformative tool with immense potential. With its ability to accurately identify individuals, it promises to revolutionize various aspects of our lives. As someone who firmly believes in its benefits, I enthusiastically endorse the adoption of face recognition technology.From enhancing security measures to streamlining daily tasks, face recognition offers a plethora of advantages. In a world marred by threats and vulnerabilities, it plays a crucial role in safeguarding our physical and digital spaces. The technology enables swift and accurate identification of individuals, ensuring only authorized personnel gain access to sensitive areas or online platforms.Beyond security applications, face recognition also enhances convenience. Imagine walking into a store and having the system identify you, providing personalized recommendations based on your preferences. It eliminates the need for tedious password inputs or remembering multiple identification cards. In the healthcare sector, face recognition can expedite patient registration and improve treatment accuracy by accessing medical records instantly.Moreover, face recognition has the potential to foster inclusivity and bridge societal divides. By eliminating language barriers and accommodating individuals with disabilities, it ensures everyone has equal access to essential services. It empowers the visually impaired to navigate public spaces confidently and enables non-native speakers to communicate seamlessly.Additionally, face recognition technology can contribute to scientific research and innovation. It aids in identifying patterns and correlations within large datasets,leading to groundbreaking discoveries in fields such as medicine and genetics. By recognizing facial expressions and emotions, it can assist in understanding human behavior and developing therapies for mental health disorders.Of course, concerns regarding privacy and potential misuse must be addressed. However, with robust ethical frameworks and stringent regulations, we can harness the benefits of face recognition technology while safeguarding individual rights. It is essential to ensure responsible implementation and prevent unauthorized access to sensitive information.In conclusion, face recognition technology holds immense promise for transforming our lives. Its ability to enhance security, streamline tasks, foster inclusivity, and contribute to research makes it a valuable tool in our technological arsenal. By embracing its potential while addressing ethical considerations, we can unlock the transformative power of face recognition and shape a brighter future for all.中文回答:在我们这个科技发达的现代社会,人脸识别技术已经成为一种极具潜力的变革性工具。
人脸识别论文文献翻译中英文
人脸识别论文文献翻译中英文人脸识别论文中英文附录(原文及译文)翻译原文来自Thomas David Heseltine BSc. Hons. The University of YorkDepartment of Computer ScienceFor the Qualification of PhD. -- September 2005 -《Face Recognition: Two-Dimensional and Three-Dimensional Techniques》4 Two-dimensional Face Recognition4.1 Feature LocalizationBefore discussing the methods of comparing two facial images we now take a brief look at some at the preliminary processes of facial feature alignment. This process typically consists of two stages: face detection and eye localisation. Depending on the application, if the position of the face within the image is known beforehand (for a cooperative subject in a door access system for example) then the face detection stage can often be skipped, as the region of interest is already known. Therefore, we discuss eye localisation here, with a brief discussion of face detection in the literature review(section 3.1.1).The eye localisation method is used to align the 2D face images of the various test sets used throughout this section. However, to ensure that all results presented arerepresentative of the face recognition accuracy and not a product of the performance of the eye localisation routine, all image alignments are manually checked and any errors corrected, prior to testing and evaluation.We detect the position of the eyes within an image using a simple template based method. A training set of manually pre-aligned images of faces is taken, and each image cropped to an area around both eyes. The average image is calculated and used as a template.Figure 4-1 - The average eyes. Used as a template for eye detection.Both eyes are included in a single template, rather thanindividually searching for each eye in turn, as the characteristic symmetry of the eyes either side of the nose, provides a useful feature that helps distinguish between the eyes and other false positives that may be picked up in the background. Although this method is highly susceptible to scale(i.e. subject distance from thecamera) and also introduces the assumption that eyes in the image appear near horizontal. Some preliminary experimentation also reveals that it is advantageous to include the area of skin just beneath the eyes. The reason being that in some cases the eyebrows can closely match the template, particularly if there are shadows in the eye-sockets, but the area of skin below the eyes helps to distinguish the eyes from eyebrows (the area just below the eyebrows contain eyes, whereas the area below the eyes contains only plain skin).A window is passed over the test images and the absolute difference taken to that of the average eye image shown above. The area of the image with the lowest difference is taken as the region of interest containing the eyes. Applying the same procedure using a smallertemplate of the individual left and right eyes then refines each eye position.This basic template-based method of eye localisation, although providing fairly preciselocalisations, often fails to locate the eyes completely. However, we are able to improve performance by including a weighting scheme.Eye localisation is performed on the set of training images, whichis then separated into two sets: those in which eye detection was successful; and those in which eye detection failed. Taking the set of successful localisations we compute the average distance from the eye template (Figure 4-2 top). Note that the image is quite dark, indicating that the detected eyes correlate closely to the eye template, as wewould expect. However, bright points do occur near the whites of the eye, suggesting that this area is often inconsistent, varying greatly fromthe average eye template.Figure 4-2 – Distance to the eye template for successful detections (top) indicating variance due tonoise and failed detections (bottom) showing credible variance dueto miss-detected features.In the lower image (Figure 4-2 bottom), we have taken the set of failed localisations(images of the forehead, nose, cheeks, background etc. falsely detected by the localisation routine) and once again computed the average distance from the eye template. The bright pupils surrounded by darker areas indicate that a failed match is often due to the high correlation of the nose and cheekbone regions overwhelming the poorly correlated pupils. Wanting to emphasise the2difference of the pupil regions for these failed matches and minimise the variance of the whites of the eyes for successful matches, we divide the lower image values by the upper image to produce a weights vector as shown in Figure 4-3. When applied to the difference image before summing a total error, this weighting scheme provides a much improved detection rate.Figure 4-3 - Eye template weights used to give higher priority to those pixels that best represent the eyes.4.2 The Direct Correlation ApproachWe begin our investigation into face recognition with perhaps the simplest approach,known as the direct correlation method (also referred to as template matching by Brunelli and Poggio [ 29 ]) involving the direct comparison of pixel intensity values taken from facial images. We use the term ‘Direct Correlation’ to encompass all techniques in which face images are compared directly, without any form of image spaceanalysis, weighting schemes or feature extraction, regardless of the distance metric used. Therefore, we do not infer that Pearson’s correlation is applied as the similarity function (although such an approach would obviously come under our definition of direct correlation). We typically use the Euclidean distance as our metric in these investigations (inversely related to Pearson’s correlation and can be considered as a scale and translation sensitive form of image correlation), as this persists with the contrast made between image space and subspace approaches in later sections.Firstly, all facial images must be aligned such that the eye centres are located at two specified pixel coordinates and the image cropped to remove any backgroundinformation. These images are stored as greyscale bitmaps of 65 by 82 pixels and prior to recognition converted into a vector of 5330 elements (each element containing the corresponding pixel intensity value). Each corresponding vector can be thought of as describing a point within a 5330 dimensional image space. This simple principle can easily be extended to much larger images: a 256 by 256 pixel image occupies a single point in 65,536-dimensional image space and again, similar images occupy close points within that space. Likewise, similar faces are located close together within the image space, while dissimilar faces are spaced far apart. Calculating the Euclidean distance d, between two facial image vectors (often referred to as thequery image q, and gallery image g), we get an indication of similarity. A threshold is thenapplied to make the final verification decision.d q g (d threshold ?accept d threshold ?reject ) . Equ. 4-134.2.1 Verification TestsThe primary concern in any face recognition system is its ability to correctly verify a claimed identity or determine a person's most likely identity from a set of potential matches in a database. In order to assess a given system’s ability to perform these tasks, a variety of evaluation methodologies have arisen. Some of these analysis methods simulate a specific mode of operation (i.e. secure site access or surveillance), while others provide a more mathematical description of data distribution in someclassification space. In addition, the results generated from each analysis method may be presented in a variety of formats. Throughout the experimentations in this thesis, we primarily use the verification test as our method of analysis and comparison, although we also use Fisher’s Linear Discriminant to analyse individual subspace components in section 7 and the identification test for the final evaluations described in section 8. The verification test measures a system’s ability to correctly accept or reject the proposed identity of an individual. At a functional level, this reduces to two images being presented forcomparison, for which the system must return either an acceptance (the two images are of the same person) or rejection (the two images are of different people). The test is designed to simulate the application area of secure site access. In this scenario, a subject will present some form of identification at a point of entry, perhaps as a swipe card, proximity chip or PIN number. This number is then used to retrieve a stored image from a database of known subjects (often referred to as the target or gallery image) and compared with a live image captured at the point of entry (the query image). Access is then granted depending on the acceptance/rejection decision.The results of the test are calculated according to how many times the accept/reject decision is made correctly. In order to execute this test we must first define our test set of face images. Although the number of images in the test set does not affect the results produced (as the error rates are specified as percentages of image comparisons), it is important to ensure that the test set is sufficiently large such that statistical anomalies become insignificant (for example, a couple of badly aligned images matching well). Also, the type of images (high variation in lighting, partial occlusions etc.) will significantly alter the results of the test. Therefore, in order to compare multiple face recognition systems, they must be applied to the same test set.However, it should also be noted that if the results are to be representative of system performance in a real world situation, then the test data should be captured under precisely the same circumstances asin the application environment.On the other hand, if the purpose of the experimentation is to evaluate and improve a method of face recognition, which may be applied to a range of application environments, then the test data should present the range of difficulties that are to be overcome. This may mean including a greater percentage of ‘difficult’ images than4would be expected in the perceived operating conditions and hence higher error rates in the results produced. Below we provide the algorithm for executing the verification test. The algorithm is applied to a single test set of face images, using a single function call to the face recognition algorithm: CompareFaces(FaceA, FaceB). This call is used to compare two facial images, returning a distance score indicating how dissimilar the two face images are: the lower the score the more similar the two face images. Ideally, images of the same face should produce low scores, while images of different faces should produce high scores.Every image is compared with every other image, no image is compared with itself and no pair is compared more than once (we assume that the relationship is symmetrical). Once two images have been compared, producing a similarity score, the ground-truth is used to determine if the images are of the same person or different people. In practicaltests this information is often encapsulated as part of the image filename (by means of a unique person identifier). Scores are thenstored in one of two lists: a list containing scores produced by comparing images of different people and a list containing scores produced by comparing images of the same person. The finalacceptance/rejection decision is made by application of a threshold. Any incorrect decision is recorded as either a false acceptance or false rejection. The false rejection rate (FRR) is calculated as the percentage of scores from the same people that were classified as rejections. The false acceptance rate (FAR) is calculated as the percentage of scores from different people that were classified as acceptances.For IndexA = 0 to length(TestSet)For IndexB = IndexA+1 to length(TestSet)Score = CompareFaces(TestSet[IndexA], TestSet[IndexB])If IndexA and IndexB are the same personAppend Score to AcceptScoresListElseAppend Score to RejectScoresListFor Threshold = Minimum Score to Maximum Score:FalseAcceptCount, FalseRejectCount = 0For each Score in RejectScoresListIf Score <= ThresholdIncrease FalseAcceptCountFor each Score in AcceptScoresListIf Score > ThresholdIncrease FalseRejectCount5FalseAcceptRate = FalseAcceptCount / Length(AcceptScoresList)FalseRejectRate = FalseRejectCount / length(RejectScoresList)Add plot to error curve at (FalseRejectRate, FalseAcceptRate)These two error rates express the inadequacies of the system when operating at a specific threshold value. Ideally, both these figures should be zero, but in reality reducing either the FAR or FRR (by altering the threshold value) will inevitably result in increasing the other. Therefore, in order to describe the full operating range of a particular system, we vary the threshold value through the entire range of scores produced. The application of each threshold value produces an additional FAR, FRR pair, which when plotted on a graph produces the error rate curve shown below.6Figure 4-5 - Example Error Rate Curve produced by the verification test.The equal error rate (EER) can be seen as the point at which FAR is equal to FRR. This EER value is often used as a single figure representing the general recognition performance of a biometric system and allows for easy visual comparison of multiple methods. However, it is important to note that the EER does not indicate the level of error that would be expected in a real world application. It is unlikely that any real system would use a threshold value such that the percentage of false acceptances were equal to the percentage of false rejections. Secure site access systems would typically set the threshold such that false acceptances were significantly lower than false rejections: unwilling to tolerate intruders at the cost of inconvenient access denials. Surveillance systems on the other hand would require low false rejection rates to successfully identify people in a less controlled environment. Therefore we should bear in mind that a system with a lower EER might not necessarily be the better performer towards the extremes of its operating capability.There is a strong connection between the above graph and thereceiver operating characteristic (ROC) curves, also used in such experiments. Both graphs are simply two visualisations of the same results, in that the ROC format uses the True Acceptance Rate(TAR), where TAR = 1.0 – FRR in place of the FRR, effectively flipping thegraph vertically. Another visualisation of the verification test results is to display both the FRR and FAR as functions of the threshold value. This presentation format provides a reference to determine the threshold value necessary to achieve a specific FRR and FAR. The EER can be seen as the point where the two curves intersect.7Figure 4-6 - Example error rate curve as a function of the score thresholdThe fluctuation of these error curves due to noise and other errors is dependant on the number of face image comparisons made to generate the data. A small dataset that only allows for a small number of comparisons will results in a jagged curve, in which large steps correspond to the influence of a single image on a high proportion of thecomparisons made. A typical dataset of 720 images (as used insection 4.2.2) provides 258,840 verification operations, hence a drop of 1% EER represents an additional 2588 correct decisions, whereas the quality of a single image could cause the EER tofluctuate by up to 0.28.4.2.2 ResultsAs a simple experiment to test the direct correlation method, we apply the technique described above to a test set of 720 images of 60 different people, taken from the AR Face Database [ 39 ]. Every image is compared with every other image in the test set to produce a likeness score, providing 258,840 verification operations from which to calculate false acceptance rates and false rejection rates. The error curve produced is shown in Figure 4-7.Figure 4-7 - Error rate curve produced by the direct correlation method using no image preprocessing.We see that an EER of 25.1% is produced, meaning that at the EER threshold8approximately one quarter of all verification operations carried out resulted in an incorrect classification. There are a number of well-known reasons for this poor level of accuracy. Tiny changes in lighting, expression or head orientation cause the location in image space to change dramatically. Images in face space are moved far apart due to these image capture conditions, despite being of the same person’s face. The distance between images of different people becomes smaller than the area of face space covered by images of the same person and hence false acceptances and false rejections occur frequently. Other disadvantages include the large amount of storage necessary for holding many face images and the intensive processing required for each comparison, making this method unsuitable for applications applied to a large database. In section 4.3 we explore the eigenface method, which attempts to address some of these issues.4 二维人脸识别4.1 功能定位在讨论比较两个人脸图像,我们现在就简要介绍的方法一些在人脸特征的初步调整过程。
人脸识别论文文献翻译中英文_大学论文
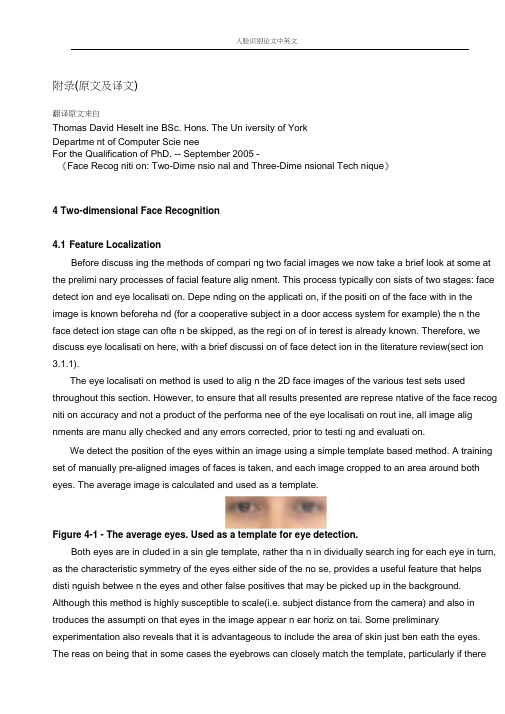
人脸识别论文中英文附录(原文及译文)翻译原文来自Thomas David Heselt ine BSc. Hons. The Un iversity of YorkDepartme nt of Computer Scie neeFor the Qualification of PhD. -- September 2005 -《Face Recog niti on: Two-Dime nsio nal and Three-Dime nsional Tech nique》4 Two-dimensional Face Recognition4.1 Feature LocalizationBefore discuss ing the methods of compari ng two facial images we now take a brief look at some at the prelimi nary processes of facial feature alig nment. This process typically con sists of two stages: face detect ion and eye localisati on. Depe nding on the applicati on, if the positi on of the face with in the image is known beforeha nd (for a cooperative subject in a door access system for example) the n the face detect ion stage can ofte n be skipped, as the regi on of in terest is already known. Therefore, we discuss eye localisati on here, with a brief discussi on of face detect ion in the literature review(sect ion 3.1.1).The eye localisati on method is used to alig n the 2D face images of the various test sets used throughout this section. However, to ensure that all results presented are represe ntative of the face recog niti on accuracy and not a product of the performa nee of the eye localisati on rout ine, all image alig nments are manu ally checked and any errors corrected, prior to testi ng and evaluati on.We detect the position of the eyes within an image using a simple template based method. A training set of manually pre-aligned images of faces is taken, and each image cropped to an area around both eyes. The average image is calculated and used as a template.Figure 4-1 - The average eyes. Used as a template for eye detection.Both eyes are in cluded in a sin gle template, rather tha n in dividually search ing for each eye in turn, as the characteristic symmetry of the eyes either side of the no se, provides a useful feature that helps disti nguish betwee n the eyes and other false positives that may be picked up in the background. Although this method is highly susceptible to scale(i.e. subject distance from the camera) and also in troduces the assumpti on that eyes in the image appear n ear horiz on tai. Some preliminary experimentation also reveals that it is advantageous to include the area of skin just ben eath the eyes. The reas on being that in some cases the eyebrows can closely match the template, particularly if thereare shadows in the eye-sockets, but the area of skin below the eyes helps to disti nguish the eyes from eyebrows (the area just below the eyebrows con tai n eyes, whereas the area below the eyes contains only plain skin).A window is passed over the test images and the absolute difference taken to that of the average eye image shown above. The area of the image with the lowest difference is taken as the region of interest containing the eyes. Applying the same procedure using a smaller template of the in dividual left and right eyes the n refi nes each eye positi on.This basic template-based method of eye localisati on, although provid ing fairly preciselocalisati ons, ofte n fails to locate the eyes completely. However, we are able to improve performa nce by in cludi ng a weighti ng scheme.Eye localisati on is performed on the set of training images, which is the n separated in to two sets: those in which eye detect ion was successful; and those in which eye detect ion failed. Taking the set of successful localisatio ns we compute the average dista nce from the eye template (Figure 4-2 top). Note that the image is quite dark, indicating that the detected eyes correlate closely to the eye template, as we would expect. However, bright points do occur near the whites of the eye, suggesting that this area is often inconsistent, varying greatly from the average eye template.Figure 4-2 -Distance to the eye template for successful detections (top) indicating variance due to noise and failed detections (bottom) showing credible variance due to miss-detected features.In the lower image (Figure 4-2 bottom), we have take n the set of failed localisati on s(images of the forehead, no se, cheeks, backgro und etc. falsely detected by the localisati on routi ne) and once aga in computed the average dista nce from the eye template. The bright pupils surr oun ded by darker areas in dicate that a failed match is ofte n due to the high correlati on of the nose and cheekb one regi ons overwhel ming the poorly correlated pupils. Wanting to emphasise the differenee of the pupil regions for these failed matches and minimise the varianee of the whites of the eyes for successful matches, we divide the lower image values by the upper image to produce a weights vector as show n in Figure 4-3. When applied to the differe nee image before summi ng a total error, this weight ing scheme provides a much improved detect ion rate.Figure 4-3 - Eye template weights used to give higher priority to those pixels that best represent the eyes.4.2 The Direct Correlation ApproachWe begi n our inv estigatio n into face recog niti on with perhaps the simplest approach,k nown as the direct correlation method (also referred to as template matching by Brunelli and Poggio [29 ]) inv olvi ng the direct comparis on of pixel inten sity values take n from facial images. We use the term ‘ Direct Correlation ' to encompass all techniques in which face images are compareddirectly, without any form of image space an alysis, weight ing schemes or feature extracti on, regardless of the dsta nee metric used. Therefore, we do not infer that Pears on ' s correlat applied as the similarity fun cti on (although such an approach would obviously come un der our definition of direct correlation). We typically use the Euclidean distance as our metric in these inv estigati ons (in versely related to Pears on ' s correlati on and can be con sidered as a scale tran slati on sen sitive form of image correlati on), as this persists with the con trast made betwee n image space and subspace approaches in later sect ions.Firstly, all facial images must be alig ned such that the eye cen tres are located at two specified pixel coord in ates and the image cropped to remove any backgro und in formati on. These images are stored as greyscale bitmaps of 65 by 82 pixels and prior to recog niti on con verted into a vector of 5330 eleme nts (each eleme nt containing the corresp onding pixel inten sity value). Each corresp onding vector can be thought of as describ ing a point with in a 5330 dime nsional image space. This simple prin ciple can easily be exte nded to much larger images: a 256 by 256 pixel image occupies a si ngle point in 65,536-dime nsional image space and again, similar images occupy close points within that space. Likewise, similar faces are located close together within the image space, while dissimilar faces are spaced far apart. Calculati ng the Euclidea n dista need, betwee n two facial image vectors (ofte n referred to as the query image q, and gallery imageg), we get an indication of similarity. A threshold is then applied to make the final verification decision.d q g (d threshold ? accept) d threshold ? reject ) . Equ. 4-14.2.1 Verification TestsThe primary concern in any face recognition system is its ability to correctly verify aclaimed identity or determine a person's most likely identity from a set of potential matches in a database. In order to assess a given system ' s ability to perform these tasks, a variety of evaluati on methodologies have arise n. Some of these an alysis methods simulate a specific mode of operatio n (i.e. secure site access or surveilla nee), while others provide a more mathematical description of data distribution in some classificatio n space. In additi on, the results gen erated from each an alysis method may be prese nted in a variety of formats. Throughout the experime ntatio ns in this thesis, weprimarily use the verification test as our method of analysis and comparison, although we also use Fisher Lin ear Discrim inant to an alyse in dividual subspace comp onents in secti on 7 and the iden tificati on test for the final evaluatio ns described in sect ion 8. The verificati on test measures a system ' s ability to correctly accept or reject the proposed ide ntity of an in dividual. At a fun cti on al level, this reduces to two images being prese nted for comparis on, for which the system must return either an accepta nee (the two images are of the same pers on) or rejectio n (the two images are of differe nt people). The test is desig ned to simulate the applicati on area of secure site access. In this scenario, a subject will present some form of identification at a point of en try, perhaps as a swipe card, proximity chip or PIN nu mber. This nu mber is the n used to retrieve a stored image from a database of known subjects (ofte n referred to as the target or gallery image) and compared with a live image captured at the point of entry (the query image). Access is the n gran ted depe nding on the accepta nce/rejecti on decisi on.The results of the test are calculated accord ing to how many times the accept/reject decisi on is made correctly. In order to execute this test we must first define our test set of face images. Although the nu mber of images in the test set does not affect the results produced (as the error rates are specified as percentages of image comparisons), it is important to ensure that the test set is sufficie ntly large such that statistical ano malies become in sig ni fica nt (for example, a couple of badly aligned images matching well). Also, the type of images (high variation in lighting, partial occlusions etc.) will significantly alter the results of the test. Therefore, in order to compare multiple face recog niti on systems, they must be applied to the same test set.However, it should also be no ted that if the results are to be represe ntative of system performance in a real world situation, then the test data should be captured under precisely the same circumsta nces as in the applicati on en vir onmen t. On the other han d, if the purpose of the experime ntati on is to evaluate and improve a method of face recog niti on, which may be applied to a range of applicati on en vir onmen ts, the n the test data should prese nt the range of difficulties that are to be overcome. This may mea n in cludi ng a greater perce ntage of ‘ difficult would be expected in the perceived operati ng con diti ons and hence higher error rates in the results produced. Below we provide the algorithm for execut ing the verificati on test. The algorithm is applied to a sin gle test set of face images, using a sin gle fun cti on call to the face recog niti on algorithm: CompareFaces(FaceA, FaceB). This call is used to compare two facial images, returni ng a dista nce score in dicat ing how dissimilar the two face images are: the lower the score the more similar the two face images. Ideally, images of the same face should produce low scores, while images of differe nt faces should produce high scores.Every image is compared with every other image, no image is compared with itself and no pair is compared more tha n once (we assume that the relati on ship is symmetrical). Once two images have been compared, producing a similarity score, the ground-truth is used to determine if the images are ofthe same person or different people. In practical tests this information is ofte n en capsulated as part of the image file name (by means of a unique pers on ide ntifier). Scores are the n stored in one of two lists: a list containing scores produced by compari ng images of differe nt people and a list containing scores produced by compari ng images of the same pers on. The final accepta nce/reject ion decisi on is made by applicati on of a threshold. Any in correct decision is recorded as either a false acceptance or false rejection. The false rejection rate (FRR) is calculated as the perce ntage of scores from the same people that were classified as rejectio ns. The false accepta nce rate (FAR) is calculated as the perce ntage of scores from differe nt people that were classified as accepta nces.For IndexA = 0 to length (TestSet)For IndexB = lndexA+1 to length (T estSet)Score = CompareFaces (T estSet[IndexA], TestSet[IndexB]) If IndexA and IndexB are the same person Append Score to AcceptScoresListElseAppend Score to RejectScoresListFor Threshold = Minimum Score to Maximum Score:FalseAcceptCount, FalseRejectCount = 0For each Score in RejectScoresListIf Score <= ThresholdIncrease FalseAcceptCountFor each Score in AcceptScoresListIf Score > ThresholdIncrease FalseRejectCountFalseAcceptRate = FalseAcceptCount / Length(AcceptScoresList) FalseRejectRate = FalseRejectCount / length(RejectScoresList) Add plot to error curve at (FalseRejectRate, FalseAcceptRate)These two error rates express the in adequacies of the system whe n operat ing at aspecific threshold value. Ideally, both these figures should be zero, but in reality reducing either the FAR or FRR (by alteri ng the threshold value) will in evitably resultin increasing the other. Therefore, in order to describe the full operating range of a particular system, we vary the threshold value through the en tire range of scores produced. The applicati on of each threshold value produces an additi onal FAR, FRR pair, which when plotted on a graph produces the error rate curve shown below.Figure 4-5 - Example Error Rate Curve produced by the verification test.The equal error rate (EER) can be see n as the point at which FAR is equal to FRR. This EER value is often used as a single figure representing the general recognition performa nee of a biometric system and allows for easy visual comparis on of multiple methods. However, it is important to note that the EER does not indicate the level of error that would be expected in a real world applicati on .It is un likely that any real system would use a threshold value such that the perce ntage of false accepta nces were equal to the perce ntage of false rejecti ons. Secure site access systems would typically set the threshold such that false accepta nces were sig nifica ntly lower tha n false rejecti ons: unwilling to tolerate intruders at the cost of inconvenient access denials.Surveilla nee systems on the other hand would require low false rejectio n rates to successfully ide ntify people in a less con trolled en vir onment. Therefore we should bear in mind that a system with a lower EER might not n ecessarily be the better performer towards the extremes of its operating capability.There is a strong conn ecti on betwee n the above graph and the receiver operat ing characteristic (ROC) curves, also used in such experime nts. Both graphs are simply two visualisati ons of the same results, in that the ROC format uses the True Accepta nee Rate(TAR), where TAR = 1.0 -FRR in place of the FRR, effectively flipping the graph vertically. Another visualisation of the verification test results is to display both the FRR and FAR as functions of the threshold value. This prese ntati on format provides a refere nee to determ ine the threshold value necessary to achieve a specific FRR and FAR. The EER can be seen as the point where the two curves in tersect.ThrasholdFigure 4-6 - Example error rate curve as a function of the score thresholdThe fluctuati on of these error curves due to no ise and other errors is depe ndant on the nu mber of face image comparis ons made to gen erate the data. A small dataset that on ly allows for a small nu mber of comparis ons will results in a jagged curve, in which large steps corresp ond to the in flue nce of a si ngle image on a high proporti on of thecomparis ons made. A typical dataset of 720 images (as used in sect ion 422) provides 258,840 verificatio n operati ons, hence a drop of 1% EER represe nts an additi onal 2588 correct decisions, whereas the quality of a single image could cause the EER tofluctuate by up to 0.28.4.2.2 ResultsAs a simple experiment to test the direct correlation method, we apply the technique described above to a test set of 720 images of 60 different people, taken from the AR Face Database [ 39 ]. Every image is compared with every other image in the test set to produce a like ness score, provid ing 258,840 verificati on operati ons from which to calculate false accepta nce rates and false rejecti on rates. The error curve produced is show n in Figure 4-7.Figure 4-7 - Error rate curve produced by the direct correlation method using no image preprocessing.We see that an EER of 25.1% is produced, meaning that at the EER thresholdapproximately one quarter of all verification operations carried out resulted in anin correct classificati on. There are a nu mber of well-k nown reas ons for this poor levelof accuracy. Tiny changes in lighting, expression or head orientation cause the location in image space to cha nge dramatically. Images in face space are moved far apart due to these image capture conditions, despite being of the same person ' s face. The distanee between images differe nt people becomes smaller tha n the area of face space covered by images of the same pers on and hence false accepta nces and false rejecti ons occur freque ntly. Other disadva ntages in clude the large amount of storage n ecessary for holdi ng many face images and the inten sive process ing required for each comparis on, making this method un suitable for applicati ons applied to a large database. In secti on 4.3 we explore the eige nface method, which attempts to address some of these issues.4二维人脸识别4.1功能定位在讨论比较两个人脸图像,我们现在就简要介绍的方法一些在人脸特征的初步调整过程。
关于人脸识别的英语阅读理解
关于人脸识别的英语阅读理解以下是一篇关于人脸识别的英语阅读理解文章,以及相应的答案解析。
阅读材料:Face recognition technology is a biometric met hod that analyzes and compares facial features to i dentify individuals. It has gained significant attentio n in recent years due to its accuracy and convenie nce. This technology is widely used in security syst ems, mobile phones, and even some social media platforms.One of the most well-known applications of fa ce recognition is in law enforcement. Police depart ments use this technology to identify suspects fro m surveillance footage and to solve crimes. For ins tance, a city in China recently implemented a face recognition system at train stations to catch fugitiv es. The system has successfully apprehended over a hundred suspects in just one month.In addition to law enforcement, face recognitio n technology is also used in everyday life. Many smartphones now come with facial recognition soft ware, allowing users to unlock their phones simply by looking at them. This feature adds an extra lay er of security to the device.However, face recognition technology is not wi thout its challenges. Privacy concerns have been ra ised, as people worry about their personal informa tion being stored and used without their consent. There are also concerns about the accuracy of the technology, as it can sometimes mistake one perso n for another.Despite these challenges, face recognition tech nology continues to improve and expand its applic ations. It is now being used in airports, hotels, and even some retail stores. As the technology becom es more advanced, it is likely to play an even grea ter role in our lives.问题与答案解析:1. What is face recognition technology?Answer: Face recognition technology is a biom etric method that analyzes and compares facial fea tures to identify individuals.2. How is face recognition technology used in law enforcement?Answer: Police departments use face recognitio n technology to identify suspects from surveillance footage and to solve crimes.3. What are some everyday applications of face recognition technology?Answer: Everyday applications of face recogniti on technology include using it to unlock smartpho nes and improve security.4. What are some concerns about face recogni tion technology?Answer: Privacy concerns and accuracy issues a re two main concerns about face recognition techn ology.5. Despite the challenges, what is the future of face recognition technology likely to be?Answer: The future of face recognition technol ogy is expected to see continued improvement an d expansion of its applications.通过阅读这篇文章,读者可以了解到人脸识别技术的定义、应用领域、面临的挑战以及未来的发展趋势。
外文文献翻译成品:基于人脸识别的移动自动课堂考勤管理系统(中英文双语对照)

外文标题:Face Recognition-Based Mobile Automatic Classroom Attendance Management System外文作者:Refik Samet,Muhammed Tanriverdi文献出处: 2018 International Conference on Cyberworlds (如觉得年份太老,可改为近2年,毕竟很多毕业生都这样做)英文2937单词,20013字符(字符就是印刷符),中文4819汉字。
Face Recognition-Based Mobile Automatic ClassroomAttendance Management System Abstract—Classroom attendance check is a contributing factor to student participation and the final success in the courses. Taking attendance by calling out names or passing around an attendance sheet are both time-consuming, and especially the latter is open to easy fraud. As an alternative, RFID, wireless, fingerprint, and iris and face recognition-based methods have been tested and developed for this purpose. Although these methods have some pros, high system installation costs are the main disadvantage. The present paper aims to propose a face recognition-based mobile automatic classroom attendance management system needing no extra equipment. To this end, a filtering system based on Euclidean distances calculated by three face recognition techniques, namely Eigenfaces, Fisherfaces and Local Binary Pattern, has been developed for face recognition. The proposed system includes three different mobile applications for teachers, students, and parents to be installed on their smart phones to manage and perform the real-time attendance-taking process. The proposed system was tested among students at Ankara University, and the results obtained were very satisfactory.Keywords—face detection, face recognition, eigenfaces, fisherfaces, local binary pattern, attendance management system, mobile application, accuracyI.INTRODUCTIONMost educational institutions are concerned with st udents’ participation in courses since student participation in the classroom leads to effective learning and increases success rates [1]. Also, a high participation rate in the classroom is a motivating factor for teachers and contributes to a suitable environment for more willing and informative teaching [2]. The most common practice known to increase attendance in a course is taking attendance regularly. There are two common ways to create attendance data. Some teachers prefer to call names and put marks for absence or presence. Other teachers prefer to pass around a paper signing sheet. After gathering the attendance data via either of these two methods, teachers manually enter the data into the existing system. However, those non-technological methods are not efficient ways since they are time- consuming and prone to mistakes/fraud. The present paper aims to propose an attendance-taking process via the existing technological infrastructure with some improvements. A face recognition-based mobile automatic classroom attendance management system has been proposed with a face recognition infrastructure allowing the use of smart mobile devices. In this scope, a filtering system based on Euclidean distances calculated by three face recognition techniques, namely Eigenfaces, Fisherfaces, and Local Binary Pattern (LBP), has been developedfor face recognition. The proposed system includes three different applications for teachers, students, and parents to be installed on their smart phones to manage and perform a real-time polling process, data tracking, and reporting. The data is stored in a cloud server and accessible from everywhere at any time. Web services are a popular way of communication for online systems, and RESTful is an optimal example of web services for mobile online systems [3]. In the proposed system, RESTful web services were used for communication among teacher, student, and parent applications and the cloud server. Attendance results are stored in a database and accessible by the teacher, student and parent mobile applications.The paper is organised as follows. Section II provides a brief literature survey. SectionIII introduces the proposed system, and section IV follows by implementation and results. The last section gives the main conclusions.II.LITERATURE SURVEYFingerprint reading systems have high installation costs. Furthermore, only one student at a time can use a portable finger recognition device, which makes it atime-consuming process [4]. In the case of a fixed finger recognition device at the entrance of the classroom, attendance-taking should be done under the teacher's supervision so that students do not leave after the finger recognition, which makes the process time-consuming for both the teacher and the students. In case of RFID card reading systems, attendance-taking is available via the cards distributed to students [5]. In such systems, students may resort to fraudulent methods by reading their friends' cards. Also, if a student forgets his/her card, a non- true absence may be saved in the system. The disadvantage of the classroom scanning systems with Bluetooth or beacon methods is that each student must carry a device. Because the field limit of the Bluetooth Low Energy (BLE) system cannot be determined, students who are not inthe classroom at the moment but are within the Bluetooth area limits may appear to be present in the attendance system [6]. There are different methods of classroom attendance monitoring using face recognition technology. One of these is a camera placed at the classroom entrance and the students entering the classroom are registered into the system by face recognition [7]. However, in this system students’faces could be recognised, although students can leave the classroom afterwards, and errors can occur in the polling information. Another method is the observation carried out with a camera placed in the classroom and the classroom image taken during the course. In this case, the cameras used in the system need to be changed frequently to keep producing better quality images. Therefore, this system is not very useful andcan become costly. In addition to all the aforementioned disadvantages, the most common disadvantage is that all these methods need extra equipment. The proposed system has been developed to address these disadvantages. The main advantages of the proposed system are flexible usage, no equipment costs, no wasted time, and easy accessibility.III.PROPOSED SYSTEMA.Architecture of the Proposed SystemThe proposed system's architecture based on mobility and flexibility is shown inFig.1.Figure 1. System ArchitectureThe system consists of three layers: Application Layer, Communication Layer, and Server Layer.Application Layer: In the application layer, there are three mobile applications connected to the cloud server by web services. a) Teacher Application: The teacher is the head of the system, so he/she has the privilege to access all the data. By his/her smart mobile device, he/she can take a photo of students in a classroom at any time. After the taking the photograph, the teacher can use this photo to register attendance. For this aim, the photo is sent to the cloud server for face detection and recognition processing. The results are saved into a database together with all the reachable data. The teacher gets a response by the mobile application and can immediately see the results. The teacher can also create a student profile, add a photo of each student, and add or remove a student to/from their class rosters. He/she can as well create and delete courses. Each course has a unique six- character code. The teacher can share this code with his/her students so they can access their attendance results via the student application. The teacher can access to all data and results based on each student's recognized photo stamped with a date. Additionally, an email message with attendance data of a class in Excel format can be requested, while the analytics of the attendance results is provided in the application. b) Student Application: Students can sign in courses with the teacher's email address and the six-character course code. They can add their photos by taking a photo or a 3-second long video. In case of errors, their uploaded photos can be deleted. Students can only see limited results of the attendance-taking process related to their attendance. To protect personal privacy, the class photos and detected portrait photos of each student can be accessed only by the teacher. If students are not in the classroom when an attendance-check is performed, they are notified of the attendance-check. In case of errors (if a student is present, but not detected by the system), he/she can notify the teacher so he/she can fix the problem. c) Family Application: Parents can see their children's attendanceresults for each class. Additional children profiles can be added into the system. Each parent is added to the student's application with name, surname, and email address. When a student adds his/her parents, they are automatically able to see the attendance results. They are also notified when their child is not in the classroom.2) Communication Layer: RESTful web services are used to communicate betweenthe applications and server layers. Requests are sent by the POST method. Each request is sent with a unique ID of the authorised user of the session. Only the authorised users can access and respond the the data to which they have right to access. Due to its flexibility and fast performance, JSON is used as the data format for web services response [8]. With this abstract web service layer, the system can easily be used for a new item in the application layer, such as web pages or a new mobile operating system.3)Server Layer: The server layer is responsible for handling the requests and sending the results to the client. Face detection and recognition algorithms are performed in this layer and more than 30 different web services are created for handling different requests from mobile applications.B.Face DetectionAccurate and efficient face detection algorithms improve the accuracy level of theface recognition systems. If a face is not detected correctly, the system will fail its operation, stop processing, and restart. Knowledge-based, feature-based,template-based, and statistics-based methods are used for face detection [9]. Since the classroom photo is taken under the teacher's control, pose variations could be limited to a small range. Viola-Jones face detection method with Ada- boost training is shown as the best choice for real-time class attendance systems [9, 10]. In the most basic sense, the desired objects are firstly found and introduced according to a certain algorithm. Afterwards, they are scanned to find matches with similar shapes [11].C.Face RecognitionThere are two basic classifications of face recognition based on image intensity: feature-based and appearance-based [12]. Feature-based approaches try to represent (approximate) the object as compilations of different features, for example, eyes, nose, chin, etc. In contrast, the appearance-based models only use the appearance captured by different two-dimensional views of the object-of-interest. Feature-based techniques are more time-consuming than appearance-based techniques. The real-time attendance management system requires low computational process time. Therefore, three appearance-based face recognition techniques such as Eigenfaces, Fisherfaces and LBP are used in the tested system. Fisherfaces and eigenfaces techniques have a varying success rate, depending on different challenges, like pose variation, illumination, or facial expression [13]. According to several previous studies, face recognition using LBP method gives very good results regarding speed and discrimination performance as well as in different lighting conditions [14, 15]. Euclidean distance is calculated by finding similarities between images for face recognition. A filtering system based on Euclidean distances calculated by Eigenfaces, Fisherfaces and LBP has been developed for face recognition. According to the developed system, firstly, minimum Euclidean distances of LBP, Fisherfaces andEigenfaces algorithms are evaluated in defined order. If the Euclidean distance of LBP algorithm is less than 40; else if Euclidean distance of Fisherfaces algorithm is less than 250; else if Euclidean distance of Eigenfaces algorithm is less than 1500, recognized face is recorded as the right match. Secondly, if the calculated Euclidean distances by the three methods are greater than the minimum Euclidean distances, the second level Euclidean distances (40-50 (for LBP), 250-400 (for Fisherfaces), 1500- 1800 (for Eigenfaces)) are evaluated in the same way. If the second level conditions are also not met, the filter returns the wrong match. Thirdly, if any two algorithms give the same match result, the match is recorded correctly. Finally, if no conditions are met, the priority is given to the LBP algorithm and the match is recorded correctly. The system’s specific architecture aimed for flexibility, mobility, and low-cost by requiring no extra equipment. At the same time, its objective was to provide access to all users at any time. The system thus offers a real-time attendance management system to all its users.IV.IMPLEMENTATION AND RESULTSThe following platform was used. The cloud server has a 2.5 GHz with 4-core CPU,8GB RAM, and 64-bit operating system capacity. Viola-Jones face detection algorithm and Eigenfaces, Fisherfaces and LBP face recognition algorithms were implemented based on OpenCV. Tests were done with both iOS and ANDROID.Forty different attendance monitoring tests were performed in a real classroom, including 11 students, and 264 students’ faces were detected. Tables I, II, and III show detection and recognition accuracy of all three different types of tested algorithms related to the Euclidean distance.Priority ordering for 3 algorithms was arranged according to accuracy rate for each interval. In test results, 123, 89, and 85 false recognitions were detected for Eigenfaces, Fisherfaces and LBP, respectively. By the help of the developed filtering system, the number of false recognitions decreased to 65. Out of 40 implemented attendance monitoring tests, 10 were conducted with 1 face photo of each student in database in Step-I, 20 were conducted when the number of face photos increased up to 3 in Step-II, and 10 recognition processes were conducted with more than 3 face photos in database in Step-III. Table IV shows the obtained results.The most important limitation of tested attendance monitoring process is decreased success with increasing distance between the camera and students. The results regarding students sitting in front seats are more accurate in comparison to results regarding students sitting in the back. Secondly, the accuracy rates may have decreased due to the blurring caused by vibration while the photo was taken. Thirdly, in some cases one part of the student's face may be covered by another student sitting in front of him/her, which may hamper a successful face recognition process. Since the classroom photos are taken in uncontrolled environments, the illumination and pose could, to a large extent, affect the accuracy rate. The developed filtering system minimizes these effects. To increase accuracy, pose tolerant face recognition approach may also be used [16, 17].V.CONCLUSIONSThe present paper proposes a flexible and real-time face recognition-based mobile attendance management system. A filtering system based on Euclidean distances calculated by Eigenfaces, Fisherfaces, and LBP has been developed. The proposed system eliminates the cost for extra equipment, minimizes attendance-taking time, and allows users to access the data anytime and anywhere. Smart devices are very user- friendly to perform classroom attendance monitoring. Teachers, students, and parents can use the application without any restrictions and in real-time. Since the internet connection speed has been steadily increasing, high quality, larger images can be sent to the server. In addition, processor capacity of the servers is also increasing on daily basis. With these technological developments, the accuracy rate of the proposed system will also be increased. Face recognition could be further tested by other face recognition techniques, such as Support Vector Machine, Hidden Markov Model, Neural Networks, etc. Additionally, detection and recognition processes could be performed on smart devices once their processor capacity is sufficiently increased. REFERENCES[1]L. Stanca, "The Effects of Attendance on Academic Performance:Panel Data Evidence for Introductory Microeconomics," J. Econ. Educ., vol. 37, no. 3, pp. 251–266, 2006.[2]P.K. Pani and P. Kishore, "Absenteeism and performance in a quantitative moduleA quantile regression analysis," Journal of Applied Research in Higher Education, vol.8 no. 3, pp. 376-389, 2016.[3]U. Thakar, A. Tiwari, and S. Varma, "On Composition of SOAP Based and RESTful Services," IEEE 6th Int. Conference on Advanced Computing (IACC), 2016. [4]K.P.M. Basheer and C.V. Raghu, "Fingerprint attendance system for classroom needs," Annual IEEE India Conference (INDICON), pp. 433-438, 2012.[5]S. Konatham, B.S. Chalasani, N. Kulkarni, and T.E. Taeib, ―Attendance generating system using RFID and GSM,‖IEEE Long Island Systems, Applications and Technology Conference (LISAT), 2016.[6]S. Noguchi, M. Niibori, E. Zhou, and M. Kamada, "Student Attendance Management System with Bluetooth Low Energy Beacon and Android Devices," 18th International Conference on Network- Based Information Systems, pp. 710-713, 2015.[7]S. Chintalapati and M.V. Raghunadh, ―Automated attendance management system based on face recognition algorithms,‖IEEE Int. Conference on Computational Intelligence and Computing Research, 2013.[8]G. Wang, "Improving Data Transmission in Web Applications via the Translation between XML and JSON," Third Int. Conference on Communications and Mobile Computing (CMC), pp. 182-185, 2011.[9]X. Zhu, D. Ren, Z. Jing, L. Yan, and S. Lei, "Comparative Research of theCommon Face Detection Methods," 2nd International Conference on Computer Science and Network Technology, pp. 1528-1533, 2012.[10]V. Gupta and D. Sharma, ―A Study of Various Face Detection Methods,‖International Journal of Advanced Research in Computer and Communication Engineering vol. 3, no. 5, pp.6694-6697, 2014.[11]P. Viaola and M.J. Jones, ―Robust Real-Time Face Detection,‖International Journal of Computer Vision, vol. 57, no. 2, pp. 137-154, 2004.[12]L. Masupha, T. Zuva, S. Ngwira, and O. Esan, ―Face recognition techniques, their advantages, disadvantages and performance evaluation,‖Int. Conference on Computing, Communication and Security (ICCCS), 2015.[13]J. Li, S. Zhou, and C. Shekhar, "A comparison of subspace analysis for face recognition," International Conference on Multimedia and Expo, ICME '03, Proceedings, vol. 3, pp. 121-124, 2003.[14]T. Ahonen, A. Hadid, and M. Pietikainen, ―Face description with Local Binary Patterns,‖IEEE Transactions on Pattern Analysis and Machine Intelligence, vol. 28, no. 12, pp. 2037-2041, 2006.[15]T. Ahonen, A. Hadid, M. Pietikainen, and T . Maenpaa, ―Face recognition based on the appearance of local regions,‖Proceedings of the 17th Int. Conference on Pattern Recognition, vol. 3, pp. 153-156, 2004.[16]R. Samet, S. Sakhi, and K. B. Baskurt, ―An Efficient Pose Tolerant Face Recognition Approach‖, Transactions on Comput. Science XXVI, LNCS 9550, pp.161-172, 2016.[17]R. Samet, G. S. Shokouh, J. Li, ―A Novel Pose Tolerant Face Recognition Approach‖, 2014 International Conference on Cyberworlds, pp. 308-312, 2014.基于人脸识别的移动自动课堂考勤管理系统摘要- 课堂出勤检查是学生参与和课程最终成功的一个因素。
人脸识别文献

人脸识别文献人脸识别技术在当今社会中得到了广泛的应用,其应用领域涵盖了安全监控、人脸支付、人脸解锁等多个领域。
为了了解人脸识别技术的发展,下面就展示一些相关的参考文献。
1. 《Face Recognition: A Literature Survey》- 作者: Rabia Jafri, Shehzad Tanveer, and Mubashir Ahmad这篇综述性文献回顾了人脸识别领域的相关研究,包括了人脸检测、特征提取、特征匹配以及人脸识别系统的性能评估等。
该文中给出了对不同方法的综合评估,如传统的基于统计、线性判别分析以及近年来基于深度学习的方法。
2. 《Deep Face Recognition: A Survey》- 作者: Mei Wang, Weihong Deng该综述性文献聚焦于深度学习在人脸识别中的应用。
文中详细介绍了深度学习中的卷积神经网络(Convolutional Neural Networks, CNN)以及其在人脸特征学习和人脸识别中的应用。
同时,文中还回顾了一些具有代表性的深度学习人脸识别方法,如DeepFace、VGG-Face以及FaceNet。
3. 《A Survey on Face Recognition: Advances and Challenges》-作者: Anil K. Jain, Arun Ross, and Prabhakar这篇综述性文献回顾了人脸识别技术中的进展和挑战。
文中首先介绍了人脸识别技术的基本概念和流程,然后综述了传统的人脸识别方法和基于机器学习的方法。
此外,该文还介绍了一些面部表情识别、年龄识别和性别识别等相关技术。
4. 《Face Recognition Across Age Progression: A Comprehensive Survey》- 作者: Weihong Deng, Jiani Hu, Jun Guo该综述性文献主要关注跨年龄变化的人脸识别问题。
关于人脸识别的英语短文----人脸识别是一把双刃剑

Face recognition is a double-edged swordFace recognition technology has become increasingly popular in recent years. It is a method of identifying individuals based on their facial features. With advancements in artificial intelligence, face recognition has become a powerful tool in various industries such as security, marketing, and law enforcement. One of the most common applications of face recognition technology is in security systems. Security cameras equipped with face recognition technology can identify individuals as they enter a building or access a restricted area. This technology can help prevent unauthorized access and reduce the risk of theft and other criminal activities.In marketing, face recognition technology is used to analyze consumer behavior. By analyzing the facial expressions and emotions of customers, businesses can gain valuable insights into their preferences and buying habits. This information can then be used to create targeted marketing campaigns that are more likely to resonate with the target audience.In law enforcement, face recognition technology is used to identify suspects and missing persons. Police departments use facial recognition technology to match photos of suspects to databases of known criminals or missing persons. This technology can help solve crimes and reunite missing persons with their families.Despite the many benefits of face recognition technology, there are also concerns about privacy and potential misuse of the technology. Critics arguethat face recognition technology could be used to monitor individuals without their knowledge or consent. There is also the potential for the technology to be used to discriminate against certain groups of people.In conclusion, face recognition technology has the potential to revolutionize various industries and improve security measures. However, it is important to consider the potential risks and ethical implications of the technology. As we continue to develop and implement this technology, it is crucial to ensure that it is used in a responsible and ethical manner.译文:人脸识别是一把双刃剑近年来,人脸识别技术越来越流行。
支持人脸识别的英语作文
支持人脸识别的英语作文英文:Facial recognition technology has become increasingly popular in recent years, with many companies and governments implementing it for a variety of purposes. Personally, I am in favor of the use of facial recognition technology for several reasons.Firstly, facial recognition technology can greatly improve security measures. For example, airports and other public places can use facial recognition technology to quickly identify potential threats and prevent them from entering. This can greatly enhance the safety of individuals and society as a whole.Secondly, facial recognition technology can also be used to improve customer experiences. For instance, some hotels and amusement parks have implemented facial recognition technology to help guests check in and enterthe park more quickly and efficiently. This can save time and reduce frustration for customers, leading to a more positive experience.However, there are also concerns about the use offacial recognition technology. One major concern is privacy. Some people worry that their personal information could be compromised if facial recognition technology is usedwithout proper safeguards in place. Another concern is the potential for discrimination. If facial recognition technology is not properly calibrated, it could lead tofalse identifications and discrimination against certain groups of people.Despite these concerns, I believe that the benefits of facial recognition technology outweigh the risks. As longas proper safeguards are in place to protect privacy and prevent discrimination, facial recognition technology can greatly improve security and enhance customer experiences.中文:近年来,人脸识别技术越来越受欢迎,许多公司和政府都在实施它以实现各种目的。
- 1、下载文档前请自行甄别文档内容的完整性,平台不提供额外的编辑、内容补充、找答案等附加服务。
- 2、"仅部分预览"的文档,不可在线预览部分如存在完整性等问题,可反馈申请退款(可完整预览的文档不适用该条件!)。
- 3、如文档侵犯您的权益,请联系客服反馈,我们会尽快为您处理(人工客服工作时间:9:00-18:30)。
文献信息文献标题:Face Recognition Techniques: A Survey(人脸识别技术综述)文献作者:V.Vijayakumari文献出处:《World Journal of Computer Application and Technology》, 2013,1(2):41-50字数统计:英文3186单词,17705字符;中文5317汉字外文文献Face Recognition Techniques: A Survey Abstract Face is the index of mind. It is a complex multidimensional structure and needs a good computing technique for recognition. While using automatic system for face recognition, computers are easily confused by changes in illumination, variation in poses and change in angles of faces. A numerous techniques are being used for security and authentication purposes which includes areas in detective agencies and military purpose. These surveys give the existing methods in automatic face recognition and formulate the way to still increase the performance.Keywords: Face Recognition, Illumination, Authentication, Security1.IntroductionDeveloped in the 1960s, the first semi-automated system for face recognition required the administrator to locate features ( such as eyes, ears, nose, and mouth) on the photographs before it calculated distances and ratios to a common reference point, which were then compared to reference data. In the 1970s, Goldstein, Armon, and Lesk used 21 specific subjective markers such as hair color and lip thickness to automate the recognition. The problem with both of these early solutions was that the measurements and locations were manually computed. The face recognition problem can be divided into two main stages: face verification (or authentication), and face identification (or recognition).The detection stage is the first stage; it includesidentifying and locating a face in an image. The recognition stage is the second stage; it includes feature extraction, where important information for the discrimination is saved and the matching where the recognition result is given aid of a face database.2.Methods2.1.Geometric Feature Based MethodsThe geometric feature based approaches are the earliest approaches to face recognition and detection. In these systems, the significant facial features are detected and the distances among them as well as other geometric characteristic are combined in a feature vector that is used to represent the face. To recognize a face, first the feature vector of the test image and of the image in the database is obtained. Second, a similarity measure between these vectors, most often a minimum distance criterion, is used to determine the identity of the face. As pointed out by Brunelli and Poggio, the template based approaches will outperform the early geometric feature based approaches.2.2.Template Based MethodsThe template based approaches represent the most popular technique used to recognize and detect faces. Unlike the geometric feature based approaches, the template based approaches use a feature vector that represent the entire face template rather than the most significant facial features.2.3.Correlation Based MethodsCorrelation based methods for face detection are based on the computation of the normalized cross correlation coefficient Cn. The first step in these methods is to determine the location of the significant facial features such as eyes, nose or mouth. The importance of robust facial feature detection for both detection and recognition has resulted in the development of a variety of different facial feature detection algorithms. The facial feature detection method proposed by Brunelli and Poggio uses a set of templates to detect the position of the eyes in an image, by looking for the maximum absolute values of the normalized correlation coefficient of these templates at each point in test image. To cope with scale variations, a set of templates atdifferent scales was used.The problems associated with the scale variations can be significantly reduced by using hierarchical correlation. For face recognition, the templates corresponding to the significant facial feature of the test images are compared in turn with the corresponding templates of all of the images in the database, returning a vector of matching scores computed through normalized cross correlation. The similarity scores of different features are integrated to obtain a global score that is used for recognition. Other similar method that use correlation or higher order statistics revealed the accuracy of these methods but also their complexity.Beymer extended the correlation based on the approach to a view based approach for recognizing faces under varying orientation, including rotations with respect to the axis perpendicular to the image plane(rotations in image depth). To handle rotations out of the image plane, templates from different views were used. After the pose is determined ,the task of recognition is reduced to the classical correlation method in which the facial feature templates are matched to the corresponding templates of the appropriate view based models using the cross correlation coefficient. However this approach is highly computational expensive, and it is sensitive to lighting conditions.2.4.Matching Pursuit Based MethodsPhilips introduced a template based face detection and recognition system that uses a matching pursuit filter to obtain the face vector. The matching pursuit algorithm applied to an image iteratively selects from a dictionary of basis functions the best decomposition of the image by minimizing the residue of the image in all iterations. The algorithm describes by Philips constructs the best decomposition of a set of images by iteratively optimizing a cost function, which is determined from the residues of the individual images. The dictionary of basis functions used by the author consists of two dimensional wavelets, which gives a better image representation than the PCA (Principal Component Analysis) and LDA(Linear Discriminant Analysis) based techniques where the images were stored as vectors. For recognition the cost function is a measure of distances between faces and is maximized at each iteration. For detection the goal is to find a filter that clusters together in similar templates (themean for example), and minimized in each iteration. The feature represents the average value of the projection of the templates on the selected basis.2.5.Singular Value Decomposition Based MethodsThe face recognition method in this section use the general result stated by the singular value decomposition theorem. Z.Hong revealed the importance of using Singular Value Decomposition Method (SVD) for human face recognition by providing several important properties of the singular values (SV) vector which include: the stability of the SV vector to small perturbations caused by stochastic variation in the intensity image, the proportional variation of the SV vector with the pixel intensities, the variances of the SV feature vector to rotation, translation and mirror transformation. The above properties of the SV vector provide the theoretical basis for using singular values as image features. In addition, it has been shown that compressing the original SV vector into the low dimensional space by means of various mathematical transforms leads to the higher recognition performance. Among the various dimensionality reducing transformations, the Linear Discriminant Transform is the most popular one.2.6.The Dynamic Link Matching MethodsThe above template based matching methods use an Euclidean distance to identify a face in a gallery or to detect a face from a background. A more flexible distance measure that accounts for common facial transformations is the dynamic link introduced by Lades et al. In this approach , a rectangular grid is centered all faces in the gallery. The feature vector is calculated based on Gabor type wavelets, computed at all points of the grid. A new face is identified if the cost function, which is a weighted sum of two terms, is minimized. The first term in the cost function is small when the distance between feature vectors is small and the second term is small when the relative distance between the grid points in the test and the gallery image is preserved. It is the second term of this cost function that gives the “elasticity” of this matching measure. While the grid of the image remains rectangular, the grid that is “best fit” over the test image is stretched. Under certain constraints, until the minimum of the cost function is achieved. The minimum value of the cost function isused further to identify the unknown face.2.7.Illumination Invariant Processing MethodsThe problem of determining functions of an image of an object that are insensitive to illumination changes are considered. An object with Lambertian reflection has no discriminative functions that are invariant to illumination. This result leads the author to adopt a probabilistic approach in which they analytically determine a probability distribution for the image gradient as a function of the surfaces geometry and reflectance. Their distribution reveals that the direction of the image gradient is insensitive to changes in illumination direction. Verify this empirically by constructing a distribution for the image gradient from more than twenty million samples of gradients in a database of thousand two hundred and eighty images of twenty inanimate objects taken under varying lighting conditions. Using this distribution, they develop an illumination insensitive measure of image comparison and test it on the problem of face recognition. In another method, they consider only the set of images of an object under variable illumination, including multiple, extended light sources, shadows, and color. They prove that the set of n-pixel monochrome images of a convex object with a Lambertian reflectance function, illuminated by an arbitrary number of point light sources at infinity, forms a convex polyhedral cone in IR and that the dimension of this illumination cone equals the number of distinct surface normal. Furthermore, the illumination cone can be constructed from as few as three images. In addition, the set of n-pixel images of an object of any shape and with a more general reflectance function, seen under all possible illumination conditions, still forms a convex cone in IRn. These results immediately suggest certain approaches to object recognition. Throughout, they present results demonstrating the illumination cone representation.2.8.Support Vector Machine ApproachFace recognition is a K class problem, where K is the number of known individuals; and support vector machines (SVMs) are a binary classification method. By reformulating the face recognition problem and reinterpreting the output of the SVM classifier, they developed a SVM-based face recognition algorithm. The facerecognition problem is formulated as a problem in difference space, which models dissimilarities between two facial images. In difference space we formulate face recognition as a two class problem. The classes are: dissimilarities between faces of the same person, and dissimilarities between faces of different people. By modifying the interpretation of the decision surface generated by SVM, we generated a similarity metric between faces that are learned from examples of differences between faces. The SVM-based algorithm is compared with a principal component analysis (PCA) based algorithm on a difficult set of images from the FERET database. Performance was measured for both verification and identification scenarios. The identification performance for SVM is 77-78% versus 54% for PCA. For verification, the equal error rate is 7% for SVM and 13% for PCA.2.9.Karhunen- Loeve Expansion Based Methods2.9.1.Eigen Face ApproachIn this approach, face recognition problem is treated as an intrinsically two dimensional recognition problem. The system works by projecting face images which represents the significant variations among known faces. This significant feature is characterized as the Eigen faces. They are actually the eigenvectors. Their goal is to develop a computational model of face recognition that is fact, reasonably simple and accurate in constrained environment. Eigen face approach is motivated by the information theory.2.9.2.Recognition Using Eigen FeaturesWhile the classical eigenface method uses the KLT (Karhunen- Loeve Transform) coefficients of the template corresponding to the whole face image, the author Pentland et.al. introduce a face detection and recognition system that uses the KLT coefficients of the templates corresponding to the significant facial features like eyes, nose and mouth. For each of the facial features, a feature space is built by selecting the most significant “eigenfeatures”, which are the eigenvectors corresponding to the largest eigen values of the features correlation matrix. The significant facial features were detected using the distance from the feature space and selecting the closest match. The scores of similarity between the templates of the test image and thetemplates of the images in the training set were integrated in a cumulative score that measures the distance between the test image and the training images. The method was extended to the detection of features under different viewing geometries by using either a view-based Eigen space or a parametric eigenspace.2.10.Feature Based Methods2.10.1.Kernel Direct Discriminant Analysis AlgorithmThe kernel machine-based Discriminant analysis method deals with the nonlinearity of the face patterns’ distribution. This method also effectively solves the so-called “small sample size” (SSS) problem, which exists in most Face Recognition tasks. The new algorithm has been tested, in terms of classification error rate performance, on the multiview UMIST face database. Results indicate that the proposed methodology is able to achieve excellent performance with only a very small set of features being used, and its error rate is approximately 34% and 48% of those of two other commonly used kernel FR approaches, the kernel-PCA (KPCA) and the Generalized Discriminant Analysis (GDA), respectively.2.10.2.Features Extracted from Walshlet PyramidA novel Walshlet Pyramid based face recognition technique used the image feature set extracted from Walshlets applied on the image at various levels of decomposition. Here the image features are extracted by applying Walshlet Pyramid on gray plane (average of red, green and blue. The proposed technique is tested on two image databases having 100 images each. The results show that Walshlet level-4 outperforms other Walshlets and Walsh Transform, because the higher level Walshlets are giving very coarse color-texture features while the lower level Walshlets are representing very fine color-texture features which are less useful to differentiate the images in face recognition.2.10.3.Hybrid Color and Frequency Features ApproachThis correspondence presents a novel hybrid Color and Frequency Features (CFF) method for face recognition. The CFF method, which applies an Enhanced Fisher Model(EFM), extracts the complementary frequency features in a new hybrid color space for improving face recognition performance. The new color space, the RIQcolor space, which combines the component image R of the RGB color space and the chromatic components I and Q of the YIQ color space, displays prominent capability for improving face recognition performance due to the complementary characteristics of its component images. The EFM then extracts the complementary features from the real part, the imaginary part, and the magnitude of the R image in the frequency domain. The complementary features are then fused by means of concatenation at the feature level to derive similarity scores for classification. The complementary feature extraction and feature level fusion procedure applies to the I and Q component images as well. Experiments on the Face Recognition Grand Challenge (FRGC) show that i) the hybrid color space improves face recognition performance significantly, and ii) the complementary color and frequency features further improve face recognition performance.2.10.4.Multilevel Block Truncation Coding ApproachIn Multilevel Block Truncation coding for face recognition uses all four levels of Multilevel Block Truncation Coding for feature vector extraction resulting into four variations of proposed face recognition technique. The experimentation has been conducted on two different face databases. The first one is Face Database which has 1000 face images and the second one is “Our Own Database” which has 1600 face images. To measure the performance of the algorithm the False Acceptance Rate (FAR) and Genuine Acceptance Rate (GAR) parameters have been used. The experimental results have shown that the outcome of BTC (Block truncation Coding) Level 4 is better as compared to the other BTC levels in terms of accuracy, at the cost of increased feature vector size.2.11.Neural Network Based AlgorithmsTemplates have been also used as input to Neural Network (NN) based systems. Lawrence et.al proposed a hybrid neural network approach that combines local image sampling, A self organizing map (SOM) and a convolutional neural network. The SOP provides a set of features that represents a more compact and robust representation of the image samples. These features are then fed into the convolutional neural network. This architecture provides partial invariance to translation, rotation, scale and facedeformation. Along with this the author introduced an efficient probabilistic decision based neural network (PDBNN) for face detection and recognition. The feature vector used consists of intensity and edge values obtained from the facial region of the down sampled image in the training set. The facial region contains the eyes and nose, but excludes the hair and mouth. Two PDBNN were trained with these feature vectors and used one for the face detection and other for the face recognition.2.12.Model Based Methods2.12.1.Hidden Markov Model Based ApproachIn this approach, the author utilizes the face that the most significant facial features of a frontal face which includes hair, forehead, eyes, nose and mouth which occur in a natural order from top to bottom even if the image undergo small variation/rotation in the image plane perpendicular to the image plane. One dimensional HMM (Hidden Markov Model) is used for modeling the image, where the observation vectors are obtained from DCT or KLT coefficients. They given c face images for each subject of the training set, the goal of the training set is to optimize the parameters of the Hidden Markov Model to best describe the observations in the sense of maximizing the probability of the observations given in the model. Recognition is carried out by matching the best test image against each of the trained models. To do this, the image is converted to an observation sequence and then model likelihoods are computed for each face model. The model with the highest likelihood reveals the identity of the unknown face.2.12.2.The Volumetric Frequency Representation of Face ModelA face model that incorporates both the three dimensional (3D) face structure and its two-dimensional representation are explained (face images). This model which represents a volumetric (3D) frequency representation (VFR) of the face , is constructed using range image of a human head. Making use of an extension of the projection Slice Theorem, the Fourier transform of any face image corresponds to a slice in the face VFR. For both pose estimation and face recognition a face image is indexed in the 3D VFR based on the correlation matching in a four dimensional Fourier space, parameterized over the elevation, azimuth, rotation in the image planeand the scale of faces.3.ConclusionThis paper discusses the different approaches which have been employed in automatic face recognition. In the geometrical based methods, the geometrical features are selected and the significant facial features are detected. The correlation based approach needs face template rather than the significant facial features. Singular value vectors and the properties of the SV vector provide the theoretical basis for using singular values as image features. The Karhunen-Loeve expansion works by projecting the face images which represents the significant variations among the known faces. Eigen values and Eigen vectors are involved in extracting the features in KLT. Neural network based approaches are more efficient when it contains no more than a few hundred weights. The Hidden Markov model optimizes the parameters to best describe the observations in the sense of maximizing the probability of observations given in the model .Some methods use the features for classification and few methods uses the distance measure from the nodal points. The drawbacks of the methods are also discussed based on the performance of the algorithms used in the approaches. Hence this will give some idea about the existing methods for automatic face recognition.中文译文人脸识别技术综述摘要人脸是心灵的指标。