birt报表例子
birt_report基础

Birt基础(report报表简单设计)先下载eclipse的eclipse-reporting-galileo-SR1-win32.zip(制作报表eclipse插件)1、新建一个java project2、在这个project上新建一个report的文件如图:3、创建数据源:(在此用JDBC的数据源,并命名为student)4、创建数据连接,选择Driver Class用jdbc的Driver输入Driver URL、用户名和密码,如果在选择Driver Class时没有jdbc的Driver那点击Manager Drivers把Jdbc的jar包加载进来5、创建Data sets(可以看成是结果集)在JDBC Data Source处先可用的数据源,也就是刚创建的student数据源;选择Data Set Type 结果集的类型,这里就选择了SQL Select Query;输入Data Set Name(结果集的名称)这里输入为student写sql语句使这个结果集是可用的,下图左面显示的是可用的表,在右面输入框内输入相应的sql语句来对应这个结果集点击Finish完成结果集的创建6、现在就可以把这个结果集中的数据按照我们需要的方式显示出来了,点击eclipse窗口左面的Palette选项选择相应控件,有些控件是可以直接接收数据源的如table、Grid……,现在把一个table拖到右面的.rptdesign文件中,拖过来的时候会弹出来下图的对话框,输入columns(字段数)也就是要显示出来的字段,想显示出多少字段就输入几,选择Data Set (选择结果集)在这里就选择刚刚创建的student结果集7、选择左面的Data Explo选项,把要显示出来的选择拖到右面table中的相应位置,如图:点击下面的preview就可以看到相应的结果了:下面的结果显示出来本来是没有边框也不会居中对齐的,要设置相应的样式之后才会这样的,设置样式和css是一样的,选中这个table右击,选择style中的new style只要在里面设置border和text block就可以了;在本数据库设计中是把sex性别这个值放在数据字典里的,在这里只能显示出1或2,当然要想显示成男或女也是有办法解决的,那就要涉及到子报表功能。
BIRT工具报表生成
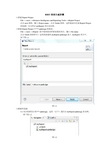
BIRT报表生成步骤1.新建Report ProjectFile---->new--->Business Intelligence and Reporting Tools--->Report Project点击next按钮,输入Project name,点击Finish按钮。
这样就成功完成Report Project 的创建!本文档以myReport项目为实例。
2.新建Report Project中***.rptdesign的报表。
File---->new--->Report 选中您的报表所要放置的项目,输入File name点击Finish按钮即可!这里把新建的myReport.rptdesign放入myReport项目中。
如下图1.1图1.13.数据库连接3.1双击你要设计的***.rptdesign,这里(以下)我们以myReport.rptdesign为实例,看下图1.2图1.23.2 选中工具左侧Data Expolr下的Data Sources 右击---.>New Data Source具体步骤如下图1.3(选中JDBC Data Source ,Data Source Name自己可以定义,这里我用默认的Data Source。
点击next)图1.3填入相应的数据配置信息如下图1.4图1.4值得注意的是若是第一次使用需要添加ojdbc14.jar包,点击如图1.4中的Manage Drivers 添加jar包。
如下图1.5图1.53.3 选中工具左侧Data Expolr下的Data Sets右击---.>New Data Set如下图1.6,选择您的Data Set需要绑定的Data Source(这里我选择上步创建的Data Source),选择Data Set Type(这里我选择的是:SQL Select Query),Data Set Name 可以自己定义,这里我用默认的Data Set。
birt实例ABC(5)

Tutorial 5: Creating a cross tabThis tutorial provides instructions for creating a cross tab that displays sales totals by state and product line. The cross tab uses data from the Customers, OrderDetails, and Products tables in the sample database, Classic Models.In this tutorial, you perform the following tasks:n Create a new reportn Build a data sourcen Build a data setn Set up data for the cross tabn Add a cross tab to the reportn Add grand totalsTask 1: Create a new report1 Choose File→New→Report.2 On New Report, select a project in which to save your report.3 Type the following text as the file name:SalesByStateAndProductLine.rptdesign4 Choose Finish. A blank report layout appears in the layout editor.Task 2: Build a data sourceBefore you begin designing your report in the layout editor, you create a data source to connect your report to the Classic Models database.1 Choose Data Explorer.2 Right-click Data Sources, and choose New Data Source from the context menu.3 Select Classic Models Inc. Sample Database from the list of data sources, use the default data source name, then choose Next. Connection information about the new data source appears.4 Choose Finish. BIRT Report Designer creates a new data source that connects to the sample database. It appears within Data Sources in Data Explorer.Task 3: Build a data setIn this procedure, you build a data set to indicate what data to extract from the Customers, OrderDetails, and Products tables.1 In Data Explorer, right-click Data Sets, and choose New Data Set.2 On New Data Set, type the following text for data set name:Sales3 Choose Next. Query displays the information to help you create a SQL query.4 Use the following SQL SELECT statement to indicate what data to retrieve. You can type the column and table names, or you can drag them from Available Items to the appropriate location in the SELECT statement.SELECT Customers.state,Orderdetails.quantityOrdered,Orderdetails.priceEach,Products.productlineFROM CustomersINNER JOINOrders ON Customers.customerNumber = Orders.customerNumberINNER JOIN OrderdetailsON Orders.orderNumber = Orderdetails.orderNumberINNER JOIN ProductsON Orderdetails.productCode = Products.productCodeWHERE Customers.country = 'USA'This SELECT statement joins four tables to get the required data.5 Choose Finish to save the data set. Edit Data Set displays the columns specified in the query, and provides options for editing the data set.6 Choose Computed Columns, then choose New to create a computed field that calculates extended prices by multiplying values from the QUANTITYORDERED and PRICEEACH fields.7 On New Computed Column, specify the following values, as shown in Figure 17‑2:1 In Column Name, typeEXTENDED_PRICE2 In Data Type, select Float.3 In Expression, typerow["QUANTITYORDERED"] * row["PRICEEACH"]Alternatively, you can open the expression builder to construct the expression by selecting the appropriate data set fields. Note that unlike the SELECT statement where you can type table field names in any case, data set field names are case-sensitive. If, in Expression, you typed row["quantityOrdered"], BIRT displays an error when you preview the results returned by the data set.Figure 17‑2 Computed field EXTENDED_PRICE4 Choose OK to save the computed field.8 Choose Preview Results to confirm that the query is valid and that it returns the correct data. If you created the SELECT statement and computed field correctly, you see the results that appear in Figure 17‑3. These are the data rows that the data set returns.Figure 17‑3 Preview of rows returned by the Sales data set9 Choose OK to save the data set.Task 4: Set up data for the cross tabIn this procedure, you set up the following items:n A data group, or dimension, containing values to use as the cross tab’s row headingsn A data group, or dime nsion, containing values to use as the cross tab’s column headingsn A summary field, or measure, containing aggregate values to use in the cells of the cross tabData that you set up for a cross tab is stored in an entity called a cube.1 In Data Explorer, right-click Data Cubes, and choose New Data Cube.2 On Cross Tab Cube Builder, specify the following information:n In Name, typeSales Cuben In Primary dataset, select Sales.3 Choose Groups and Summaries.4 In Available Fields, expand Sales. Drag STATE and drop it on (Drop a field here to create a group), as shown in Figure 17‑4.Figure 17‑4 Adding a state group to the cube5 On Add Group, use the default group name. Choose OK.6 Drag PRODUCTLINE from Available Fields and drop it on (Drop a field here to create a group). Use the default group name.Cross Tab Cube Builder shows the STA TE and PRODUCTLINE groups you created, as shown in Figure 17‑5.Figure 17‑5 Cross Tab Cube Builder displaying two groups7 Drag EXTENDED_PRICE from Available Fields and drop it on (Drop a field here to create a summary field). EXTENDED_PRICE(SUM) appears under Summary Field. SUM indicates that the SUM aggregate function is used to calculate the totals of the EXTENDED_PRICE values. The cube builder selects the SUM function by default. You can, however,select a different function to apply to a summary field by selecting the measure, then choosing Edit.Figure 17‑6 shows the dimensions and measure you defined.Figure 17‑6 Cross Tab Cube Builder displaying two groups and a summary field8 Choose OK to save the cube. The Sales cube appears under Data Cubes in Data Explorer.8 Expland the Sales Cube to view its contents, as shown in Figure 17‑7.Figure 17‑7 Data Explorer showing the Sales cubeTask 5: Add a cross tab to the reportYou add a cross tab to the report, then you insert data from the cube into the cross tab.1 Choose the palette, then drag a cross-tab element from the palette to the report. A cross tab appears in the report.2 Choose Data Explorer. Under the first group in the Sales cube, drag STA TE and drop it in the cross-tab area that displays Drop data field(s) to define rows here, as shown in Figure 17‑8.Figure 17‑8 Inserting STA TE data in the cross tab3 From the Sales cube, under Group1, drag PRODUCTLINE and drop it in the cross-tab area that displays Drop data field(s) to define columns here.4 From the Sales cube, under Summary Field, drag EXTENDED_PRICE and drop it in the cross-tab area that displays Drop data field(s) to be summarized here.The cross tab should look like the one shown in Figure 17‑9.Figure 17‑9 Cross tab design5 Choose Preview to preview the cross tab output. Figure 17‑10 shows a portion of the data that the cross tab displays.Figure 17‑10 Preview of the cross tab dataThe row headings display the states, the column headings display product lines, and the cells display the sales totals. The firstcell displays 458563.64, which is the sales total of classic cars sold in California.Task 6: Add grand totalsEach number that is displayed in the cross tab represents the sales total of a particular product for a particular state. In this procedure, you add grand totals to display the total sales of all products for each state, the total sales of each product, and the total of all sales across products and states.1 Choose Layout to resume editing the cross tab.2 Select the cross tab by clicking on the tab in the lower left corner of the cross tab. Make sure you select the entire cross tab, not just a part of it.3 In Property Editor, choose the Row Area tab.4 Choose Grand Totals, then choose Add.5 On Grand Total, shown in Figure 17 11, use the default values, then choose OK.Figure 17 11 Creating grand totals in the cross-tab row areaA new row is added to the bottom of the cross tab, as shown in Figure 17 12. In this row is a label that displays Grand Totaland a data element that displays [EXTENDED_PRICE].Figure 17 12 Cross tab including a new row to display grand totals6 In Property Editor, choose the Column Area tab.7 Choose Grand Totals, then choose Add.8 On Grand Total, use the default values, then choose OK.A new column is added to the cross tab, as shown in Figure 17 13.Figure 17 13 Cross tab with a new column to display grand totals9 Preview the report. Grand totals appear in the last row and last column of the cross tab.How to create data sets for a multi-dataset cubeIn this procedure, you create two data sets:n A fact data set, SalesTotal, to retrieve the data for calculating the sales totalsn A dimension data set, Productlines, to retrieve data about the product linesNote that we are not creating a separate data set for the year dimension, as is typical in a star schema. It is sometimes too complicated to create a pure star schema design when working with data stored in an OLTP system.1 Create a new data set named SalesTotal. Create the following query:select CLASSICMODELS.ORDERDETAILS.PRODUCTCODE,CLASSICMODELS.ORDERS.SHIPPEDDATE,CLASSICMODELS.ORDERDETAILS.QUANTITYORDERED * CLASSICMODELS.ORDERDETAILS.PRICEEACH as "EXTENDED_PRICE"from CLASSICMODELS.ORDERDETAILS, CLASSICMODELS.ORDERSwhere CLASSICMODELS.ORDERS.ORDERNUMBER = CLASSICMODELS.ORDERDETAILS.ORDERNUMBERand CLASSICMODELS.ORDERS.STATUS = 'Shipped'n The query retrieves PRODUCTCODE data because it is the key to later link to the PRODUCTLINE dimension.n The query retrieves SHIPPEDDATE data to use for the year dimension.n The query creates a calculated column, EXTENDED_PRICE, whose values will be aggregated to calculate the sales totals.n The query creates a join between the Orders and OrderDetails tables to get all the necessary data about the orders. Because the data set is retrieving data from an OLTP database, joins are unavoidable.n The query contains a filter condition to retrieve order data for orders that have been shipped, and therefore, that have been paid.2 Create a new data set named Productlines. Create the following query:select CLASSICMODELS.PRODUCTS.PRODUCTLINE,CLASSICMODELS.PRODUCTS.PRODUCTCODEfrom CLASSICMODELS.PRODUCTSn The query retrieves PRODUCTLINE data to use for the PRODUCTLINE dimension.n The query retrieves PRODUCTCODE data because it is the key that the SalesTotals data set will need to reference. How to create a multi-dataset cube1 In Data Explorer, right-click Data Cubes, then choose New Data Cube.2 On the Dataset page of Cross Tab Cube Builder, supply the following information, as shown in Figure 17 14:1 In Name, specify a descriptive name, such as Sales Cube, for the cube.2 In Primary dataset, select SalesTotal. In a multi-dataset cube, the fact data set that retrieves the data to calculate measures is the primary data set.Figure 17 14 Name and primary data set specified for a cube3 Choose Groups and Summaries to define the dimensions and measures for the cube. The Groups and Summaries page, shown in Figure 17 15, displays the available data sets and fields.Figure 17 15 Groups and Summaries page shows the available data sets and fields4 Define the year dimension of the cube.1 Under the Sales Totals (Primary) data set, drag SHIPPEDDATE and drop it under Groups (Dimensions) in the drop location that displays (Drop a field here to create a group).2 On Add Group, use the default group name.Group Level displays the different ways to group the dates. To display the dates as they appear in the data source, select Regular Group. To group the dates by any of the time periods, select Date Group.3 Select Date Group, then select year, as shown in Figure 17 16.Figure 17 16 Group Level showing the year group selected4 Choose OK to save the year dimension.5 Define the product line dimension.1 Under the Productlines data set, drag PRODUCTLINE and drop it under Groups (Dimensions) in the drop location that displays (Drop a field here to create a group). On Add Group, use the default group name.2 Under the Productlines data set, drag PRODUCTCODE and drop it on the PRODUCTLINE dimension. This action creates a hierarchical relationship between PRODUCTLINE and PRODUCTCODE.6 Define the cube’s measure. Under the Sales Totals (Primary) data set, drag EXTENDED_PRICE and drop it under Summary Fields (Measures) in the drop location that displays (Drop a field here to create a summary field).The Groups and Summaries page, shown in Figure 17 17, displays the dimensions and measure that you define.Figure 17 17 Groups and Summaries page shows the dimensions and measure7 Link the data in the dimensions with the fact data set.1 Choose Link Groups. The Link Groups page displays the Productline dimension you created and the primary (fact) data set.2 Link the PRODUCTCODE field in both items, as shown in Figure 17 18.Figure 17 18 Link Groups page shows how the dimension and fact data sets are linked8 Choose OK to save the cube. You can now build a cross tab that uses data from this cube.Figure 17 19 shows a cross tab that uses the year and PRODUCTLINE dimensions and the EXTENDED_PRICE measure from the cube.Figure 17 19 Cross tab designFigure 17 20 shows the generated cross tab.Figure 17 20 Cross tab outputHow to display or hide levels1 Click the down arrow button next to the data element, as shown in Figure 17‑21.Figure 17‑21 Displaying a menu for a selected element in the cross tab2 Choose Show or Hide Group Levels.3 On Show or Hide Group Levels, select the levels to display. Figure 17‑22 shows an example of selecting all levels.Figure 17‑22 Show or Hide Group LevelsIn the example, the time dimension has only three levels. If you want to display additional levels, such as week-of-month or day-of month, edit the definition of the time dimension in the cube builder.4 Choose OK. BIRT creates a data element for each selected level, as shown in Figure 17‑23.Figure 17‑23 Cross tab displays a data element each for the year, quarter, and month levelsHow to display subtotals and grand totalsThis procedure assumes that you have already inserted dimensions and measures in the cross tab.1 Select the cross tab.2 In Property Editor, choose the Row Area tab or the Column Area tab to add a subtotal or grand total in the row area and column area, respectively. Figure 17‑24 shows the Row Area tab selected.Figure 17‑24 Adding a subtotal to a cross tab’s row area3 To create a subtotal, select Sub Totals, then choose Add. To create a grand total, select Grand Totals, then choose Add. A cross tab can always include grand totals. If, however, a row or column area consists of only one dimension, there can be no subtotals. The Add button is disabled if you cannot create a subtotal.4 On Sub Total or Grand Total:1 In Aggregate On, select the dimension or dimension level whose total to display.2 In Data Field, select the field whose values to aggregate.3 In Function, select an aggregate function.Figure 17‑25 shows an example of displaying subtotals for the year dimension.Figure 17‑25 Specifying a subtotal in a cross tab4 Choose OK.A new row or column is added to the cross tab, and it contains a label and a data element. For the subtotal example shown in Figure 17‑25, a label in the new row displays [year]Total, and a data element displays [EXTENDED_PRICE], as shownin Figure 17‑26.Figure 17‑26 Elements that display year subtotals in a cross tabHow to sort cross tab data1 Select the cross tab, and on Property Editor, choose the Sorting tab.2 On the Sorting page, choose Add.By default, New Sort Key displays sort information for the first dimension in the column area, as shown in Figure 17‑27. The default Key value, PRODUCTLINE, indicates that the values in the PRODUCTLINE dimension are sorted by product line name in ascending order.Figure 17‑27 New Sort Key showing default sort values for the PRODUCTLINE dimension3 On New Sort Key, supply the necessary sort information, as follows:1 In Group Level, select the dimension on which to sort.2 In Key, select the data on which to sort. Although the typical choice is to sort on totals, you can also sort data by a specific dimension value. Depending on your choice, you may be required to provide additional information about the dimension level and value on which to sort.3 In Direction, select Ascending or Descending. Choose OK to save the sort definition.Figure 17‑28 shows an example of sorting on product line grand totals.Figure 17‑28 New Sort Key specifying sorting on product line grand totalsHow to filter data at the cross tab level1 Select the cross tab.2 In Property Editor, choose Filters and choose Add.3 On New Filter Condition, specify the following information:1 In Target, choose one of the following options:o Choose Group level to filter data in a specific group. For example, if the cross tab displays sales totals by product line and by year, you can create a filter to display data for certain product lines or for certain years.o Choose Measure to filter measure data. For example, you can create a filter to display sales totals greater than a specific number.2 In Group Level or Measure, select the group or measure on which to filter.3 In Filter Condition:1 In the first field, choose <Filter by...> to select a dimension or a measure, or a group total whose values to evaluate, as shown in Figure 17‑29. Alternatively, choose <Build expression...> to create an expression.Figure 17‑29 Filter By displaying the items that you can use in a filter condition2 In the second field, select the operator that specifies the type of filter test.3 In the third field, specify the value to search in the dimension or measure specified in the first field. You can type a value, or choose <Select value...> to display a list of values. You can also specify an expression that evaluates to a value. Choose <Build expression...> to open the expression builder.Figure 17‑30 shows an example of a complete filter condition. The filter limits the data to only the years where the annual sales exceed 2000000. The annual sales is calculated by the data field, EXTENDED_PRICE_Group2/year, under Grand Total in the Filter By dialog box shown in Figure 17‑29.Figure 17‑30 New Filter Condition showing an example of a complete filter condition.4 Choose OK to save the filter.。
01-Birt工具数据报表开发手册
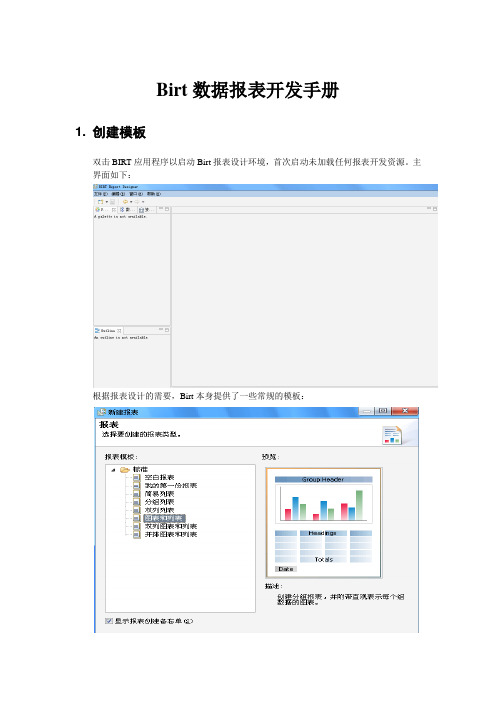
Birt数据报表开发手册1. 创建模板双击BIRT应用程序以启动Birt报表设计环境,首次启动未加载任何报表开发资源。
主界面如下:根据报表设计的需要,Birt本身提供了一些常规的模板:当然,也可以根据实际需要,添加一些使用频率比较高的模板。
下面将以两张图形,一张列表,且图形在上横向排列的模板为例,创建新模板。
点击文件菜单中的新建,选择新建模板,根据实际情况修改模板名称和存储路径:为此模板添加一些附加属性,如该模板的描述信息和模板布局的预览图像等。
点击完成,开始编辑此模板的布局。
在组件按钮区域依次选取:一个标签,用于放置报表的标题,双击输入标题文本。
也可根据需要动态的文本。
一个网格:用于放置水平的两张图形,因此网格设置为2列1行。
可根据实际情况调整。
一张表:用于放置数据报表,明细数据列设置为8列1行。
可根据实际情况调整。
关于组件的使用,将在后面的章节中具体说明。
用鼠标右击网格中的其中一个空白处,依次选择插入,图表。
在弹出的对话框中选取需要的图形。
同样的方法处理另外网格的另外一个。
有关图形的制作,将在图形报表开发手册中详细说明。
设置每种组件的属性,在OutLine窗口中选中已经拖放的组件,根据需要对其相应的属性进行调整。
如字体大小,颜色,对齐方式,样式等设置完成后,模板样式如下:保存模板的配置信息,以便在以后的报表开发中可以直接读取该模板。
2. 新建共享资源库在Birt的资源管理器中添加一些共享资源,如共享库:在弹出的对话框中输入Library库文件的保存路径和名称:确定后,Library库的创建完成。
如果操作无误,可以在对应的目录下浏览到新建的库。
3. 新建数据源在共享库中新建一个制作报表需要的数据库连接,以Oracle9i数据库连接为例,需要先配置数据驱动(数据库的驱动程序配置方法已经在报表设计器的配置手册文档中体现)。
然后在新建的库中,用鼠标右击数据源,选择新建数据源:在弹出的对话框中选择对应数据源类型,并为该数据源命名:选择正确的数据库驱动和URL后,就可以进行数据库的连接测试:可以根据报表需要,创建一个或者多个数据源的配置:数据源创建完成后,可以通过选择选择资源管理器中共享资源,Library库下新建的数据源,右击鼠标选择添加到报表,将新建数据源添加值报表中供使用。
百灵报表例子
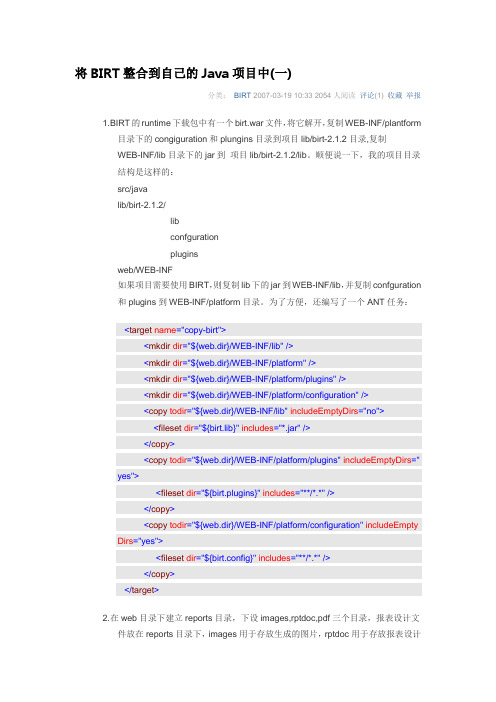
将BIRT整合到自己的Java项目中(一)分类:BIRT 2007-03-19 10:33 2054人阅读评论(1) 收藏举报1. B IRT的runtime下载包中有一个birt.war文件,将它解开,复制WEB-INF/plantform目录下的congiguration和plungins目录到项目lib/birt-2.1.2目录,复制WEB-INF/lib目录下的jar到项目lib/birt-2.1.2/lib。
顺便说一下,我的项目目录结构是这样的:src/javalib/birt-2.1.2/libconfgurationpluginsweb/WEB-INF如果项目需要使用BIRT,则复制lib下的jar到WEB-INF/lib,并复制confguration和plugins到WEB-INF/platform目录。
为了方便,还编写了一个ANT任务:<target name="copy-birt"><mkdir dir="${web.dir}/WEB-INF/lib"/><mkdir dir="${web.dir}/WEB-INF/platform"/><mkdir dir="${web.dir}/WEB-INF/platform/plugins"/><mkdir dir="${web.dir}/WEB-INF/platform/configuration"/><copy todir="${web.dir}/WEB-INF/lib" includeEmptyDirs="no"><fileset dir="${birt.lib}" includes="*.jar"/></copy><copy todir="${web.dir}/WEB-INF/platform/plugins" includeEmptyDirs="yes"><fileset dir="${birt.plugins}" includes="**/*.*"/></copy><copy todir="${web.dir}/WEB-INF/platform/configuration" includeEmpty Dirs="yes"><fileset dir="${birt.config}" includes="**/*.*"/></copy></target>2. 在web目录下建立reports目录,下设images,rptdoc,pdf三个目录,报表设计文件放在reports目录下,images用于存放生成的图片,rptdoc用于存放报表设计文件对应的document文件,pdf目录用于存放生成的pdf报表。
birt报表教程之网格报表

birt报表教程之网格报表网格报表网格报表是报表最通用的模式,在大多数报表中,都需要或部分需要将一组(多条)数据结构完全相同的数据以表格形式顺序展现出来。
如:通过此例我们先来看一看如何制作一张简单的报表。
我们需要建立一张显示所有银行客户及其相关信息的的报表。
创建数据源方法同上例3.2.创建数据集方法同上例3.3.数据集名称为:Customer。
客户的信息存在CUSTOMER表中,我们需要输入如下语句:select EBANK.CUSTOMERTYPE.TYPENAME,EBANK.CUSTOMER.*from EBANK.CUSTOMER,EBANK.CUSTOMERTYPEwhere EBANK.CUSTOMER.CUSTOMERTYPE=EBANK.CUSTOMERTYPE.TYPEID对报表进行布局1.在本过程中,您在报告页中插入元素以显示先前创建的数据集的数据。
先插入一个表元素,然后在该表中插入数据元素。
2.选择选用板“Palette”。
选用板显示所有可布置在报告中的元素。
3.为了以后的表布局美观,我们先从选用板中的“Gird”元素拖拽放入布局编辑器内(即文件的“Layout”视图)的报告中,插入时提示您要制定创建的行列数的详细信息:输入1列2行,4.然后,将选用板中的表元素“Table”拖放到布局编辑器内的报告中。
插入表提示您指定要对此表创建的列数和详细信息行数。
指定5列和1个详细信息行,然后选择“确定”。
具有5列和1个详细信息行的表将出现在布局编辑器中。
现在,您就可以在该表中插入数据了。
5.选择数据资源管理器Data Explorer视图。
在Data Explorer视图中,展开“Data Sets”,然后展开Customers,在查询中指定的列将出现在Customers 下面。
将CUSTOMER_NAME从Data Explorer中拖放到表的详细信息行“Detail Row”中的第一个单元格内(如下图)。
解决Birt等报表工具制作报表的几个难题
解决Birt等报表工具制作报表的几个难题在本文中我们再继续讨论几个类似的制作难题,并把说明集中在如何编写集算器 SPL 脚本上,不再赘述如何在 Birt 中引入 SPL 的步骤了。
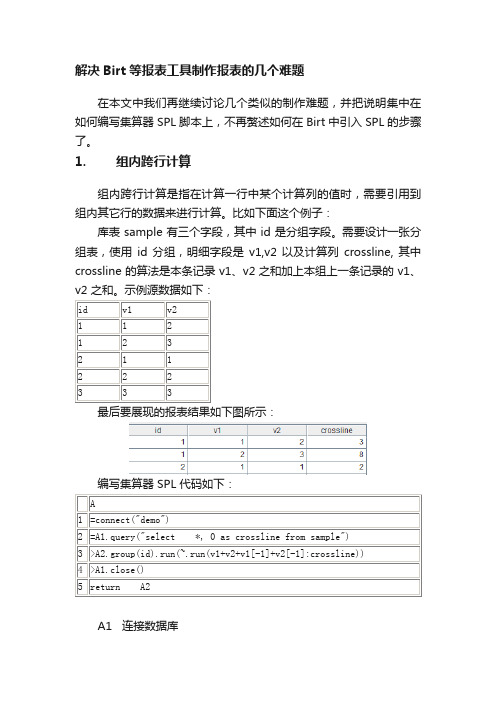
1. 组内跨行计算组内跨行计算是指在计算一行中某个计算列的值时,需要引用到组内其它行的数据来进行计算。
比如下面这个例子:库表 sample 有三个字段,其中 id 是分组字段。
需要设计一张分组表,使用id 分组,明细字段是v1,v2 以及计算列crossline, 其中crossline 的算法是本条记录 v1、v2 之和加上本组上一条记录的 v1、v2 之和。
示例源数据如下:最后要展现的报表结果如下图所示:编写集算器 SPL 代码如下:A1 连接数据库A2 查询数据库,同时多产生一列常数备用。
A3 按id 分组,并在每组数据中修改计算列crossline,最后合并,其中v1[-1]、v2[-1] 是集算器特有的定位上一行记录中字段的写法。
A4 关闭数据库A5 将 A2 中的计算结果数据集返回给报表工具2. 跨库数据源制作报表的数据往往来自于多种数据源,比如不同的物理数据库、文本文件、Excel 文件等,这些数据在报表中往往还需要相互关联进行运算。
报表工具本身能实现从多数据源取数,但进行关联运算会有一定的困难,或者运算性能非常差。
而由开发者自己编程去做关联运算,工作量一般又会非常大。
而集算器 SPL 恰恰能在这一点帮上大忙。
下面这个例子中,订单表 orders 和订单明细表 orderDetail 数据分别来自两个不同的数据库,二者之间要做join 运算。
两表数据如下:最后想要展现的报表结果如下:编写集算器 SPL 代码如下:A1 连接数据库 1A2 连接数据库 2A3 查询订单表数据A4 查询订单明细表数据A5A6 关闭数据库连接A7 以 A3 的 orderID 和 A4 的 orderID 为主键进行 left join,连接后的结果集有两个字段,第一个字段是 A3 的记录,第二个字段是A4 的记录。
基于BIRT的报表搜索

收稿日期:2006203222 基金项目:国家自然科学基金项目(60473078)资助. 作者简介:张小虎,男,1983年生,硕士研究生,研究方向为商务智能、数据挖掘;邢春晓,男,1967年生,教授,研究方向为数字图书馆、个性化服务;贺 炜,男,1977年生,博士,博士后,研究方向为数据挖掘、数据集成、电子政务.基于B IRT 的报表搜索张小虎1,邢春晓2,贺 炜21(清华大学计算机科学与技术系,北京100084)2(清华大学信息技术研究院,北京100084)E 2m ail:zhangxiaohu00@m ails .tsinghua .edu .cn摘 要:B I R T (Business Intelligence and R epo rting Too ls )是一款具有代表性的开源报表设计软件,根据基于X M L 的报表模版文件,B I R T 能够从关系数据表中提取数据,动态生成报表.报表对象模型(R epo rt O bject M odel ,ROM )是B I R T 的报表各元素的格式规范.本文在ROM 的基础上,提出一个报表搜索引擎解决方案,该解决方案通过对X M L 定义的报表设计文件的搜索,定位符合要求的报表文件,并根据查询关键词在报表中的位置,计算报表的权重系数,给出符合用户用意的结果报表列表.同时,根据用户对查询结果的参数设定,动态生成报表,从而更为准确的找到满足用户需求的报表.关键词:B I R T ;Ecli p se ;ROM ;报表;报表搜索中图分类号:T P 311 文献标识码:A 文章编号:100021220(2007)0621064204Report Search Ba sed on B IRTZHAN G X iao 2hu 1,X I N G Chun 2xiao 2,H E W ei 21(D ep a rt m en t of Co mp u ter S cience and T echnology ,T sing hua U n iversity ,B eij ing 100084,Ch ina )2(R esea rch Institu te of Inf or m a tion T echnology ,T sing hua U n iversity ,B eij ing 100084,Ch ina )Abstract :B I R T is a rep resentative ,Ecli p se 2based open source repo rting system .Based on the X M L design file ,B I R T can get data from relati onal tables and generate repo rts dynam ically .R epo rt O bject M odel (ROM )defines the fo r m at of the elem ent that occurs in the repo rt generated by B I R T .T h is paper p resents a repo rt search engine so luti on based on B I R T ’s ROM .By search ing the repo rt design files defined by X M L ,the engine tries to find the desirous repo rts from m ass.A cco rding to the lo 2cati on that keyw o rd occurs ,engine w ill compute the w eigh t that the repo rt get ,and then give a result list so rted by the w eigh t .A t the sam e ti m e ,w ith the param eters that users set fo r the repo rt design files ,the system w ill dynam ically generate PD F o r H TM L fo r m atted repo rts that B I R T suppo rts so as to m eet the user ’s needs mo re p recisely .Key words :B I R T ;ecli p se ;ROM ;repo rt ;repo rt search1 引 言报表是从数据源中提取,并经处理最终形成展示的结构化信息文档.报表是应用系统中重要的展示环节,需求较大,也需要大量的精力和资源.全球众多公司、组织每年都会制作各式各样、多种用途的报表.收入分析表、支出分析表、现金流量表、增值税务明细表等形式多样,面向的用途也不尽相同.W HO (W o rld H ealth O rganizati on )每年会制作全球各个国家的健康统计报表,作为众多国家及国际性组织制定财政等方面的决策依据.此外,报表面向的对象也不相同,同一份报表不同身份的人得出的结论不尽相同.一般地,如果说普通员工更关注报表的细节层面,那么高层领导更多的站在战略的角度分析历史数据,为企业提供分析和决策支持信息.虽然报表可以按其用途和时间分门别类进行管理,不过一旦数量多起来,简单的报表分类和命名已经不能胜任.职员要疲于在繁多的报表库中依次查询需要的报表,费时费力.既然可以针对繁多的网页开发网页搜索引擎查询自己需要的信息,自然地,本文提出了报表搜索的想法,对于查询关键词给出最准确表达搜索者意愿的报表,达到报表搜索的目的.2 现有工作及不足为了提高工作效率,解决报表的制作问题,出现了报表设计工具.报表设计工具也经历了长期的发展历程,从原始的依靠手工编写代码处理各种需求,发展到后来基于数据表和视图的分组报表,此阶段的典型代表是水晶报表(C rystal R e 2po rt ),它的设计思想一直影响到现在.应用开发水平提高的同时,报表设计工具也步入了B S 时代,由以往的C S 结构逐步过渡到支持W eb 的架构,此时代表的设计工具有SQLServer R epo rting Services [1]、润乾报表设计工具[2]等.现在报表的定义制作较多的基于X M L 标准,使用基于X M L 格式的报表,报表制作者可以通过R epo rt D esigner 透明的生成X M L 文件,而且可以通过文本编辑器等工具对已经制作的报小型微型计算机系统Journal of Ch inese Computer System s 2007年6月第6期V o l 128N o .62007表进行手工修改.针对W eb报表工具软件领域几乎被国外的报表厂家垄断的情形,国内对此做出还击,设计了智能报表生成工具XB I R Too l[3],快捷、方便的形成可自由透过防火墙的基于W eb的报表系统.此外,润乾公司[2]作为新一代国内报表公司,开发了与传统报表设计模型不同的报表软件,根据报表的需求设计了全新的数学模型,可以解决报表单元格与数据字段之间的弱关联性,在制作复杂报表时,开发效率和运行效率都高出传统工具数倍.对基于X M L标准的报表进行搜索一方面要结合报表的特殊性,另外很大程度上需要借助W eb搜索引擎的技术知识.现在的网页搜索引擎发展迅速,Google、Baidu更是成为其中的代表.开发一般的网页搜索引擎主要步骤如下:首先通过Sp ider或Robo t根据规则提取页面,服务器分析网页信息生成摘要,建立或更新索引,最后提供给用户服务.虽然现在的网页搜索引擎技术得到了很大的提高,搜全率和搜准率也在不断提升,但搜索引擎对所有的网页一视同仁,没有对检索领域作进一步的细分,搜索得到的结果一定程度上仍然不能满足大家的需求.因此,针对特定领略的搜索引擎便提上日程,特别在X M L文档大量涌现的年代,针对特定领域的X M L文档检索需求迫切,其中一个应用实例就是本文提出的基于X M L格式的报表文档的搜索.目前也已经存在一些报表搜索的实现,美国农业部的U SDA Econom ics,Statistics and M arket Info r m ati on Sys2 tem,提供基于关键字和标题的报表搜索,该系统涵盖了300个报表和数据集,结果提供txt和pdf两种格式的展示形式.该实现方案首先对报表进行标注,提取出其中的主题等信息,插入到数据库中,利用成熟的数据库技术,通过对数据库的查找,找到满足条件的报表.不过一方面检索到的报表形式已经确定,无法更改,另外也无法对报表中的数据作进一步的过滤更改等限制,而且需要首先进行手工标注再插入到数据库中,费时费力,效率低下.还有,搜索的结果只是简单的按照时间排序,没有充分结合用户的信息.但是用Google搜索“清华大学”,其结果会把清华大学的主页链接放在第一的位置.报表搜索的需求更是如此,给定的查询条件通过报表搜索引擎如何更为准确的反映或接近搜索者的意愿,对决策者意义将非常重大.本文针对现有实现的缺陷,提出一个报表搜索解决方案.根据关键词在报表中的位置确定报表权重,在提供给用户结果列表链接的同时,让用户自行对报表设定参数,再结合用户对报表的倾向权重,动态生成更满足用户需求的报表.3 基于B IRT的报表搜索解决方案本文提出了基于B I R T(Business Intelligence R epo rting Too ls)[4]的ROM(R epo rt O bject M odel)建立的报表的搜索引擎解决方案,可省去手工标注的烦琐过程,还可以更加准确的给出符合用户意愿的报表结果列表,搜索结果更为人性化.3.1 框架结构图报表有pdf、excel、h tm l、txt等不同的展示形式,而且报表可以看作由布局格式和报表数据组成,导致了布局和数据混杂在一起,这些在一定程度上都给报表的搜索带来很大的难度.报表的展现形式多种多样,而且每种形式的冗余信息也比较多,所以直接对最终展示的报表形态进行检索不为明智之举.因此,我们选择数据库中的数据和最终展示的中间设计文件作为我们的搜索对象,在B I R T中,这种中间设计文件称为rp tdesign文件.图1 基于B I R T的ROM建立的报表搜索引擎框架图F ig.1 R epo rt search fram ew o rk based on B I R T’s ROM搜索引擎对存放到Rp tdesign R epo sito ry中的报表设计文件建立索引,提供检索服务.用户提出查询请求(U ser Q uery),经过搜索引擎的查询,给出原始结果列表,然后再经过R ank ing M odule,结合用户信息(U ser P rofile),给出最符合用户用意的结果列表.用户对于得到的报表设计文件可以自行设定报表参数,利用B I R T R epo rt Generato r动态生成各种形式的报表.3.2 B I RT简介商务智能报表工具B I R T是基于Ecli p se的、开源的、面向W eb应用的专业报表系统.目前2.0版本已经发布,而且B I R T也已经得到越来越多的报表制作人员的青睐.本文主要就现有的报表搜索引擎实现的不足,提出了一种基于B I R T的ROM制作的报表的搜索引擎架构.图2 B I R T框架简图[4]F ig.2 F ram ew o rk of B I R TB I R T使用Ecli p se平台,给报表设计者提供了一个桌面环境,可以为J2EE的W eb应用程序创建PD F或H TM L格式的报表.B I R T的出现使得报表的制作变得更为简单灵活.56016期 张小虎等:基于B I R T的报表搜索 B I R T的主要两个模块是R epo rt D esign Engine和R e2 po rt Engine.通过R epo rt D esign Engine设计报表布局及数据来源,其生成的结果文件格式(rp tdesign)是符合ROM规范的. ROM描述了B I R T的各个构成元素的模式定义.最后通过R epo rt Engine生成最终报表.其中的R epo rt Engine也成为我们的报表搜索引擎的重要组成模块,依此实现动态生成报表的目的.3.3 模块分析系统的检索对象是B I R T的rp tdesign文件,而且rp tde2 sign文件是X M L格式的,因此系统需要X M L文档检索模块.基于X M L的搜索引擎有两种信息检索单位,第一种是以文档为检索单位,第二种是以文档中的被标注元素为检索单位.其中第二种把X M L文档库看作是半结构化文档的数据库,并使用了相应的数据库风格的查询语言[5].X M L文档的检索较多采用XQ uery和XPath技术,T eXQ uery[6]扩展了XQ uery,可以满足更多的检索需求.不过关于X M L文档的检索不是本文的重点.搜索引擎虽然能够检索出文档,不过得到的只是一个无序集合,而且其对所有的文档都一视同仁,从而不能利用一些文档的特殊性提高检索精确度,所以需要在这基础上做进一步的改进,也造就了本文的工作:建立针对特定用途的结构化信息较强的搜索引擎.接着的模块是R ank ing M odule,也是本文的工作重点.对X M L文档搜索引擎给出的结果列表进行再整理,充分利用报表的特点,给出合理的结果列表.对于关键词在报表中出现的位置计算其对整体的权重贡献,该内容将在本文的第四部分进行详细的说明.R epo rt Generato r利用了B I R T中的B I R T R epo rt En2 gine,对于给定的rp tdesign文件,结合对应的数据库,再根据检索者对报表的参数设定,动态的生成各种指定类型的报表. R epo rt Generato r是B I R T中的重要组成部分,本文也正是利用该部分的成果从而达到可以动态生成报表的目的.最后,设立Cache缓存,对于相同用户或者相似用户的请求可以直接从Cache中得到结果,避免烦琐的计算转换工作,该部分是可选环节.系统架构中并没有对用户的查询做进一步的拓展,更多的是利用已有的开源项目提供的接口,如果需要做进一步的个性化服务,可以对系统的查询部分进行一定的扩展,P I2 M EN T[7]就是个性化查询方面一个很好的示例.3.4 本文工作特色本文主要有如下四点特色:1.X M L文档检索和结果评估相结合现在的搜索引擎较多的是结合H TM L页面检索和结果评估,提供给用户结果网页的链接,针对X M L文档的较少.本文把X M L文档检索和结果评估进行结合,而且提供给用户结果报表的链接.2.根据关键词在报表中的位置确定报表权重出现检索词的报表文件,根据检索词在报表中的出现位置计算其对检索的贡献权重,从而给出更符合用户意愿的报表.3.动态生成报表现有一些实现报表搜索的系统只是简单的提供最终的展示形态,用户只可以浏览,无法进行一定的修改自定义.本文提出的解决方案,在给出结果列表的同时,可以对报表的生成进行一定的限制,同时可以针对用户的参数设定动态的生成报表.4.用户倾向权重不同的用户看待同一份报表可能有不同的答案,本文设计了U ser P rofile模块,根据用户的身份对报表给予不同程度的倾向权重,也将影响到结果排列.4 权重计算模块(Rank i ng M odule)4.1 权重计算对搜索结果的排序是众多搜索引擎一个需要重要考虑的环节,也是本文框架结构的重点部分.其中的R ank ing M od2 ule根据用户的查询请求,确立查询的关键词在各个文件中的权重,从而给出按照权重大小排列的结果列表.Google采用PageR ank算法作为衡量网页重要性的一个重要指标,其基本思想就是“从优秀的页面链接出的页面也是优秀的页面”.我们可以把一份报表看作书的一页,存在页眉、页脚和中间内容之分.但是对于出现在这三个地方的词语的重要性不可等同而语,很明显页眉和页脚的重要性比内容部分重要性更大.但是中间的内容部分的关键词出现的位置对于重要性的贡献也不尽相同,对于一个表格,表头位置的重要性高于子表的重要性.不过对报表而言,中间的内容形式也比较繁多,有表格、饼图等多种形式.所以,本文提出了基于关键词在报表中的位置计算重要性的方法.一般地,对于查询Q=(k1,k2,…,k n),其中k i(i∈{1,2,…,n})表示检索的关键词,n为关键词数目,我们采用下面的公式计算报表权重得分RR(R epo rt R ank).R R(Q)=Αr (R ki) =Αr∑k i∈QR(k i)2 (1)其中R(k i)表示每个关键词对该报表贡献的权重,Αr根据U ser Po rfile模块,确定用户对该报表的倾向权重系数.系统中Αr采用二维矩阵表征,第一列代表不同的用户身份,第二列为不同的身份对该类型报表的倾向权重系数.对于R(k i)的计算,我们有R(k i)=∑occur(k i)m=1r(p m,k i)(2)其中occu r(k i)表示关键词k i出现的次数,r(p m,k i)表示每次的出现给予的权重贡献,且关于r(p m,k i)的计算有如下的公式:r(p m,k i)=ABCr(p m1,k i)=Dr(p mt,k i)=D×d ecay t-1p ag e head er f ootertitletable chart head ertable content当关键词位于报表的页眉或页尾处赋予权重A;当关键词位于报表主体内容处的标题位置赋予权重B;当关键词出现在报表主体内容的表格的表头位置,赋予权重C.6601 小 型 微 型 计 算 机 系 统 2007年对于表格内部的权重计算略微复杂,当关键词出现在表格内容顶端则赋予权重D ,但是随着出现关键词出现的层次深度的增加,其贡献的权重也随之减少.解决的方案可以像[8]提到的增添递减系数.此处的权重乘以递减系数decay ,d ecayt -1中的t 表示相对于第一层的层次深度.而且上面的计算公式容易有A >B >C >D 的结论.5 实 例根据上面的流程和权重算法,我们给出下面的实例:图3 示例报表一F ig .3 R epo rt samp le 1对于查询Q =“2005Beijing R evenue ”,根据上面公式,设定A =4,B =3,C =2,D =1,递减系数decay =2.那么可以得到下面的计算结果:R R 1(Q )=B 2+B 2+B 2=27R R 2(Q )=C 2+C 2+B 2=17R R 3(Q )=B 2+D 2d ecay +B 2=18.5(以上计算都采用默认设定Αr =1).图4 示例报表二F ig .4 R epo rt samp le 2尽管在基于位置的权重计算中有R R 1(Q )>R R 3(Q )>R R 2(Q )的结果,但是不同的用户身份仍然可以得到不同的结果列表,主要就是对Αr 的设定不同.考虑三种用户:普通用图5 示例报表三F ig .5 R epo rt samp le 3户、地区部门主管、最高决策者.如此,三类用户得到的结果顺序就会稍显不同.对于最高层决策者,设定Αr 1=0.5,Αr 2=0.75,Αr 3=1,那么就可以得到R R 1(Q )′=6.75,R R 2(Q )′=9.56,R R 3(Q )′=18.5,从而对于最高层决策者就有这样的结果排列:R R 3(Q )′>R R 2(Q )′>R R 3(Q )′,其中一个重要的因素就是Αr 的设置.如果仅仅使用文本检索或者X M L 文档搜索引擎,三个文档都可以被检索到,但是其推荐给检索者的顺序也将会出现P 33=6种可能,所以采用本文提出的基于关键词位置的搜索引擎一定程度上可以更为准确的表达搜索者意愿.6 结 论对于公司、组织内部的报表,合理的管理必不可少,但是随着报表数目的日益增多,建立报表搜索引擎不失为明智之举.文中的报表搜索是针对关键词的匹配,但是考虑到了关键词的在整个报表中出现位置,再结合用户对于不同类型的报表的倾向,从而给予不同的权重;此外,对于检索出的报表文件,可以使用报表生成器,结合用户的参数设定,动态生成报表,此构成了本文的报表搜索的重要特色.但是我们的工作也存在一些不足,对于具体的关键词的权重设定的粒度比较大;同时对于查询的内容,较多的放到了节点内容,对于B I R T 中的脚本和数据库中的数据等检索考虑较少,这些都是需要进行改进的地方.References :[1]SQL server repo ring service [EB OL ].h ttp : www .m icro soft .com ch ina sql repo rting default .asp .[2]R un qian softw are [EB OL ].h ttp : www .runqian .com .cn .[3]Pan Fu 2cheng ,Zhang Sh i 2jie .XM L based intelligent repo rt too l[J ].M ini 2M icro System s ,2005,26(1):1342138.[4]Ecli p se B I R T [EB OL ].h ttp : www .ecli p se .o rg birt .[5]W ang H ai 2bo,J iang J i 2fa,Geng H ui,et al .R esearch of XM Lsearch engine [J ].A pp licati on R esearch of Computers ,2001,18(4):68271.[6]Sihem Am erYah ia ,Chavdar Bo tev ,Jayavel Shanm ugasun 2daram .T eXQ uery :a full 2text search extensi on to XQ uery [C ].In:P roceedings of the 13th Internati onal Conference on W o rld W ide W eb ,A CM P ress ,2004,5832594.[7]Sihem Am er 2Yah ia ,Irini Fundulak i ,P rateek Jain ,et al .Per 2sonalizing XM L text search in P I M EN T [C ].In :P roceedings of the 31st VLDB Conference ,2005,131021313.[8]L in Guo,Feng Shao,Chavdar Bo tev,et al .XR ank:rankedkeywo rd search over XM L [A ].In :H alevy A Y ,Ives ZG ,Doan A et al .P roc .of the 2003A CM S IG M OD Int ’l Conf .on M an 2agem ent of D ata (S IG M OD )[C ].San D iego :A CM P ress ,2003,16227.76016期 张小虎等:基于B I R T 的报表搜索 。
- 1、下载文档前请自行甄别文档内容的完整性,平台不提供额外的编辑、内容补充、找答案等附加服务。
- 2、"仅部分预览"的文档,不可在线预览部分如存在完整性等问题,可反馈申请退款(可完整预览的文档不适用该条件!)。
- 3、如文档侵犯您的权益,请联系客服反馈,我们会尽快为您处理(人工客服工作时间:9:00-18:30)。
birt报表例子
BIRT(Business Intelligence and Reporting Tools)是一种开源的报表设计工具,它能够在Java环境下生成高度交互式的报表。
BIRT报表设计工具提供了简单易用
的界面,使用户能够方便地创建和自定义各种类型的报表。
在本篇文章中,我们将介绍几个BIRT报表的例子,以帮助读者更好地理解和使用BIRT报表工具。
例子一:销售报表
假设我们正在使用一个电商平台来销售商品,并且我们想要分析销售数据以了
解最受欢迎的产品和销售业绩。
我们可以使用BIRT报表工具来设计一个销售报表。
该报表可以显示每个产品的销售数量、销售额和销售额占总销售额的比例。
此外,我们可以根据时间过滤数据,比如选择一个特定的月份或者一个特定的时间段。
通过这个报表,我们可以轻松地分析销售数据,以便做出更好的商业决策。
例子二:库存报表
假设我们在一个仓库管理系统中,我们想要生成一个库存报表,以了解每个产
品的库存情况。
我们可以使用BIRT报表工具来设计一个库存报表。
该报表可以显
示每个产品的库存数量、已销售数量和剩余数量。
我们还可以根据产品类别进行分组,并在报表中显示每个类别的总库存数量。
通过这个报表,我们可以很方便地查看和比较不同产品的库存情况,从而更好地管理库存。
例子三:员工绩效报表
假设我们是人力资源部门的负责人,我们想要评估员工的绩效以便做出合适的
奖励和提升决策。
我们可以使用BIRT报表工具来设计一个员工绩效报表。
该报表
可以显示每个员工的绩效评分、销售额和完成的项目数量。
我们还可以在报表中显示各个部门的平均绩效评分和总销售额。
通过这个报表,我们可以更准确地评估员工的表现,并制定相应的奖励和晋升策略。
例子四:学生考试成绩报表
假设我们是一所学校的教务处老师,我们想要生成一个学生考试成绩报表,以便分析学生的表现和制定有针对性的教学计划。
我们可以使用BIRT报表工具来设计一个学生考试成绩报表。
该报表可以显示每个学生的各科成绩和总成绩,并可以根据性别、年级或班级进行分组。
我们还可以在报表中显示各个班级或年级的平均成绩和考试通过率。
通过这个报表,我们可以更好地了解学生的学习情况,以便提供个性化的教学支持。
总结
BIRT报表设计工具为用户提供了一个简单而强大的方式来设计和生成各种类型的报表。
无论是销售报表、库存报表、员工绩效报表还是学生考试成绩报表,BIRT都可以满足用户的需求。
通过这些例子,我们可以看到BIRT的灵活性和扩展性,帮助用户更好地分析数据和做出决策。
无论您是商业人士、管理人员还是教育工作者,BIRT都是一个值得尝试的报表设计工具。