A Molecular Dynamics Simulation of Heat Conduction in Finite Length SWNTs
流体的计算机模拟及其进展07 (1)
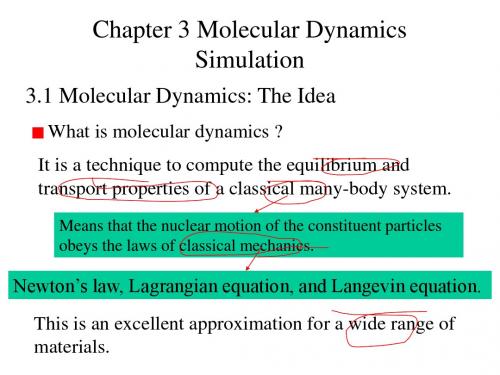
4.2 Molecular Dynamics: A Program
The best introduction to MD is to consider a simple program. We keep it as simple as possible to illustrate some important features of MD. It is constructed as: read in the parameters that specify the conditions of the run (e.g., initial temperature, number of particles, density, time step, etc.); Initialize the system (select initial ri and vi); Compute the energy and forces on all particles; Integrate Newton’s equations of motion; measure the quantities in the present time; After completion of the central loop, compute and print the averages of measured quantities, and stop. Central loop, the core of the simulation
In which case should we worry about quantum effects?
When we consider the the translational or rotational motion of light atoms or molecules, or vibrational motion with a frequency ν such that hν > kBT. He, H2, D2, etc. Of course, our course of this vast subject is incomplete. If you need the knowledge beyond the course, you can read the references on the coming slide.
Molecular Dynamics__ Simulation
A Digital Laboratory
“In the real world, this could eventually mean that most chemical experiments are conducted inside the silicon of chips instead of the glassware of laboratories. Turn off that Bunsen burner; it will not be wanted in ten years.”
From Potential to Movement
To run the simulation, we need the force on each particle.
Fi m i a i
We use the gradient of the potential energy function. Now we can find the acceleration.
E Lennard
Jones
nonbonded pairs
《Al_xCoCrFeNi高熵合金力学性能的分子动力学模拟》

《Al_xCoCrFeNi高熵合金力学性能的分子动力学模拟》一、引言高熵合金(High-Entropy Alloys, HEAs)以其独特的物理和化学性质,近年来在材料科学领域引起了广泛的关注。
AlxCoCrFeNi高熵合金作为一种重要的多主元合金,具有优良的力学性能和广泛的工业应用前景。
然而,对其力学性能的微观机制,尤其是原子尺度的行为和交互过程的理解仍然有限。
因此,本研究采用分子动力学模拟(Molecular Dynamics Simulation, MDS)的方法,对AlxCoCrFeNi高熵合金的力学性能进行深入探究。
二、分子动力学模拟方法分子动力学模拟是一种强大的计算工具,能够从原子尺度上模拟材料的行为和性质。
在本研究中,我们采用先进的分子动力学模拟方法,对AlxCoCrFeNi高熵合金的力学性能进行模拟。
首先,我们构建了具有实际晶体结构的模型,然后通过调整模型中的原子间相互作用力场参数,使其能够反映真实的高熵合金的物理性质。
接着,我们使用牛顿运动定律对模型进行动态模拟,以获得材料在各种条件下的力学性能。
三、模拟结果与分析1. 弹性性能通过模拟,我们得到了AlxCoCrFeNi高熵合金的弹性常数和弹性模量等参数。
结果表明,该合金具有较高的弹性模量和良好的弹性性能。
这主要归因于其独特的晶体结构和原子间的相互作用力。
2. 塑性变形在模拟过程中,我们观察到AlxCoCrFeNi高熵合金在受到外力作用时,原子间的相互作用力会发生变化,导致材料发生塑性变形。
这种变形行为具有显著的剪切带特征,表现出较高的延展性和韧性。
3. 强度与韧性通过对模拟结果的分析,我们发现AlxCoCrFeNi高熵合金的强度和韧性具有优异的综合性能。
随着铝含量的增加,合金的强度会有所提高,同时保持良好的韧性。
这种良好的综合性能主要得益于合金的多主元组成和独特的晶体结构。
四、结论本研究采用分子动力学模拟的方法,对AlxCoCrFeNi高熵合金的力学性能进行了深入探究。
13. MOE_Course_MolecularDynamicsSimulation

6
MD的计算原理
初始化粒子的空间位置 ri 、初始速度 v i
每 次 循 环 为 一 次 时 间 的 演 进
计算粒子受力 Fi 牛顿运动方程:Fi t mi ai t
vi t t vi t ai t t
ri t t ri t 0.5 ai t t 2
•1971年:模拟具有分子团簇行为的水的性质(Rahman and Stillinger)
•1977年:约束动力学方法(Rychaert, Ciccotti & Berendsen; van Gunsteren) •1980年:恒压条件下的动力学方法(Andersen法、Parrinello-Rahman法) •1983年:非平衡态动力学方法(Gillan and Dixon) •1984年:恒温条件下的动力学方法(Berendsen et al.) •1984年:恒温条件下的动力学方法(Nosé-Hoover法) •1985年:第一原理分子动力学法(Car-Parrinello法)
E = Ep+Ek
▪ 系统的势能
Ep
1i j N
V (rij )
▪ 系统的内能
p2 Ek i 2mi
▪ 系统的温度
1 T dNkB
2 m v ii i
Copyright © 2012 Chemical Computing Group Inc. & CloudScientific All Rights Reserved.
中心盒子中各粒子的运动
▪ 条件:粒子i不能同时和粒子j及粒子j 的镜像作用,L>2rcut(粒子间相互 作用势能的截断距离必须不大于模 拟中心元胞长度的一半)。
Molecular Dynamics Simulation of Biomolecules

Molecular Dynamics Simulation ofBiomolecules分子动力学模拟生物分子随着计算机技术的不断提高和发展,分子动力学(Molecular Dynamics, MD)模拟技术已经成为了研究生物分子的常用手段之一。
分子动力学模拟能够提供生物分子的结构、动力学行为和相互作用情况等方面的详细信息,这对于研究生物分子的运动、结构和功能具有十分重要的意义。
如何进行分子动力学模拟在分子动力学模拟中,生物分子的各种物理和化学属性被视为具有原子、键、角度、二面角等基本参数的粒子群体。
通过在计算机中构建分子的三维结构,再利用牛顿运动定律来模拟分子运动的过程,从而对生物分子进行研究。
分子动力学模拟主要包括五个步骤:1.建立系统并选择模拟程序;2.优化体系结构;3.平衡体系;4.进行模拟;5.数据处理和后续分析。
建立系统并选择模拟程序在选择模拟程序前,需要知道自己要研究的生物分子是哪种类型的分子,例如蛋白质、核酸或者膜蛋白等。
然后需要准备原子坐标文件和分子拓扑信息。
对于生物分子的模拟程序,如Amber、Gromacs、NAMD等,用户需要有一定的编程基础才能灵活使用,但是这些程序通常拥有完善的分子模型和参数库。
优化体系结构构建体系前先需要决定需要添加的离子种类、水分子种类等环境因素。
对于要模拟的生物分子,分子中的氢原子需要加上,还需要进行氢键的判断。
优化过程包括对分子能量进行最小化,氢键和局部构象的发现,借助最优结构得到分子的初始构象,使分子达到能量最低、构象最稳定的状态。
这个过程将影响分子的后续模拟结果。
通常模拟程序会提供对于优化过程的参数设置。
平衡体系平衡体系是指让优化后的体系进入平衡状态,即每个物理参数在一个稳定的状态分布。
主要是将分子结构进行能量最小化,避免过多的能量波动。
平衡分子的方法不一,包括能量最小化、碳离子模拟退火等方法。
其中,分子动力学是较常用的模拟方法之一。
进行模拟在体系平衡后,就可以进行模拟了。
molecular-dynamics simulations

Pressure-transmitting boundary conditions formolecular-dynamics simulationsCarsten Sch€a fer a,Herbert M.Urbassek a,*,Leonid V.Zhigilei b,Barbara J.Garrison ca Fachbereich Physik,Universit€a t Kaiserslautern,Erwin-Schr€o dinger-Straße,D-67663Kaiserslautern,Germanyb Department of Materials Science and Engineering,University of Virginia,Charlottesville,VA22903,USAc Department of Chemistry,152Davey Laboratory,Pennsylvania State University,University Park,PA16802,USAReceived10October2001;accepted20November2001AbstractA scheme for establishing boundary conditions in molecular-dynamics simulations that prevent pressure wave reflection out of the simulation volume is formulated.The algorithm is easily implemented for a one-dimensional geometry.Its efficiency is tested for compressive waves in Cu.Ó2002Elsevier Science B.V.All rights reserved. PACS:02.70.Ns1.IntroductionMolecular-dynamics calculations are generally used to simulate macroscopic systems containing a large number(in the order of Avogadro’s number, 1023)of atoms.By necessity,the simulation con-centrates on a small part of the system,on the order of several hundreds[1]to a maximum[2] of nowadays5Â109atoms.This reduction in sys-tem size is possible,if convenient boundary con-ditions are applied to the simulation volume;these boundary conditions are chosen to mimic the re-sponse of the surrounding material to the pro-cesses occurring in the simulation volume itself.The boundary conditions applicable to simula-tions in thermodynamic equilibrium(static re-sponse)have been well studied in the past[3–6]. However,nowadays,often non-equilibrium pro-cesses are to be simulated.Then the formulation of the appropriate boundary conditions poses a larger challenge,as they need to incorporate the dynamic response of the surroundings to the pro-cesses occurring in the simulation volume.Thus, for example,if heat is produced in the simulation volume,the boundaries have to dispense of it in a realistic way,mimicking the natural heat con-duction of the solid.This can be achieved using so-called energy-dissipating boundary conditions [7,8].This problem arises, e.g.,when energetic processes,such as ion or laser irradiation of a solidComputational Materials Science24(2002)421–429*Corresponding author.E-mail address:urbassek@rhrk.uni-kl.de(H.M.Urbassek).URL:http://www.physik.uni-kl.de/urbassek.0927-0256/02/$-see front matterÓ2002Elsevier Science B.V.All rights reserved. PII:S0927-0256(01)00263-4surface,are simulated[7,9].Analogously,stress produced in the simulation volume has to be re-laxed at the boundaries in a way compatible with the elastic properties of the solid.Again,this is quite a commonly encountered phenomenon in irradiation or impact simulations[10,11].The latter class of boundary conditions is more difficult to formulate.In fact,a number of schemes have been published recently to solve this problem that are based on a generalized Langevin approach [12–14],in which the reaction of the surrounding is incorporated into the dynamical equations of the simulation volume via(delayed)forces[15,16].It turns out,however,that the calculation of these boundary conditions is rather time consuming. For this reason,we propose in this paper a simple phenomenological scheme to handle pressure re-laxation and pressure wave transmission,which is easy to implement and adds virtually no extra computational costs to the simulation.This scheme was introduced in Ref.[17],and used re-peatedly for applications in laser ablation of solids [11,18,19].We shall validate the scheme for a me-tallic system by investigating its ability to transmit pressure waves.2.Formulation of boundary conditions2.1.Passage of a pressure wave through matterIn order to set the stage,we remind the reader of the basic properties of a pressure wave in a solid.Fig.1exemplifies the conditions in a mate-rial through which a pressure wave passes.The figure was taken from a molecular-dynamics sim-ulation of Cu;the wave was started by applying a sudden force perpendicular to the surface(for de-tails see Section3below).The quantities discussed below denote local averages;they were determined in the simulation as averages over a distance of r c¼6:2 A,the cutoffradius of our potential.The pressure wave runs with a velocity of55 A/ ps,which is25%above the speed of sound,which is c0¼44 A/ps for a longitudinal wave in Cu in the [100]direction;it is hence a(moderately)weak pressure wave[20].In the wave itself,the density n is increased by around10%above the nominal crystal density n0¼0:085 AÀ3.In the region of enhanced density––between27and35 A,roughly ––the atom velocity u is non-vanishing;its values, however,are small compared to c0.The pressure p, however,starts to become already strong in the leading part of the wave,before atoms have reached sizable velocities.This is in contrast to a well-known relationship[21],which has pressure to be proportional to the atom velocityp¼Àmn0c0u¼ÀZu;ð1Þwhere m is the atom mass,and Z¼mn0c0is called the impedance of the system;in our case,Z¼3:96 GPa/( A ps)¼24:7meVps/ A4.Inspection of Fig.1b and c shows that this simple proportionality does not hold on the microscopic(atomistic)scale.It is the purpose of the following section to show that a closely related proportionality does indeed hold for a well-defined part of the forces acting on an atom,viz.Eq.(4)below.2.2.Boundary forcesAs soon as such a pressure wave reaches the boundary of the simulation volume,it will be re-flected.This happens for both types of boundary conditions commonly applied,namely free and fixed boundaries.In order to prevent reflection, one has to mimic the action of the surrounding medium on the atoms close to the boundary.We do this in the following way:we define as bound-ary zone the part of the simulation volume adja-cent to the boundary(cf.Fig.2);its width D z must be(slightly)larger than r c.Atoms in the rest of the simulation volume(the MD zone)obey the origi-nal MD equations of motion with forces stemming from the neighboring atoms.Thus in Fig.2,atom i experiences a force F stemming from all atoms j surrounding it.Let us write F asF¼F topþF bottom;ð2Þwhere F top is the force originating from all atoms above i(i.e.,away from the boundary),and F bottom is the force originating from all atoms below it(i.e., closer to the boundary).Here and in the following we shall be interested only in the force components422 C.Sch€a fer et al./Computational Materials Science24(2002)421–429perpendicular to the boundary;hence we can ab-stain from using vector notation.Fig.1d shows F and its two components F top and F bottom in a pressure pulse.We observe that F top and F bottom have a simple unimodal shape,while the total force F shows the more complex structure typical of a pressure pulse,consisting of an accelerating and a decelerating part.While using interatomic interaction to determine both F top and F bottom in themolecular-dynamicszone,in the boundary zone we model F bottom by a simple expression F bc such that atoms in the boundary zone experience a total forceF¼F topþF bc;ð3Þin analogy to Eq.(2).F top is calculated from the interatomic potentials in the same way as in the MD zone.The boundary force,F bc,is directed perpendicular to the boundary.Its magnitude is determined asF bc¼F0Àa u:ð4ÞHere,F0is a static contribution,which is present even if atoms do not move.It is needed to keep the crystal in equilibrium,to counter the force of the top atoms and to eliminate the surface tension forces acting on the atoms in the boundary region. The second part of the force,Eq.(4)is propor-tional to the velocity u of the atoms in the boundary.For the purposes of this paper––short pulses and low ambient temperatures––it is ap-propriate to take u as the velocity of the individual boundary atom.More generally,this procedure would induce an artificial cooling of the boundary, and u should be taken as the average velocity (center-of-mass velocity)of all atoms in the boundary[17].According to Eq.(1),we choose the proportionality constant a asa¼ZA¼mn0c0A;ð5Þwhere A is the cross-sectional area of an atom.Thus,Eq.(4)makes sure that the atoms in the boundary zone are subject to the pressure,Eq.(1), that they need to feel under the passage of a pressure pulse.By prescribing the correct imped-ance to the boundary we prevent acoustic waves from reflecting.We shall hence refer to a as the impedance coefficient in this paper.Note that f¼a=m may be interpreted as a friction coeffi-cient in Eq.(4).Since A is of the order of nÀ2=3,fis proportional to the Debye frequency x D¼ffiffiffiffiffiffiffiffiffiffiffiffi6p2n03pÁ c,where c is an appropriately averaged speed of sound.A friction of f AD¼px D=6was indeed derived by Adelman and Doll[12]in their generalized Langevin approach by using a Brown-ian approximation.We emphasize that the boundary zone must be determined dynamically during the simulation,to keep it a width D z above the bottommost atom layer;its absolute position and even the identity of its atoms can change during the simulation. 2.3.Determination of parametersIn the following,we shall discuss the determi-nation of the parameters necessary to implement the boundary conditions.We shall do this specifi-cally for a many-body potential as it is adequate for a metal,such as the EAM potential[22].The implementation for two-body potentials can be viewed as a special case of this more general type of potentials by setting the many-body embedding function equal to zero.We shall establish the pa-rameters here for the many-body potential defined in Ref.[23].For many-body forces,the partitioning of the (well-defined)total force into F top and F bottom needs an explication.We proceed as follows:let us write the total potential energy of the crystal asE tot¼Xi<jUðr ijÞþXiGðq iÞ;ð6Þwithqi¼Xj¼igðr ijÞ:ð7ÞHere U is a pair potential,G the embedding function,and g the atomic contribution to q i,theso-called electron density.Then the total force on atom i isF i¼Xj¼iF ij;ð8ÞwhereF ij¼Àf U0ðr ijÞþg0ðr ijÞ½G0ðq iÞþG0ðq jÞ g e ij:ð9ÞHere the dash denotes differentiation with re-spect to the argument and e ij is the unit vector pointing from atom j to atom i.F ij may be inter-preted as the force contributed by atom j to the total force on atom i;this makes the partitioning of F i into F top and F bottom by the position of atom j with respect to atom i obvious.We note that these formulae allow us to calcu-late F0,and hence the static part of the boundary force,analytically.Alternatively,F0can be con-veniently determined from a static simulation of the crystal in equilibrium(pressure p¼0).Both procedures yield F0¼0:302eV/ A.The dynamical part of the boundary force is governed by the parameter ing Eq.(5),it could be determined from the impedance of the crystal and the atomic cross-section,which(for the (100)surface)may be set equal to A¼a2=2¼6:53 A2.This gives a value of a theor¼0:162eVps/ A2,corresponding to a friction coefficient f¼2c=a¼24:4/ps.As an alternative procedure,we may determine a by performing a dynamical simulation of a pressure wave travelling through a crystal.The dependence of F bottom on the velocity u in a region far away from all boundaries can thus be deter-mined.The result of such a simulation is shown in Fig.3a.It is seen that F bottom correlates quite well with the individual velocity of each atom.A linear fit gives a simul¼0:193eVps/ A2,in quite good agreement with the estimate a theor given above.We plotted F bc according to Eq.(4)with parameters as discussed above also in Fig.1d.Good agreement with the simulated values of F bottom is observed. Note,however,that in the leading part of the pulse,F bc overestimates F bottom,while it underesti-mates it in the trailing part.We note that we performed the samefit for a soft material,condensed Ar.The results,obtained for a Lennard–Jones pair potential[24],are shown in Fig.3b.Here for negative velocities,a bi-valued result is obtained.This sort of hysteresis behavior is analogous––but more pronounced––to the be-havior found for Cu and discussed above:in the leading(trailing)part of the wave smaller(larger) forces than predicted by Eq.(4)occur.A linearfit is then useful only as an average or for one part of the hysteresis loop.3.ValidationWe shall use in this paper Cu as a model system to exemplify and test our scheme.The molecular-dynamics simulation employs the many-body po-tential defined in Ref.[23];this is of the so-called embedded-atom[22]or tight-binding[25]form. The simulation employs a Cu crystallite at0K with a(100)surface and a cross-sectional area of ð6aÞ2,where a¼3:615 A is the Cu latticeconstant.While the surface is left free,lateral periodic boundary conditions are applied at all four sides. At the bottom of the simulation volume,we shall employ the pressure-transmitting boundary con-ditions,which are the subject of this paper.A convenient way to test our scheme is to measure to which degree the boundary conditions are able to prevent pressure waves from reflection. To this end we prepare a pressure wave by ap-plying a force K for a short period of time(here: D t¼11fs)on each surface atom in the direction perpendicular to the surface.Fig.1showed the form of the resulting pressure wave in the material for a value of K¼7:5eV/ A.In order to quantify wave reflection,we intro-duce the reflection coefficientR¼E refl=E in;ð10Þwhere E in is the(constant)kinetic energy in the wave before reaching the boundary and E refl is the kinetic energy in the crystal after wave reflection. We measured E refl some time after wave reflection, when it had become constant.Let usfirst test whether the parameters F0and a appearing in the boundary force,Eq.(4),were optimal in preventing wave reflection.For this test,wefixed the wave strength to K¼7:5eV/ A, and let the wave interact with a boundary withvarying values of F0and a in the boundary force. Fig.4displays the variation of the reflection co-efficient with F0and a.The optimum reflectivity R opt reaches a value of only3.15%,which is suffi-ciently small for many applications.Note that our pressure wave is very sharp;as was shown in Ref.[15],it can be assumed that the reflection of waves with less steep boundaries will be even more re-duced than the sharp wave studied by us.R opt occurs for the value of F0determined in Section2.3;however,the corresponding value of a¼0:21eVps/ A2is somewhat larger than that found in Section2.3from Fig.3,a simul¼0:193 eVps/ A2.The reason for this increase in the opti-mum value of a may lie in the strength of our pressure pulse.We therefore performed another determination of F0and a for a really weak wave, excited with a force K¼0:75eV/ A.Then the parameter dependence is even more pronounced. Furthermore,the optimum value of a has de-creased from0.21to a value of0.19eVps/ A2,i.e., the value determined from Fig.3in Section2.3. This is due to the fact that for the weak wave,the wave speed is identical to the speed of sound c0. We note that also the scatter in the F bottom vs u correlation is reduced(not shown).Note that R is not very sensitive to changes of the impedance coefficient a in the order of10%; this is helpful,since the determination of a oc-curred either by the determination of crystal pa-rameters like c0,n0,A,which may not be known to an accuracy better than10%(note that in par-ticular the wave speed may increase with wave strength!);or by afitting procedure as displayed in Fig.3,which again is subject to some error.On the other hand,the dependence of R on F0is quite pronounced,and changes of F0by a few%change R distinctly.As outlined above,however,F0can be safely determined with high accuracy analytically or by a staticsimulation.Fig.5shows how R varies with the strength of the pressure wave.Here the optimum value of a simul¼0:193eVps/ A2as determined in Section2.3 has been kept.In particular that we did not opti-mize a for each value of the force K.Note that R is between3%and4%for a wide range of wave strengths,and only increases towards very weak waves.The reason hereto lies in the fact that these quite weak waves become very delocalized during the simulation,and look more like an acoustic wave rather than a pressure pulse.These longer wave trains transmit less efficiently through the boundary zone than a well localized pulse.Thus, the boundary impedance seems to workfine even for stronger waves,where the wave speed is defi-nitely larger than c0.4.Summary•We formulated a conceptually simple and easy-to-implement method which allows to minimize pressure wave reflection at the boundary of a molecular-dynamics simulation volume.•The method is easily adapted to a variety of ma-terials,including those with many-body interac-tion forces.•Two parameters need to be determined for im-plementing the boundary force.We discuss sev-eral ways to determine these,and measure the sensitivity of the method to the accuracy of choosing the parameters.•Wefind pressure wave reflection to be sup-pressed by our method to a level of3–4%which is adequate for many applications. AcknowledgementsThe authors are grateful to M.Moseler and G. Williams for discussions.They thank the computer center RHRK,University of Kaiserslautern,for making available computer time for this study. Appendix A.Microscopic processes during pulse passageIn this appendix,we shall study how the kinetic, potential and total energies summed over all atoms in the crystal change when a pressure pulse im-pinges on the boundary zone.Throughout this appendix,we shall study a pulse excited with a force of7.5eV/ A.Let usfirst study(Fig.1e)the spatially resolved energy content of the pressure pulse displayed in Fig.1.E pot has been set to zero for a crystal in equilibrium.We observe again the rather pronounced sharp front,followed by a rather long,but considerably weaker tail.Note that the front part of the pulse has negative potential energy.This is a feature common to all realistic potentials stretching out further than the nearest-neighbor distance:atoms in front of the pulse feel approaching atoms,and hence the bonding(at-traction)increases.Only when nearest-neighbor atoms come close,does repulsion set in,and the potential energy becomes positive.As a reference case,in Fig.6,we display the temporal changes of the kinetic and potential en-ergies in a crystal of30ML length when the pressure pulse impinges on a free surface.The pressure pulse needs about0.1ps to equilibrate potential and kinetic energy.Note that E kin>E pot, since the pulse is strong enough that the crystal forces become anharmonic.At1ps,the pulse is reflected:at the free surface the crystal almost completely relaxesðE pot¼0Þwhile all energy is converted to kinetic energy.The pulse shape changes upon reflection;hence the oscillations visible afterreflection.Fig.7shows pulse transmission through an ‘ideal boundary’:this was realized by using a large crystal(60ML)and measuring the energies only in thefirst30ML.Upon passage the kinetic energy drops very sharply(within50fs)to about5%of its initial value.The later decrease to0%is quite slow, and takes more than1ps;this is due to the pulse tail shown in Fig.1e.The potential energy shows somewhat more structure:immediately before pulse passage it increases;this occurs when the front part of the pulse possessing negative poten-tial energy(Fig.1e)has passed the ideal boundary. Immediately after passage,it decreases(even below0!);this is due to the oscillatory nature of the pulse visible in Fig.1e.Note that the total energy within thefirst30ML slightly increases immediately before the pulse leaves the zone.This happens when the attractive part of the pulse (cf.Fig.1e)just has passed into the lower30ML.Finally,Fig.8shows what happens when the pulse impinges on the boundary zone presented in this paper.The strong decrease of the energy at1.1 ps proves that this boundary zone essentially acts like the ideal boundary.However,several differ-ences are seen in detail.When the pulse enters the boundary zone,atfirst atoms are decelerated due to the action of the boundary force,Eq.(4).Then, at tffi1ps,atoms are accelerated,in close analogy to what happens at a free boundary,Fig. 6. However,while there the crystal relaxed almost completely to E pot¼0,E pot increases in the bound-ary zone,since atom motion is hindered,and hence repulsive forces dominate.Also after pulse passage,t>1ps,the energies show a temporal dependence different from that of the ideal bound-ary,Fig.7;and in particular not all energy leaves the crystal.References[1]B.J.Alder,T.E.Wainwright,J.Chem.Phys.27(1957)1208.[2]u,MRS Bull.25(9)(2000)5.[3]M.P.Allen,D.J.Tildesley(Eds.),Computer simulation ofliquids,Clarendon,Oxford,1987.[4]J.M.Haile,Molecular dynamics simulation:elementarymethods,Wiley,New York,1992.[5]D.C.Rapaport,The Art of Molecular Dynamics Simula-tion,Cambridge University Press,Cambridge,1995. [6]D.Raabe,Computational Materials Science,Wiley-VCH,Weinheim,1998.[7]J.R.Beeler Jr.,Radiation effects computer experiments,North-Holland,Amsterdam,1983.[8]Y.Wu,R.J.Friauf,J.Appl.Phys.65(1989)4714.[9]R.Smith(Ed.),Atomic and ion collisions in solids and atsurfaces,Cambridge University Press,Cambridge,1997.[10]H.Haberland,Z.Insepov,M.Moseler,Phys.Rev.B51(1995)11061.[11]L.V.Zhigilei,B.J.Garrison,J.Appl.Phys.88(2000)1281.[12]S.A.Adelman,J.D.Doll,J.Chem.Phys.64(1976)2375.[13]J.C.Tully,J.Chem.Phys.73(1980)1975.[14]D.J.Diestler,M.E.Riley,J.Chem.Phys.83(1985)3584.[15]M.Moseler,J.Nordiek,H.Haberland,Phys.Rev.B56(1997)15439.[16]W.Cai,M.de Koning,V.V.Bulatov,S.Yip,Phys.Rev.Lett.85(2000)3213.[17]L.V.Zhigilei,B.J.Garrison,Mat.Res.Soc.Symp.Proc.538(1999)491.[18]L.V.Zhigilei,B.J.Garrison,SPIE Proc.Series3254(1998)135.[19]L.V.Zhigilei, B.J.Garrison,Proceedings of the Inter-national Conference on Modeling and Simulation of Microsystems,Semiconductors,Sensors,and Actuators (MSM’99),Computational Publications,Boston,1999, p.138.[20]Y.B.Zel’dovich,Y.P.Raizer,Physics of Shock Waves andHigh-Temperature Hydrodynamic Phenomena,Vol.2, Academic Press,New York,1967,p.688.[21]Y.B.Zel’dovich,Y.P.Raizer,Physics of Shock Waves andHigh-Temperature Hydrodynamic Phenomena,Vol.2, Academic Press,New York,1967,p.742.[22]M.S.Daw,S.M.Foiles,M.Baskes,Mat.Sci.Rep.9(1993)251.[23]H.Gades,H.M.Urbassek,Nucl.Instrum.Meth.B69(1992)232.[24]L.Verlet,Phys.Rev.159(1967)98.[25]M.W.Finnis,J.E.Sinclair,Philos.Mag.A50(1984)45.C.Sch€a fer et al./Computational Materials Science24(2002)421–429429。
分子动力学模拟英语
分子动力学模拟英语Molecular dynamics simulation is a powerful technique used for the study of complex systems in many fieldsincluding physics, chemistry, materials science and biology. In this article, we will explain the basics of molecular dynamics simulation in English and clarify how it works step by step.Step One: System DescriptionThe first step of molecular dynamics simulation is to describe the system. This involves specifying the number and types of molecules or atoms, the size and shape of the simulation box, and the interactions between the particles. This information is often obtained from experimental measurements, theoretical calculations or from published literature.Step Two: Force FieldOnce the system is described, a force field is defined. This is a mathematical equation that describes how particles interact with each other. The force field contains parameters that determine the strength and range of the interactions between the particles. The most commonly used force fields are CHARMM and AMBER, but there are many others available.Step Three: Time IntegrationMolecular dynamics is a dynamic process, meaning that particles are constantly moving and interacting with each other. The third step is to integrate the motion of the particles over time. This involves solving a set of differential equations that describe the positions andvelocities of the particles at every moment in time. The most commonly used algorithm for time integration is the Verlet algorithm.Step Four: Simulation ParametersSeveral parameters need to be set for a molecular dynamics simulation, including the length of the simulation, the time step size, and the temperature and pressure of the system. These parameters are determined by the specific questions being asked and the properties being studied.Step Five: Simulation ExecutionOnce all the parameters are set, the simulation can be run. During the simulation, the positions and velocities of the particles are updated at each time step based on the interaction potentials defined in the force field. The output of the simulation includes a trajectory file that records the positions and velocities of the particles at every moment in time.Step Six: Data AnalysisAfter the simulation is complete, the final step is to analyze the data. This involves calculating system properties such as energy, temperature, pressure, and structural features. Visualization techniques can also be used to better understand the dynamics of the system.In conclusion, molecular dynamics simulation is an important tool for understanding the behavior of complex systems. It is a highly technical process that involves several steps, including system description, force field definition, time integration, parameter selection, simulation execution, and data analysis. With this powerful simulation technique, researchers can gain insights into properties andprocesses that are difficult or impossible to study experimentally.。
分子动力学模拟的若干基础应用和理论
分子动力学模拟的若干基础应用和理论一、本文概述分子动力学模拟是一种基于经典力学的计算方法,通过求解分子体系的牛顿运动方程,模拟分子在特定条件下的动态行为。
该方法广泛应用于物理、化学、生物和材料科学等领域,为研究者提供了一种有效的工具,以深入理解和预测分子系统的宏观性质。
本文旨在探讨分子动力学模拟的若干基础应用和理论,从基础概念出发,阐述其基本原理、模拟方法以及在各个领域中的应用实例。
我们将详细介绍分子动力学模拟的核心技术,包括力场模型、初始条件设定、积分算法和模拟结果的解析等。
本文还将讨论分子动力学模拟的局限性以及未来的发展方向,以期为相关领域的研究人员提供有益的参考和启示。
二、分子动力学模拟的理论基础分子动力学模拟(Molecular Dynamics Simulation, MDS)是一种强大的计算技术,通过求解分子体系的牛顿运动方程,模拟分子在特定条件下的动态行为。
其理论基础主要建立在经典力学、统计力学以及量子力学之上,但在大多数应用中,由于计算能力的限制,经典力学是主要的工具。
在经典力学中,每个分子的运动可以通过牛顿第二定律来描述,即力等于质量乘以加速度(F=ma)。
在分子动力学中,这些力通常是分子间相互作用力,包括范德华力、氢键、库仑力等。
这些力可以通过分子力学模型或量子力学方法计算得出。
分子动力学模拟通常包括以下几个主要步骤:需要设定模拟的初始条件,包括分子的初始位置、速度和模拟的温度、压力等环境参数。
然后,根据分子间的相互作用力,通过求解牛顿运动方程,计算出每个分子在下一时刻的位置和速度。
这个过程会不断重复,直到模拟达到预设的时间长度或达到某种平衡状态。
在模拟过程中,为了处理大量的分子和长时间的模拟,通常会采用一些近似和简化的方法,如截断半径、周期性边界条件等。
由于分子间的相互作用力往往非常复杂,因此在模拟中通常会采用一些经验性的力场模型,如Lennard-Jones势、Morse势等。
分子动力学amber英语
分子动力学amber英语Molecular Dynamics Simulations: A Primer.Molecular dynamics (MD) simulations are a powerful tool for studying the behavior of molecules and materials at the atomic level. MD simulations use classical mechanics to calculate the positions and velocities of individual atoms and molecules over time, allowing researchers to observe how these systems evolve and interact.How MD Simulations Work.MD simulations begin with the creation of a molecular model, which is a representation of the system being studied. The model includes the positions and velocities of all the atoms in the system, as well as the forces that act between them. The forces are calculated using a force field, which is a mathematical model that describes the potential energy of the system as a function of the atomic positions and velocities.Once the molecular model has been created, the MD simulation is run by integrating the equations of motionfor the atoms over time. This integration is typically performed using a numerical method, such as the Verlet algorithm. The integration step size is typically on the order of femtoseconds (10^-15 seconds), which is small enough to accurately capture the motions of the atoms.As the MD simulation progresses, the positions and velocities of the atoms are updated at each time step. This allows researchers to track the evolution of the system over time and observe how the atoms interact with each other.Applications of MD Simulations.MD simulations have a wide range of applications in chemistry, biology, and materials science. Some of the most common applications include:Protein folding: MD simulations can be used to studythe folding pathways of proteins, which is important for understanding how proteins function.Drug design: MD simulations can be used to predict how drugs will bind to proteins, which can help in the development of new drugs.Materials science: MD simulations can be used to study the properties of materials, such as their strength, toughness, and thermal conductivity.Chemical reactions: MD simulations can be used to study chemical reactions, such as the formation and breaking of bonds.Limitations of MD Simulations.MD simulations are a powerful tool, but they also have some limitations. One limitation is that MD simulations are computationally expensive. This is because the integration of the equations of motion for the atoms over time requires a significant amount of computing power. As a result, MDsimulations are often limited to relatively small systems and short time scales.Another limitation of MD simulations is that they are based on classical mechanics. This means that MD simulations do not take into account quantum effects, which can be important for some systems.Future of MD Simulations.MD simulations are a rapidly growing field, and there are a number of new developments that are making MD simulations more powerful and accessible. One of the most important developments is the use of graphics processing units (GPUs) to accelerate MD simulations. GPUs are specialized processors that are designed for performing large numbers of calculations in parallel, which makes them ideal for MD simulations.The use of GPUs has made it possible to perform MD simulations on much larger systems and for longer time scales than was previously possible. This has opened up newpossibilities for studying complex biological systems and materials.Another important development in MD simulations is the development of new force fields. Force fields are the mathematical models that describe the potential energy of the system as a function of the atomic positions and velocities. The accuracy of MD simulations depends on the accuracy of the force field.New force fields are being developed that are more accurate and that can be used to study a wider range of systems. This is making MD simulations an even more powerful tool for studying the behavior of molecules and materials at the atomic level.。
Tutorial of MD 分子动力学模拟
18
Crystal Structures
The FCC (Face-Centred Cubic) structure
The Hexagonal Close Packed (HCP) structures
19
Sphere Packing
The position of the spheres in the layers is labelled A in the lowest layer, B in the middle layer and C in the top layer
25
Edge dislocation
Edge dislocation
26
Screw dislocation
Screw dislocation
AB—dislocation line b—Burger’s vector
27
Examples:
Transonic vs. Subsonic Dislocation
11
Historical notes
The first paper reporting a molecular dynamics was written Alder and Wainwright in 1957. Dynamics of radiation damage: the first example of a molecular dynamics calculation with a continuous potential. Aneesur Rahman at Argonne National Laboratory, the famous pioneer of molecular dynamics. Loup Verlet calculated in 1967 the phase diagram of argon using the Lennard-Jones potential, and computed correlation functions to test theories of the liquid state. The bookkeeping device which became known as Verlet neighbor list was introduced in these papers. Moreover the “Verlet time integration algorithm” was used.
- 1、下载文档前请自行甄别文档内容的完整性,平台不提供额外的编辑、内容补充、找答案等附加服务。
- 2、"仅部分预览"的文档,不可在线预览部分如存在完整性等问题,可反馈申请退款(可完整预览的文档不适用该条件!)。
- 3、如文档侵犯您的权益,请联系客服反馈,我们会尽快为您处理(人工客服工作时间:9:00-18:30)。
1
Introduction The thermal conductivity of single walled carbon nanotubes (SWNTs) is speculated to be higher than any other materials along the cylindrical axis. Recently, measurements of thermal conductivity of 5 µm thick magnetically aligned deposited ‘mat’ of SWNTs were reported [1]. Comparing with the temperature dependence of electrical conductance in the same condition, it was concluded that the contribution of electrons to the thermal conductivity was negligible in all temperature range. Besides those experiments, several molecular dynamics simulations showed very high thermal conductivity such as 6600 W/mK at 300 K [2]. Since the phonon mean free path is estimated to be order of 100 nm ~ 1 µm, thermal conductivity of nanotubes shorter than a few µm should have the nearly 'ballistic' features with much less apparent thermal conductivity compared to the infinitely long nanotubes. The finite length effect on the heat conduction is explored in this paper.
Results and Discussions The dependence of the thermal conductivity on the nanotube length is summarized in Fig. 1. Even though the thermal conductivity was almost constant for (10,10) independent of the tube length, it was diverging for smaller diameter (5,5) case. This striking behavior of thermal conductivity for (5,5) is similar to the one-dimensional model calculations of thermal conductivity [4] where the divergence of λ with the power of 0.35 or 0.4 is discussed. However, (5,5) nanotube is real physical material. The thermal conductivity may converge when the tube length is much longer than the mean free path of energy carrying phonon. However, the thermal conductivity is still increasing with the power law up to about 0.4 µm nanotube. Because the divergence for (10,10) is not apparent or very weak in Fig. 1, it is speculated that the reason for the divergence is not simply the short length compared to the phonon mean-free-path but the limited freedom of motion for thin (5,5) nanotube. The heat conduction mechanism was explored through the phonon dynamics extracted from the molecular dynamics simulations. The phonon density of states was measured as the power spectra of velocity fluctuations as shown in the right-hand side of Fig. 2. The phonon dispersion relations in Fig. 2 were also directly measured as the time-space 2-D Fourier transforms of the
2
Thermal conductivity λ was calculated by Fourier’s equation q = −λ(∂T / ∂z) with the measured temperature gradient ∂T / ∂z and the heat flux q calculated from the energy budgets of phantom molecules. As the cross-sectional area, a ring area of van der Waals thickness 3.4 Å was employed.
Bunkyo-ku, Tokyo 113-8656, Japan
Abstract The heat conduction in finite length single walled carbon nanotubes (SWNTs) was simulated by the molecular dynamics method with the Tersoff-Brenner bond order potential. Temperature at each end of a SWNT was controlled by the phantom technique, and the thermal conductivity was calculated from the measured temperature gradient and the energy budgets in phantom molecules. The thermal conductivity was measured for (5,5) and (10,10) SWNTs with various lengths from 6 nm through 404 nm. Measured thermal conductivity for smaller diameter (5,5) nanotube did not converge to a finite value with increase in tube length, but obeyed a striking power law relation. The phonon density of states and phonon dispersion relations were calculated from the simulated results for the better understanding of the heat conduction mechanism.
Keywords: Thermal Conductivity, Molecular Dynamics Method, Phonon, SWNT Corresponding Author: Shigeo Maruyama Department of Mechanical Engineering, The University of Tokyo 7-3-1, Hongo, Bunkyo-ku, Tokyo 113-8656, Japan FAX: +81-3-5800-6983, E-mail: maruyama@photon.t.u-tokyo.ac.jp
Simulation Techniques Using the Tersoff-Brenner bond order potential [3], 2 armchair types SWNT structures with different diameters, (5,5) and (10,10), were simulated by the molecular dynamics method. Here, (5,5) has the almost similar diameter as C60 and the huge scale production of SWNTs with this diameter is expected with the new generation technique using high-pressure and high-temperature CO. Here, no periodic boundary condition was applied in order to explore the finite size effect of carbon nanotubes. The length of SWNTs was varied from 6 nm through 404 nm for (5,5) nanotube. By applying the phantom heat bath model to each end of a SWNT, temperature difference was applied. For the average temperature of 300K, phantom temperatures at each end were set as 290 K and 310 K. Typically about 1 ns simulations was necessary for the equilibration with phantom temperature control, and 1 ~ 2 ns calculation was used for the measurement of temperature gradient.