雅思英语描述图表
雅思写作任务1中的图表解释与描述

雅思写作任务1中的图表解释与描述在雅思写作考试中,任务1要求学生解释和描述图表。
图表类型可以是图表、表格、流程图或地图。
学生需要对图表中的数据进行解读,并用适当的词汇和句子来描述和解释。
图表解释和描述通常可以按照以下结构进行组织:1. 引言段:简要概述图表中的主题和数据类型。
最好使用一两句话来引出主题。
2. 总体描述:以全局的方式描述图表中的趋势或关键特征。
可以提到一些关键数字或明显的趋势。
3. 细节描述:对图表中的具体数据进行更详细的描述。
可以选择几个最重要或最显著的数据点进行描述,并用适当的比较和对比来增加分析的深度。
4. 结论段:总结整个图表的主要特点和趋势。
强调最重要的观察结果,并提供一些可能的解释或预测。
下面是一个例子来展示如何按照以上结构来写一篇图表解释和描述的文章:---引言段:本文将解释和描述一张关于全球食品浪费的柱状图。
图表展示了2000年至2015年之间,各大洲每年浪费的食物数量。
数据由联合国提供。
总体描述:总体来看,全球食品浪费数量在这个时间段内持续增长。
同时,发达国家浪费的食物要远远多于发展中国家。
细节描述:在2000年,发展中国家平均每年浪费大约2000万吨食物,而发达国家浪费数量高达8000万吨。
然而,在2015年,发展中国家的食品浪费增加到了3000万吨,而发达国家的浪费数量达到了1亿吨。
在这个时间段内,拉美地区的食品浪费率增长最快。
从2000年的500万吨增加到了2015年的1000万吨。
亚洲和欧洲的食品浪费也有显著增长,分别从2000年的1000万吨增加到了2015年的2000万吨和3000万吨。
结论段:从这些数据可以看出,全球食品浪费是一个严重的问题,尤其是在发达国家。
这可能是因为消费者的浪费行为和供应链中的问题所导致的。
为了减少食物浪费,我们需要通过教育和政策改变来提高人们的意识,并改进供应链的效率。
---以上是一个简单的范例,展示了如何按照结构来写一篇图表解释和描述的文章。
雅思英语描述图表-参考模板
1.我们可以从图表上看出:托雅的女生比例远远高于男生所占比例。
As can be seen from the chart, the percentage of female students was far higher than that of male students at Toya.2.从图表反映的情况来看:读雅思的人数远远超过读托福的,同时,读托福的人数一直呈现平稳上升趋势。
As can be seen from the chart, those who chose to study for IELTS far outnumbered those choosing to study for TOEFL. Meanwhile, the number of those who chose to study for TOEFL was on a steady rise.3.从图表反映的情况来看:托雅学生在饭店用餐的频率在不同的月份呈现出了相应的波动趋势。
As can be seen from the diagram, the frequency of Toya students eating at restaurants revealed a trend of fluctuations in different months.4.从图表反映的情况来看:托雅男教师所承担的每周工作量要高于女教师的。
As can be seen from the charts, the weekly workload borne by male teachers outweighed that of female teachers at Toya.5.从整个图表反映的情况来看:托雅总部以及五个分校的营业收入都呈现出了快速的增长趋势。
As can be seen from the chart, the sales of Toya Headquarter and the five branch schools all revealed a trend of fast increase across the board.6.从整个图表反映的情况来看:托雅教师的收入状况呈现出了稳步增长的总态势。
描述图表的英语范文 雅思

描述图表的英语范文雅思英文回答:The given bar chart depicts the average monthly expenditure of households in five different income groupsin a particular region. The data is presented in British pounds.The highest income group, with monthly earnings exceeding £5,000, spends the most on average, at £3,900 per month. This group also has the highest expenditure on housing, transport, food, and leisure activities.The second highest income group, with earnings between £4,000 and £5,000, spends an average of £3,200 per month. Their expenditure pattern is similar to that of the highest income group, with significant outlays on housing, transport, and food.The middle income group, with earnings between £3,000and £4,000, spends an average of £2,600 per month. Their expenditure is relatively evenly distributed acrossdifferent categories, with slightly higher spending on housing.The fourth income group, with earnings between £2,000 and £3,000, spends an average of £2,100 per month. They allocate a significant portion of their budget to housing and food, with less spending on transport, clothing, and leisure activities.The lowest income group, with earnings below £2,000, spends the least on average, at £1,500 per month. The majority of their expenditure goes towards housing and food, with limited spending on other categories.In summary, the bar chart shows that higher income households spend more on a wider range of goods and services, while lower income households spend less and prioritize essential expenses such as housing and food.中文回答:给定的柱状图描述了某个地区五个不同收入组家庭的平均每月开支。
雅思英语图表作文范文(必备3篇)

雅思英语图表作文范文第1篇A类雅思各类图表作文要点及范文一.曲线图解题关键1曲线图和柱状图都是动态图,解题的切入点在于描述趋势。
2在第二段的开头部分对整个曲线进行一个阶段式的总分类,使写作层次清晰,同时也方便考官阅卷。
接下来再分类描述每个阶段的specifictrend,同时导入数据作为分类的依据。
3趋势说明。
即,对曲线的连续变化进行说明,如上升、下降、波动、持平。
以时间为比较基础的应抓住“变化”:上升、下降、或是波动。
题中对两个或两个以上的变量进行描述时应在此基础上进行比较,如变量多于两个应进行分类或有侧重的比较。
4极点说明。
即对图表中最高的、最低的点单独进行说明。
不以时间为比较基础的应注意对极点的描述。
5交点说明。
即对图表当中多根曲线的交点进行对比说明。
6不要不做任何说明就机械地导入数据,这不符合雅思的考试目的。
曲线图常用词汇动词—九大运动趋势一:表示向上:increase,rise,improve,grow,ascend,mount,aggrandize,goup,climb, take off, jump,shoot up暴涨,soar,rocket, skyrocket雅思英语图表作文范文第2篇It is said that countries are becoming similar to each other because of the global spread of the same products, which are now available for purchase almost anywhere. I strongly believe that this modern development is largely detrimental to culture and traditions worldwide.A country’s history, language and ethos are all inextricably bound up in its manufactured artefacts. If the relentless advance of international brands into every corner of the world continues, these bland packages might one day completely oust the traditional objects of a nation, which would be a loss of richness and diversity in the world, as well as the sad disappearance of t he manifestations of a place’s character. What would a Japanese tea ceremony be without its specially crafted teapot, or a Fijian kava ritual without its bowl made from a certain type of tree bark?Let us not forget either that traditional products, whether these be medicines, cosmetics, toy, clothes, utensils or food, provide employment for local people. The spread of multinational products can often bring in its wake a loss of jobs, as people urn to buying the new brand,perhaps thinking it more glamorous than the one they are used to. This eventually puts old-school craftspeople out of work.Finally, tourism numbers may also be affected, as travelers become disillusioned with finding every place just the same as the one they visited previously. To see the same products in shops the world over is boring, and does not impel visitors to open their wallets in the same way that trinkets or souvenirs unique to the particular area too.Some may argue that all people are entitled to have access to the same products, but I say that local objects suit local conditions best, and that faceless uniformity worldwide is an unwelcome and dreary prospect.Heres my full answer:The line graphs show the average monthly amount that parents in Britain spent on their children’s s porting activities and the number of British children who took part in three different sports from 2008 to is clear that parents spent more money each year on their children’s participation in sports over the six-year period. In terms of the number of children taking part, football was significantly more popular than athletics and 2008, British parents spent an average of around £20 per month on their children’s sporting activities. Parents’ spending on children’s sports increased gradually over the followi ng six years, and by 2014 the average monthly amount had risen to just over £ at participation numbers, in 2008 approximately 8 million British children played football, while only 2 million children were enrolled in swimming clubs and less than 1 million practised athletics. The figures for football participation remained relatively stable over the following 6 years. By contrast, participation in swimming almost doubled, to nearly 4 million children, and there was a near fivefold increase in the number of children doing athletics.剑桥雅思6test1大作文范文,剑桥雅思6test1大作文task2高分范文+真题答案实感。
雅思写作之小作文常用描述图表词汇__
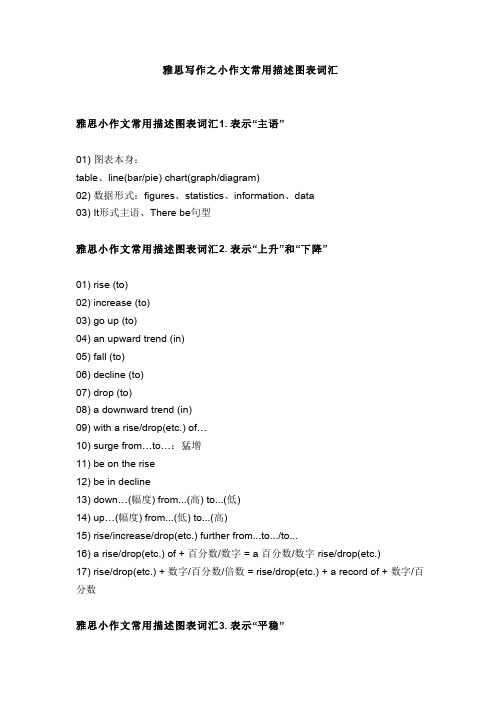
雅思写作之小作文常用描述图表词汇雅思小作文常用描述图表词汇1. 表示“主语”01) 图表本身:table、line(bar/pie) chart(graph/diagram)02) 数据形式:figures、statistics、information、data03) It形式主语、There be句型雅思小作文常用描述图表词汇2. 表示“上升”和“下降”01) rise (to)02) increase (to)03) go up (to)04) an upward trend (in)05) fall (to)06) decline (to)07) drop (to)08) a downward trend (in)09) with a rise/drop(etc.) of…10) surge from…to…:猛增11) be on the rise12) be in decline13) down…(幅度) from...(高) to...(低)14) up…(幅度) from...(低) to...(高)15) rise/increase/drop(etc.) further from...to.../to...16) a rise/drop(etc.) of + 百分数/数字 = a 百分数/数字 rise/drop(etc.)17) rise/drop(etc.) + 数字/百分数/倍数 = rise/drop(etc.) + a record of + 数字/百分数雅思小作文常用描述图表词汇3. 表示“平稳”01) remain stable (at)02) stay constant (at)03) maintain the same level (at)04) remain around that figure05) reach a plateau:到达(上升后的)平稳期 06) no change (in) 07) be flat at:平稳在… 08) level out at:平稳在…雅思小作文常用描述图表词汇4. 表示“波动”、“最高值”和“最低值”01) hover around:在…徘徊02) fluctuate around/at:在…波动(点)03) fluctuate between...and...:在…波动(范围)04) rise and drop (between…and…):起伏(在…之间)05) peak at:在…达到最大值06) hit a peak(of…)07) reach the highest point at:在…达到最大值08) reach a bottom at:在…达到最低值09) reach the lowest point at:在…达到最低值雅思小作文常用描述图表词汇5. 表示“变化程度”01) dramatic → dramatically:巨大02) significant → significantly:巨大03) moderate → moderately:适度04) slight → slightly:微小05) minimal → minimally:极其微小雅思小作文常用描述图表词汇6. 表示“变化速度”01) sudden → suddenly:忽然02) rapid → rapidly:快速03) steady → steadily:平稳04) gradual → gradually:逐渐雅思小作文常用描述图表词汇7. 表示“说明”01) show02) illustrate03) describe04) unfold05) reveal雅思小作文常用描述图表词汇8. 表示“大约”01) about02) nearly03) around04) approximately雅思小作文常用描述图表词汇9. 表示“占据”01) make up02) take up03) account for04) be composed of05) constitute06) comprise07) have/be/reach/hit雅思小作文常用描述图表词汇10. 表示“关于”01) about02) regarding03) concerning04) related to05) with regard to = as to:关于,就…而论(做状语)。
雅思写作备考中的图表数据描述与分析方法

雅思写作备考中的图表数据描述与分析方法在雅思写作备考中,图表数据的描述与分析方法是一个关键的技巧。
图表数据描述与分析旨在帮助考生清晰地传达图表中的信息,并展示对数据的深入理解。
本文将介绍一些有效的方法来描述和分析雅思写作中的图表数据。
一、图表数据描述1. 描述整体趋势:首先,我们可以描述图表中呈现的整体趋势。
可以使用类似于“总体来看”、“总体趋势是”等短语来引出描述。
例如,如果图表显示了过去几年某个城市的人口变化情况,可以说“总体来看,该城市的人口在近几年稳定增长”。
2. 细节描述:接下来,我们需要针对图表中的具体数据进行描述。
可以使用具体的数字、比例或百分比等来描述。
例如,如果图表显示了某个国家不同年龄段的人口比例,可以说“18至30岁年龄段的人口占总人口的30%,是各个年龄段中的最高比例”。
3. 时间和地点描述:如果图表中涉及到时间和地点的变化,我们也需要对其进行描述。
可以使用时间词和地点词来具体说明。
例如,如果图表显示了某个地区不同月份的降水量情况,可以说“6月份的降水量最高,为100毫米”。
二、图表数据分析1. 找出关键信息:在分析图表数据时,需要从中挑选出关键的信息。
这些关键信息可能是特殊的数据点、变化的趋势或者与主题相关的数据。
通过找出这些关键信息,可以帮助我们进行更有针对性的分析。
2. 建立对比:图表数据可以提供不同变量之间的比较基础。
在分析时,可以通过对比不同变量的数据来突出差异和相似之处。
例如,如果图表显示了不同国家的能源消耗量,可以对比两个或多个国家之间的差异并分析原因。
3. 确定影响因素:对图表数据进行深入分析时,需要确定可能影响数据变化的因素。
这些因素可能是经济因素、政治因素、社会因素等。
通过分析这些因素与数据的关系,可以深入理解数据的背后含义。
4. 展望未来趋势:在分析图表数据时,考生可以尝试根据已有数据预测未来的趋势。
这要求考生具备一定的推理能力和对数据的深入理解。
通过展望未来,可以增加文章的可读性和独特性。
雅思写作和口语短语归纳(描述图表)
雅思写作和口语短语归纳(描述图表)1see an upward trend 呈现出上升的趋势The housing market saw an upward trend in 2003.房地产市场在2003年呈现出了上升的趋势。
witness a downward trend 呈现出下降的趋势The prices of consumer goods witnessed a downward trend.消费品的价格呈现出下降的趋势see an opposite trend 呈现出相反的趋势In contrast,the cost of furniture and equipment saw an opposite trend.家具和设备的费用则呈现出相反的趋势。
2rocket to...急速上升至The petrol price rocketed to a record high.汽油价格急速飞升到了历史最高纪录。
soar to... 飞速上升至The rate of heart disease soared to 79 per 1,000 people.患心脏疾病的比例飞速上升至79%。
3peak at...在某位置到达最高点The figures show that the unemployment rate peaked at 9.8% in October.数据显示失业率在十月份达到了最高点9.8%。
reach the highest point 到达最高点The crime rate rose throughout the 1990s and reached the highest point in 2001.犯罪率在整个九十年代都在不断上升,直到2001年达到了顶峰。
4a slump 下挫There was ajdunip in the demand for new cars in 2007.对于新车的需求在2007年有所下挫。
雅思图表类英语作文模板
雅思图表类英语作文模板英文回答:1. Introduce the chart/graph: Briefly describe the type of chart/graph, the data it presents, and the time period or geographical location it covers.2. Overall trend: State the general trend or pattern observed in the data. Use specific numbers or percentages to support your statement.3. Key features: Highlight the most important or noticeable features of the chart/graph, such as peaks, valleys, or changes over time.4. Possible reasons: Speculate on the reasons behind the trends or features you have identified. Consider external factors or events that may have influenced the data.5. Predictions or recommendations: Based on the data presented, make predictions about future trends or provide recommendations for action.中文回答:雅思图表类英语作文模板。
1. 图表介绍,简要描述图表类型、数据内容以及时间跨度或地理范围。
2. 总体趋势,陈述数据中观察到的总体趋势或模式。
雅思图表作文模板 比较
雅思图表作文模板比较雅思图表作文是雅思写作考试中的一个重要部分,要求考生对给定的图表数据进行准确的描述、分析和比较。
为了帮助考生更好地应对这一题型,以下将为大家提供一个较为通用的雅思图表作文模板,并通过实例进行详细讲解。
一、开头段开头段的主要目的是对图表进行简要介绍,包括图表的类型(如柱状图、折线图、饼图等)、主题以及数据所涵盖的时间段。
例如:The given chart is a 图表类型 presenting information about 图表主题over the period of 时间段 It is clear at a glance that some significant trends and comparisons can be observed二、概述段在概述段中,考生需要对图表的主要特征和总体趋势进行概括性描述。
这有助于为后续的详细分析打下基础,同时也能让读者快速了解图表的核心内容。
比如:Overall, the data reveals a clear pattern 主要趋势或特点 1、Additionally, 主要趋势或特点 2、 However, there are also some exceptions or fluctuations, such as 特殊情况或波动三、主体段 1主体段是对图表数据进行详细分析和比较的部分。
在第一个主体段中,可以先聚焦于图表中的一个主要方面或数据组,并进行具体的描述和比较。
例如,如果是柱状图,可以描述某一组柱子的高度差异以及所代表的含义;如果是折线图,可以描述某一条折线的上升或下降趋势以及原因。
Looking at 数据组或方面 1, it is evident that 具体描述和比较 For instance, 举例说明 This indicates that 分析得出的结论四、主体段 2在第二个主体段,可以继续对另一个重要的数据组或方面进行类似的分析和比较,以确保涵盖图表中的关键信息。
雅思A类写作-图表写作模板
雅思A类写作-图表写作模板⼀.图表写作常⽤模板Para1. This is a table / chart / (line线状bar柱状pie饼状)graph which demonstrate / illustrate / reveal /depict /privide information about.............Para2. (1)Obvious /Apparent from the graph is that ...rank thefirst/highest,while/whereas ....turn out to be the lowest(2)It is exhibited/shown in the table that.....(3)It can be seen from the table that.....Para3.(1)饼.柱图A,which accounts for...%,ranks the first;then next is B with...%;followed by C,constituting...%;finally it comes D.E.F at...%...%and...%respectively(2)特殊变化(不变,增长或下降多的)①It is worth mentioning that....②It must be pointed out that....③More striking/surprising is that....Para4.To conclude /In conclusion/overall雅思写作图表作⽂标准化结构样本仅供参考Para 1, 两句话:第⼀句:This is a _____chart, which demonstrates the number of_____ from ____ to ____. 如果两个图,则:There are two charts below. The _____ chart describes the number of _____, and the _____ chart illustrates the figure of ____. 第⼆句:(所有题⽬适⽤),From the chart we can see that the number of ______ varies constantly/greatly in _____.Para 2, As we can see from the chart,/or It is clear from the chart that ____.如果有两个图:则:The _____ chart shows that ______./or As we can see from the first chart, _______Para 3, (如果两个图的话,) It is clear from the second chart that …Para 4 结尾:From the figures/statistics above, we can see/conclude/draw a conclusion that …⼆.应注意事项DON'T copy any part of the question in your answer. This is not your own work and therefore will be disregarded by the examiner and deducted from the word count. You can use individual words but be careful of using long "chunks" of the question text.Don't repeat yourself or the same ideas. This gives a bad impression and the examiner realises that it isn't adding to the content of your report.If you are weak at English grammar, try to use short sentences. This allows you to control the grammar and the meaning of your writing much more easily and contributes to a better cohesion and coherence mark. It's much easier to make things clear in a foreign language if you keep your sentences short!Think about the tenses of your verbs. If you're writing about something that happened in the past, your verbs will need to be in the past tenses. If you're describing the future, you will need to use the future tenses. If it's a habitual action, you'll need the present simple tense and so on. If you have time, a quick check of your verbs at the end of the exam can help you find errors. For describing graphs you will probably need past tenses whereas, for describing a process, you will probably need the present simple. Think about the verbs while practising and then it will become easier when you do the exam.As I just said, if you have finished the exam with time to spare, DON'T just sit there!! Check what you have done. If you have time after the check, check again. And so on……Don't be irrelevant. Although you can use your imagination to expand on your answer, if any part of your report is totally unrelated to the question and put in to just put up the word count, then the examiner will not take it into account and deduct it from the word count.If you want to improve, there's no secret. Practice. Practice. Practice. You won't get better sitting and doing nothing. Even good English users need practice for the IELTS exam. It could make all the difference between your getting the band that you need, and getting half a band less than you need and having to wait 3 months to do the exam again.三.写作范⽂雅思TASK1图表写作套句精选50句1.the table shows the changes in the number of...over the period from...to...该表格描述了在...年之...年间...数量的变化。
- 1、下载文档前请自行甄别文档内容的完整性,平台不提供额外的编辑、内容补充、找答案等附加服务。
- 2、"仅部分预览"的文档,不可在线预览部分如存在完整性等问题,可反馈申请退款(可完整预览的文档不适用该条件!)。
- 3、如文档侵犯您的权益,请联系客服反馈,我们会尽快为您处理(人工客服工作时间:9:00-18:30)。
雅思英语描述图表
1.我们能够从图表上看出:托雅的女生比例远远高于男生所占比例。
As can be seen from the chart, the percentage of female students was far higher than that of male students at Toya.
2.从图表反映的情况来看:读雅思的人数远远超过读托福的,同时,读托福的人数一直呈现平稳上升趋势。
As can be seen from the chart, those who chose to study for IELTS far outnumbered those choosing to study for TOEFL. Meanwhile,
the number of those who chose to study for TOEFL was on a steady rise.
3.从图表反映的情况来看:托雅学生在饭店用餐的频率在不同的月份呈现出了相应的波动趋势。
As can be seen from the diagram, the frequency of Toya students eating at restaurants revealed a trend of fluctuations in different months.
4.从图表反映的情况来看:托雅男教师所承担的每周工作量要高于女教师的。
As can be seen from the charts, the weekly workload borne by male teachers
outweighed that of female teachers at Toya.
5.从整个图表反映的情况来看:托雅总部以及五个分校的营业收入都呈现出了快速的增长趋势。
As can be seen from the chart, the sales of Toya Headquarter and the five branch schools all revealed a trend of fast increase across the board.
6.从整个图表反映的情况来看:托雅教师的收入状况呈现出了稳步增长的总态势。
As can be seen from the chart, the income of Toya teachers revealed a general trend of steady rise.
7.图表显示:托雅广告投入呈现出逐渐下降的趋势,然而有趣的是,营业收入却呈现出大幅度的攀升。
As can be seen from the chart, the advertising investment of Toya revealed a trend of gradual decrease, but interestingly, its sales witnessed a trend of increase by leaps and bounds.。