微观经济学原理曼昆英文第七章
曼昆微观经济学课后练习英文答案(第七章)
✍ how to define and measure consumer surplus.✍ the link between sellers’ costs of producing a good and the supply curve.✍ how to define and measure producer surplus.✍ that the equilibrium of supply and demand maximizes total surplus in a market. CONTEXT AND PURPOSE:Chapter 7 is the first chapter in a three-chapter sequence on welfare economics and market efficiency. Chapter 7 employs the supply and demand model to develop consumer surplus and producer surplus as a measure of welfare and market efficiency. These concepts are then utilized in Chapters 8 and 9 to determine the winners and losers from taxation and restrictions on international trade.The purpose of Chapter 7 is to develop welfare economics—the study of how the allocation of resources affects economic well-being. Chapters 4 through 6 employed supply and demand in a positive framework, which focused on the question, “What is the equilibrium price and quantity in a market?” This chapter now addresses the normative question, “Is the equilibrium price and quantity in a market the best possible solution to the resource allocation problem, or is it simply the price and quantity that balance supply and demand?” Students will discover that under most circumstances the equilibrium price and quantity is also the one that maximizes welfare.KEY POINTS:? Consumer surplus equals buyers’ willingness to pay for a good minus the amount they actually pay for it, and it measures the benefit buyers get from participating in a market.Consumer surplus can be computed by finding the area below the demand curve and above the price.? Producer surplus equals the amount sellers receive for their goods minus their costs of production, and it measures the benefit sellers get from participating in a market. Producer surplus can be computed by finding the area below the price and above the supply curve.? An allocation of resources that maximizes the sum of consumer and producer surplus is said to be efficient. Policymakers are often concerned with the efficiency, as well as the equality, of economic outcomes.? The equilibrium of supply and demand maximizes the sum of consumer and producer surplus.That is, the invisible hand of the marketplace leads buyers and sellers to allocate resources efficiently.? Markets do not allocate resources efficiently in the presence of market failures such as market power or externalities.CHAPTER OUTLINE:I. Definition of welfare economics: the study of how the allocation of resources affects economic well-being.A. Willingness to Pay1. Definition of willingness to pay: the maximum amount that a buyer will pay for a good.2. Example: You are auctioning a mint-condition recording of Elvis Presley’s first album. Four buyers show up. Their willingness to pay is as follows:for John. Because John is willing to pay more than he has to for the album,he derives some benefit from participating in the market.3. Definition of consumer surplus: the amount a buyer is willing to pay for a good minus the amount the buyer actually pays for it.4. Note that if you had more than one copy of the album, the price in the auction would end up being lower (a little over $70 in the case of two albums) and both John and Paul would gain consumer surplus.B. Using the Demand Curve to Measure Consumer Surplus1. We can use the information on willingness to pay to derive a demand curve for the rare2. . Because the demand curve shows the buyers’ willingness to pay, we can use the demand curve to measure consumer surplus.C. How a Lower Price Raises Consumer Surplusare paying less for the product than before (area A on the graph).b. Because the price is now lower, some new buyers will enter the market and receive consumer surplus on these additional units of output purchased (area B on the graph).D. What Does Consumer Surplus Measure?1. Remember that consumer surplus is the difference between the amount that buyers are willing to pay for a good and the price that they actually pay.2. Thus, it measures the benefit that consumers receive from the good as the buyers themselves perceive it.III. Producer SurplusA. Cost and the Willingness to Sell1. Definition of cost: the value of everything a seller must give up to produce a good .2. Example: You want to hire someone to paint your house. You accept bids for the work from four sellers. Each painter is willing to work if the price you will pay exceeds her opportunity cost. (Note that this opportunity cost thus represents willingness to sell.) The costs are: ALTERNATIVE CLASSROOM EXAMPLE:Review the material on price ceilings from Chapter 6. Redraw the market for two-bedroom apartments in your town. Draw in a price ceiling below the equilibriumprice.Then go through:✍ consumer surplus before the price ceiling is put into place.✍ consumer surplus after the price ceiling is put into place.You will need to take some time to explain the relationship between the producers’ willingness to sell and the cost of producing the good. The relationship between cost and the supply curve is not as apparent as the relationship between the demand curve and willingness to pay. It is important to stress that consumer surplus is measured in monetary terms. Consumer surplus gives us a way to place a monetary cost on inefficient market outcomes (due to government involvement or market failure).except for Grandma. Because Grandma receives more than she would require to paint the house, she derives some benefit from producing in the market.4.Definition of producer surplus: the amount a seller is paid for a good minus the seller’s cost of providing it.5. Note that if you had more than one house to paint, the price in the auction would end up being higher (a little under $800 in the case of two houses) and both Grandma and Georgia would gain producer surplus.B. Using the Supply Curve to Measure Producer Surplus1. We can use the information on cost (willingness to sell) to derive a supply curve for2. marginal seller . Because the supply curve shows the sellers’ cost (willingness to sell), we can use the supply curve to measure producer surplus.are receiving more for the product than before (area C on the graph).b. Because the price is now higher, some new sellers will enter the market and receive producer surplus on these additional units of output sold (area D on the graph).D. Producer surplus is used to measure the economic well-being of producers, much like consumer surplus is used to measure the economic well-being of consumers.ALTERNATIVE CLASSROOM EXAMPLE:Review the material on price floors from Chapter 6. Redraw the market for anagricultural product such as corn. Draw in a price support above the equilibriumprice.Then go through:✍ producer surplus before the price support is put in place.✍ producer surplus after the price support is put in place.Make sure that you discuss the cost of the price support to taxpayers.IV.Market EfficiencyA. The Benevolent Social Planner1. The economic well-being of everyone in society can be measured by total surplus, which is the sum of consumer surplus and producer surplus:Total Surplus = Consumer Surplus + Producer SurplusTotal Surplus = (Value to Buyers – Amount Paid by Buyers) +(Amount Received by Sellers – Cost to Sellers)Because the Amount Paid by Buyers = Amount Received bySellers:2. Definition of efficiency: the property of a resource allocation of maximizing the total surplus received by all members of society .3. Definition of equality: the property of distributing economic prosperity uniformly the members of society .a. Buyers who value the product more than the equilibrium price will purchase the product; those who do not, will not purchase the product. In other words, the free market allocates the supply of a good to the buyers who value it most highly, as measured by their willingness to pay.b. Sellers whose costs are lower than the equilibrium price will produce the product; those whose costs are higher, will not produce the product. In other words, the free market allocates the demand for goods to the sellers who can produce it at the lowest cost.to the marginal buyer is greater than the cost to the marginal seller so total surplus would rise if output increases.b. At any quantity of output greater than the equilibrium quantity, the value of the product to the marginal buyer is less than the cost to the marginal seller so total surplus would rise if output decreases.3. Note that this is one of the reasons that economists believe Principle #6: Markets are usually a good way to organize economic activity.It would be a good idea to remind students that there are circumstances whenthe market process does not lead to the most efficient outcome. Examplesinclude situations such as when a firm (or buyer) has market power over priceor when there are externalities present. These situations will be discussed inlater chapters.Pretty Woman, Chapter 6. Vivien (Julia Roberts) and Edward (Richard Gere)negotiate a price. Afterward, Vivien reveals she would have accepted a lowerprice, while Edward admits he would have paid more. If you have done a goodjob of introducing consumer and producer surplus, you will see the light bulbsgo off above your students’ heads as they watch this clip.C. In the News: Ticket Scalping1. Ticket scalping is an example of how markets work to achieve an efficient outcome.2. This article from The Boston Globe describes economist Chip Case’s experience with ticket scalping.D. Case Study: Should There Be a Market in Organs?1. As a matter of public policy, people are not allowed to sell their organs.a. In essence, this means that there is a price ceiling on organs of $0.b. This has led to a shortage of organs.2. The creation of a market for organs would lead to a more efficient allocation of resources, but critics worry about the equity of a market system for organs.V. Market Efficiency and Market FailureA. To conclude that markets are efficient, we made several assumptions about how markets worked.1. Perfectly competitive markets.2. No externalities.B. When these assumptions do not hold, the market equilibrium may not be efficient.C. When markets fail, public policy can potentially remedy the situation. SOLUTIONS TO TEXT PROBLEMS:Quick Quizzes1. Figure 1 shows the demand curve for turkey. The price of turkey is P1 and the consumer surplus that results from that price is denoted CS. Consumer surplus is the amount a buyer is willing to pay for a good minus the amount the buyer actually pays for it. It measures the benefit to buyers of participating in a market.Figure 1 Figure 22. Figure 2 shows the supply curve for turkey. The price of turkey is P1 and the producer surplus that results from that price is denoted PS. Producer surplus is the amount sellers are paid for a good minus the sellers’ cost of providing it (measured by the supply curve). It measures the benefit to sellers of participating in a market.Figure 33. Figure 3 shows the supply and demand for turkey. The price of turkey is P1, consumer surplus is CS, and producer surplus is PS. Producing more turkeys than the equilibrium quantity would lower total surplus because the value to the marginal buyer would be lower than the cost to the marginal seller on those additional units.Questions for Review1. The price a buyer is willing to pay, consumer surplus, and the demand curve are all closely related. The height of the demand curve represents the willingness to pay of the buyers. Consumer surplus is the area below the demand curve and above the price, which equals the price that each buyer is willing to pay minus the price actually paid.2. Sellers' costs, producer surplus, and the supply curve are all closely related. The height of the supply curve represents the costs of the sellers. Producer surplus is the area below the price and above the supply curve, which equals the price received minus each seller's costs of producing the good.Figure 43. Figure 4 shows producer and consumer surplus in a supply-and-demand diagram.4. An allocation of resources is efficient if it maximizes total surplus, the sum of consumer surplus and producer surplus. But efficiency may not be the only goal of economic policymakers; they may also be concerned about equity the fairness of the distribution of well-being.5. The invisible hand of the marketplace guides the self-interest of buyers and sellers into promoting general economic well-being. Despite decentralized decision making and self-interested decision makers, free markets often lead to an efficient outcome.6. Two types of market failure are market power and externalities. Market power may cause market outcomes to be inefficient because firms may cause price and quantity to differ from the levels they would be under perfect competition, which keeps total surplus from being maximized. Externalities are side effects that are not taken into account by buyers and sellers. As a result, the free market does not maximize total surplus.Problems and Applications1. a. Consumer surplus is equal to willingness to pay minus the price paid. Therefore, Melissa’s willingness to pay must be $200 ($120 + $80).b. Her consumer surplus at a price of $90 would be $200 ? $90 = $110.c. If the price of an iPod was $250, Melissa would not have purchased one because the price is greater than her willingness to pay. Therefore, she would receive no consumer surplus.2. If an early freeze in California sours the lemon crop, the supply curve for lemons shifts to the left, as shown in Figure 5. The result is a rise in the price of lemons and a decline in consumer surplus from A + B + C to just A. So consumer surplus declines by the amount B + C.Figure 5 Figure 6In the market for lemonade, the higher cost of lemons reduces the supply of lemonade, as shown in Figure 6. The result is a rise in the price of lemonade and a decline in consumer surplus from D + E + F to just D, a loss of E + F. Note that an event that affects consumer surplus in one market often has effects on consumer surplus in other markets.3. A rise in the demand for French bread leads to an increase in producer surplus in the market for French bread, as shown in Figure 7. The shift of the demand curve leads to an increased price, which increases producer surplus from area A to area A + B + C.Figure 7The increased quantity of French bread being sold increases the demand for flour, as shown in Figure 8. As a result, the price of flour rises, increasing producer surplus from area Dto D + E + F. Note that an event that affects producer surplus in one market leads to effects on producer surplus in related markets.Figure 84. a.Figure 9b. When the price of a bottle of water is $4, Bert buys two bottles of water. His consumer surplus is shown as area A in the figure. He values his first bottle of water at $7, but pays only $4 for it, so has consumer surplus of $3. He values his second bottle of water at $5, but pays only $4for it, so has consumer surplus of $1. Thus Bert’s total consumer surplus is $3 + $1 = $4, which is the area of A in the figure.c. When the price of a bottle of water falls from $4 to $2, Bert buys three bottles of water, an increase of one. His consumer surplus consists of both areas A and B in the figure, an increase in the amount of area B. He gets consumer surplus of $5 from the first bottle ($7 value minus $2 price), $3 from the second bottle ($5 value minus $2 price), and $1 from the third bottle ($3 value minus $2 price), for a total consumer surplus of $9. Thus consumer surplus rises by $5 (which is the size of area B) when the price of a bottle of water falls from $4 to $2.5. a.Figure 10b. When the price of a bottle of water is $4, Ernie sells two bottles of water. His producer surplus is shown as area A in the figure. He receives $4 for his first bottle of water, but it costs only $1 to produce, so Ernie has producer surplus of $3. He also receives $4 for his second bottle of water, which costs $3 to produce, so he has producer surplus of $1. Thus Ernie’s total producer surplus is $3 + $1 = $4, which is the area of A in the figure.c. When the price of a bottle of water rises from $4 to $6, Ernie sells three bottles of water, an increase of one. His producer surplus consists of both areas A and B in the figure, an increase by the amount of area B. He gets producer surplus of $5 from the first bottle ($6 price minus $1 cost), $3 from the second bottle ($6 price minus $3 cost), and $1 from the third bottle ($6 price minus $5 price), for a total producer surplus of $9. Thus producer surplus rises by $5 (which is the size of area B) when the price of a bottle of water rises from $4 to $6.6. a. From Ernie’s supply schedule and Bert’s demand schedule, the quantityequilibrium quantity of two.b. At a price of $4, consumer surplus is $4 and producer surplus is $4, as shown in Problems 3 and 4 above. Total surplus is $4 + $4 = $8.c. If Ernie produced one less bottle, his producer surplus would decline to $3, as shown in Problem 4 above. If Bert consumed one less bottle, his consumer surplus would decline to $3, as shown in Problem 3 above. So total surplus would decline to $3 + $3 = $6.d. If Ernie produced one additional bottle of water, his cost would be $5, but the price is only $4, so his producer surplus would decline by $1. If Bert consumed one additional bottle of water, his value would be $3, but the price is $4, so his consumer surplus would decline by $1. So total surplus declines by $1 + $1 = $2.7. a. The effect of falling production costs in the market for stereos results in a shift to the right in the supply curve, as shown in Figure 11. As a result, the equilibrium price of stereos declines and the equilibrium quantity increases.Figure 11b. The decline in the price of stereos increases consumer surplus from area A to A + B + C + D, an increase in the amount B + C + D. Prior to the shift in supply, producer surplus was areas B + E (the area above the supply curve and below the price). After the shift in supply, producer surplus is areas E + F + G. So producer surplus changes by the amount F + G – B, which may be positive or negative. The increase in quantity increases producer surplus, while the decline in the price reduces producer surplus. Because consumer surplus rises by B + C + D and producer surplus rises by F + G – B, total surplus rises by C + D + F + G.c. If the supply of stereos is very elastic, then the shift of the supply curve benefits consumers most. To take the most dramatic case, suppose the supply curve were horizontal, as shown in Figure 12. Then there is no producer surplus at all. Consumers capture all the benefits of falling production costs, with consumer surplus rising from area A to area A + B.Figure 128. Figure 13 shows supply and demand curves for haircuts. Supply equals demand at a quantity of three haircuts and a price between $4 and $5. Firms A, C, and D should cut the hair of Ellen, Jerry, and Phil. Oprah’s willingness to pay is too low and firm B’s costs are too high, so they do not participate. The maximum total surplus is the area between the demand and supply curves, which totals $11 ($8 value minus $2 cost for the first haircut, plus $7 value minus $3 cost for the second, plus $5 value minus $4 cost for the third).Figure 139. a. The effect of falling production costs in the market for computers results in a shift to the right in the supply curve, as shown in Figure 14. As a result, the equilibrium price of computers declines and the equilibrium quantity increases. The decline in the price of computers increases consumer surplus from area A to A + B + C + D, an increase in the amount B + C + D.Figure 14 Figure 15Prior to the shift in supply, producer surplus was areas B + E (the area above thesupply curve and below the price). After the shift in supply, producer surplus isareas E + F + G. So producer surplus changes by the amount F + G – B, whichmay be positive or negative. The increase in quantity increases producer surplus,while the decline in the price reduces producer surplus. Because consumer surplusrises by B + C + D and producer surplus rises by F + G – B, total surplus rises byC +D + F + G.b. Because typewriters are substitutes for computers, the decline in the price of computers means that people substitute computers for typewriters, shifting the demand for typewriters to the left, as shown in Figure 15. The result is a decline in both the equilibrium price and equilibrium quantity of typewriters. Consumer surplus in the typewriter market changes from area A + B to A + C, a net change of C – B. Producer surplus changes from area C + D + E to area E, a net loss of C + D. Typewriter producers are sad about technological advances in computers because their producer surplus declines.c. Because software and computers are complements, the decline in the price and increase in the quantity of computers means that the demand for software increases, shifting the demand for software to the right, as shown in Figure 16. The result is an increase in both the price and quantity of software. Consumer surplus in the software market changes from B + C to A + B, anet change of A – C. Producer surplus changes from E to C + D + E, an increase of C + D, so software producers should be happy about the technological progress in computers.Figure 16d. Yes, this analysis helps explain why Bill Gates is one the world’s richest people, because his company produces a lot of software that is a complement with computers and there has been tremendous technological advance in computers.10. a. With Provider A, the cost of an extra minute is $0. With Provider B, the cost of anextra minute is $1.b. With Provider A, my friend will purchase 150 minutes [= 150 – (50)(0)]. WithProvider B, my friend would purchase 100 minutes [= 150 – (50)(1)].c. With Provider A, he would pay $120. The cost would be $100 with Provider B.Figure 17d. Figure 17 shows the friend’s demand. With Provider A, he buys 150 minutes andhis consumer surplus is equal to (1/2)(3)(150) – 120 = 105. With Provider B, hisconsumer surplus is equal to (1/2)(2)(100) = 100.e. I would recommend Provider A because he receives greater consumer surplus.11. a. Figure 18 illustrates the demand for medical care. If each procedure has a price of $100, quantity demanded will be Q1 procedures.Figure 18b. If consumers pay only $20 per procedure, the quantity demanded will be Q2 procedures. Because the cost to society is $100, the number of procedures performed is too large to maximize total surplus. The quantity that maximizes total surplus is Q1 procedures, which is less than Q2.c. The use of medical care is excessive in the sense that consumers get procedures whose value is less than the cost of producing them. As a result, the economy’s total surplus is reduced.d. To prevent this excessive use, the consumer must bear the marginal cost of the procedure. But this would require eliminating insurance. Another possibility would be that the insurance company, which pays most of the marginal cost of the procedure ($80, in this case) could decide whether the procedure should be performed. But the insurance company does not get the benefits of the procedure, so its decisions may not reflect the value to the consumer.。
微观经济学-曼昆英文版本

A Firm’s Long-Run Decision to Exit
• Cost of exiting the market: revenue loss = TR
• Benefit of exiting the market: cost savings = TC (zero FC in the long run) • So, firm exits if TR < TC
Because of 1 & 2, each buyer and seller is a
“price taker” – takes the price as given.
The Revenue of a Competitive Firm
• Total revenue (TR)
• Average revenue (AR)
Qa Q 1 Qb
Q
MC and the Firm’s Supply Decision
If price rises to P2, then the profitmaximizing quantity rises to Q2.
Costs MC P2 MR2 MR
The MC curve determines the firm’s Q at any price. P1 Hence,
Introduction: A Scenario
• Three years after graduating, you run your own business. • You must decide how much to produce, what price to charge, how many workers to hire, etc. • What factors should affect these decisions?
曼昆《经济学原理(微观经济学分册)》课后习题详解(第7篇)【圣才出品】
曼昆《经济学原理(微观经济学分册)》课后习题详解(第7篇)【圣才出品】第7篇深⼊研究的论题第21章消费者选择理论⼀、概念题1.预算约束线(budget constraint )答:预算约束线⼜称消费可能线和价格线,指对消费者可以承受(在消费者收⼊和消费者希望购买的物品价格既定时)的消费组合的限制。
预算约束线表⽰消费者⽀付得起的消费组合。
假定以I 表⽰消费者的既定收⼊,以P 1和P 2分别表⽰商品1和商品2的价格,以X 1和X 2分别表⽰商品1和商品2的数量,那么,相应的预算等式为:P 1X 1+P 2X 2=I 。
上式表⽰:消费者的全部收⼊等于他购买商品1和商品2的总⽀出。
⽽且,可以⽤1I P 和2I P 来分别表⽰全部收⼊仅购买商品1或商品2的数量,它们分别表⽰预算约束线的横截距和纵截距。
此外,上式还可以改写成如下形式:12122P I X X P P =?+。
式中的预算约束线⽅程表明,预算约束线的斜率为12P P ?,纵截距为2I P 。
2.⽆差异曲线(indifference curve )答:⽆差异曲线指带给消费者相同满⾜程度的消费组合的⼀条曲线。
它表⽰消费者在⼀定偏好、⼀定技术条件和⼀定资源条件下选择商品时,对不同组合商品的满⾜程度是没有区别的。
与⽆差异曲线相对应的效⽤函数为:U =f (X 1,X 2)。
其中,X 1、X 2分别为商品1和商品2的消费数量;U 是常数,表⽰某个效⽤⽔平。
由于⽆差异曲线表⽰的是序数效⽤,所以,这⾥的U 只需表⽰某⼀个效⽤⽔平,⽽不在乎其具体数值的⼤⼩。
有的西⽅经济学者称这种效⽤⽔平为效⽤指数。
⽆差异曲线可以表⽰为图21-1所⽰。
在⼀个坐标系内,⽆差异曲线有⽆数条,图21-2中显⽰的只是其中的三条。
图中的横轴表⽰商品1的数量X1,纵轴表⽰商品2的数量X2,I、I′、I″分别代表三条⽆差异曲线。
图中的每⼀条⽆差异曲线上的任何⼀点,如⽆差异曲线I″上的A、B、C、D、E 和F点所代表的商品组合给消费者带来的效⽤⽔平都是相等的。
微观经济学 第七章-推荐下载
CHAPTER 7: Production and GrowthI.Economic Growth around the WorldA.Table 1 shows data on real GDP per capita in 1960 and 2007 among different countries.1.What does the data tell us about the living standards between these countries?2.Which country has the largest growth rates on average? What is the effect ofcompounding on the process of economic growth? Apply the rule of 70.3.Because of different growth rates, the ranking of countries by income per personchanges substantially over time. Are poor countries doomed to poverty forever? II. Productivity: Its Role and DeterminantsA.Why Productivity Is So Important?1.Definition of productivity: the amount of goods and services producedfor each hour of a worker’s time.2.Review of Principle #8: A Country’s Standard of Living Depends on Its Ability toProduce Goods and Services.B.How Productivity Is Determined1.Physical Capital per WorkerDefinition of physical capital: the stock of equipment and structures thatare used to produce goods and services.2.Human Capital per WorkerDefinition of human capital: the knowledge and skills that workersacquire through education, training, and experience.3.Natural Resources per Workera.Definition of natural resources: the inputs into the production ofgoods and services that are provided by nature, such as land, rivers,and mineral deposits.b.Are Natural Resources a Limit to Growth?4.Technological KnowledgeDefinition of technological knowledge: society’s understanding of thebest ways to produce goods and services.C.The Production Function1. A production function describes the relationship between the quantity of inputsused in production and the quantity of output from production.2.The production function generally is written like this:Y = A F(L, K, H, N)where Y = output, L = quantity of labour, K = quantity of physical capital, H =quantity of human capital, N = quantity of natural resources, A reflects theavailable production technology, and F( ) is a function that shows how inputs arecombined to produce output.3.Constant returns to scalea.This property implies that as all inputs are doubled, output will exactlydouble.b.This implies that the following must be true:x Y = A F(xL, xK, xH, xN)Where x =2 if inputs are doubled. What about only if labour is doubled?Would output double as well?c.This also means that if we want to examine output per worker, we couldset x = 1/L and we would get the following:Y/L = A F(1, K/L, H/L, N/L)This shows that output per worker depends on the amount of physicalcapital per worker (K/L), the amount of human capital per worker (H/L),and the amount of natural resources per worker (N/L).d.This chapter discusses how employment has declined relative to outputin the farm sector. Can you think of another sector of the economywhere the same phenomenon has occurred more recently? Would youconsider the change in employment a success or failure from thestandpoint of society as a whole?III.Economic Growth and Public PolicyA.The Importance of Saving and Investment1.Investment is funded by saving. How do we increase saving today?2.What is an opportunity cost of producing more capital goods?3.Figure 7.1 shows how the amount of capital per worker influences the amount ofoutput per worker. The curve becomes flatter as the amount of capital increasesand why?B.Diminishing Returns and the Catch-Up Effect1.Definition of diminishing returns: the property whereby the benefit froman extra unit of an input declines as the quantity of the input increases.2.An important implication of diminishing returns is the Catch-Up Effect.a.Definition of catch-up effect: the property whereby countries thatstart off poor tend to grow more rapidly than countries thatstart off rich.b. A puzzle: The share of GDP devoted to investment was similar forCanada and South Korea (about 23%) over the past 40 years. However,South Korea had a 6 percent growth rate of average annual income,while Canada had only a 2 percent growth rate over that past 40 years.How can this be explained?C.Investment from Abroad1.Saving by domestic residents is not the only way for a country to invest in newcapital.2.Investment in the country by foreigners can also occur.a.Foreign direct investment occurs when a capital investment is ownedand operated by a foreign entity.b.Foreign portfolio investment occurs when a capital investment isfinanced with foreign money but operated by domestic residents.3.Some of the benefits of foreign investment flow back to foreign owners in theform of profits. How does foreign investment benefit our economy?cation1.What is the opportunity cost of investing in human capital?2.What is a “brain drain”? Many poor countries and rich countries as well face abrain drain and why?E.Property Rights and Political Stability1.There is little incentive to produce products if there is no guarantee that theycannot be taken.2.Countries with questionable enforcement of property rights or an unstablepolitical climate will also have difficulty in attracting foreign (or even domestic)investment.F.Free Trade1. Trade allows a country to specialize in what it does best and thus consumebeyond its production possibilities.2.Most countries including Canada import substantial amount of goods andservices from other countries. Yet this chapter says that a nation can enjoy ahigher standard of living only if it can produce a large quantity of goods andservices. Can you reconcile these two facts?G.Research and Development1.The primary reason why living standards have improved over time has been dueto large increases in technological knowledge.2.The Canadian government promotes the creation of new technologicalinformation by providing research grants and providing tax incentives for firmsengaged in research.3.The patent system also encourages research by granting an inventor theexclusive right to produce the product for a specified number of years.H.Population Growth1. Stretching Natural Resourcesa.2oo years ago, Thomas Malthus (an English minister and early economicthinker) argued that an ever-increasing population meant that the worldwas doomed to live in poverty forever. Was he right?b.Many critics argue that population growth is depleting the Earth’snonrenewable resources and, therefore, places a limit on the growth inliving standards. But technological progress often yields ways to avoidthese limits. For example, the invention of hybrid cars reduces the use ofgas, or better insulating homes reduces the energy required to heat orcool them. The scarcer a resource is, the higher the market price whichprovides incentive to conserve it and develop alternatives.2.Diluting the Capital Stocka.High population growth reduces GDP per worker because rapid growth inthe number of workers forces the capital stock to be spread more thinly.b.Countries with a high population growth have large numbers of school-age children, placing a burden on the education system.c.Some countries have already instituted measures to reduce populationgrowth rates, for example, regulating the number of children (e.g., China)and fostering equal treatment for women which raises economicopportunities for women leading to lower rates of population (e.g., India).3.Promoting Technological Progressa.Some economists have suggested that population growth has driventechnological progress and economic prosperity.b.More people implies more scientists, more inventors, and moreengineers.G. QuestionThe catch-up effect says that countries with low income can grow faster thancountries with higher income. However, in statistical studies that include manydiverse countries we do not observe the catch-up-effect unless we control forother variables that affect productivity. Considering the determinants ofproductivity, list and explain some things that would tend to prohibit or limit apoor country's ability to catch up with the rich ones.。
微观经济学原理(第七版)-曼昆-名词解释(带英文)
微观经济学原理曼昆名词解释稀缺性(scarcity):社会资源的有限性。
经济学(economics):研究社会如何管理自己的稀缺资源。
效率(efficiency):社会能从其稀缺资源中得到最多东西的特性。
平等(equality):经济成果在社会成员中公平分配的特性.机会成本(opportunity cost):为了得到某种东西所必须放弃的东西。
理性人(rational people):系统而有目的地尽最大努力实现起目标的人.边际变动(marginal change):对行动计划微小的增量调整。
激励(incentive):引起一个人做出某种行为的某种东西.市场经济(market economy):当许多企业和家庭在物品与劳务市场上相互交易时,通过他们的分散决策配置资源的经济。
产权(property rights):个人拥有并控制稀缺资源的能力.市场失灵(market failure):市场本身不能有效配置资源的情况。
外部性(externality):一个人的行为对旁观者福利的影响。
市场势力(market power):一个经济活动者(或经济活动者的一个小集团)对市场价格有显著影响的能力.生产率(productivity):一个工人一小时所生产的物品与劳务量.通货膨胀(inflation):经济中物价总水平的上升。
经济周期(business cycle):就业和生产等经济活动的波动(就是生产这类经济活动的波动。
)循环流向图(circular—flow diagram):一个说明货币如何通过市场在家庭与企业之间流动的直观经济模型。
生产可能性边界(production possibilities frontier):表示一个经济在可得到的生产要素与生产技术既定时所能生产的产量的各种组合的图形。
微观经济学(microeconomics):研究家庭和企业如何做出决策,以及它们在市场上的相互交易。
宏观经济学(macroeconomics):研究整体经济现象,包括通货膨胀、失业和经济增长。
曼昆经济学原理课后答案第七章消费者、生产者与市场效率
复习题1.解释买者的支付意愿、消费者剩余和需求曲线如何相关。
答:需求曲线反映了买者的支付意愿。
在任何一种数量时,需求曲线给出的价格表示边际买者的支付意愿。
需求曲线以下和价格以上的总面积是一种物品或劳务市场上所有买者消费者剩余的总和。
2.解释卖者的成本、生产者剩余和供给曲线如何相关。
36答:供给曲线的高度与卖者的成本相关。
在任何一种数量时,供给曲线给出的价格表示边际卖者的成本。
价格之下和供给曲线以上的面积衡量市场的生产者剩余。
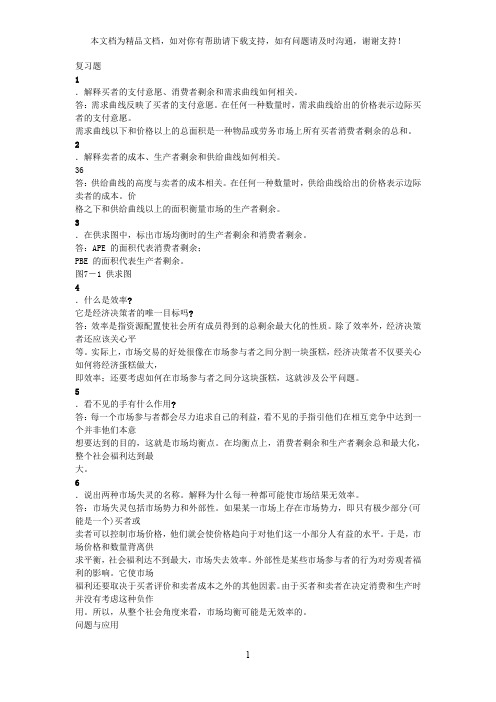
3.在供求图中,标出市场均衡时的生产者剩余和消费者剩余。
答:APE 的面积代表消费者剩余;PBE 的面积代表生产者剩余。
图7-1 供求图4.什么是效率?它是经济决策者的唯一目标吗?答:效率是指资源配置使社会所有成员得到的总剩余最大化的性质。
除了效率外,经济决策者还应该关心平等。
实际上,市场交易的好处很像在市场参与者之间分割一块蛋糕,经济决策者不仅要关心如何将经济蛋糕做大,即效率;还要考虑如何在市场参与者之间分这块蛋糕,这就涉及公平问题。
5.看不见的手有什么作用?答:每一个市场参与者都会尽力追求自己的利益,看不见的手指引他们在相互竞争中达到一个并非他们本意想要达到的目的,这就是市场均衡点。
在均衡点上,消费者剩余和生产者剩余总和最大化,整个社会福利达到最大。
6.说出两种市场失灵的名称。
解释为什么每一种都可能使市场结果无效率。
答:市场失灵包括市场势力和外部性。
如果某一市场上存在市场势力,即只有极少部分(可能是一个)买者或卖者可以控制市场价格,他们就会使价格趋向于对他们这一小部分人有益的水平。
于是,市场价格和数量背离供求平衡,社会福利达不到最大,市场失去效率。
外部性是某些市场参与者的行为对旁观者福利的影响。
它使市场福利还要取决于买者评价和卖者成本之外的其他因素。
由于买者和卖者在决定消费和生产时并没有考虑这种负作用。
所以,从整个社会角度来看,市场均衡可能是无效率的。
问题与应用1.Melissa用120美元购买了一个iPod,并得到了80美元的消费者剩余。
曼昆微观经济学英文版07consumers_producers
Copyright © 2004 South-Western
பைடு நூலகம்
Welfare Economics
• Consumer surplus measures economic welfare from the buyer’s side. • Producer surplus measures economic welfare from the seller’s side.
Copyright © 2004 South-Western
Table 1 Four Possible Buyers’ Willingness to Pay
Copyright©2004 South-Western
CONSUMER SURPLUS
• The market demand curve depicts the various quantities that buyers would be willing and able to purchase at different prices.
Copyright © 2004 South-Western
The Demand Schedule and the Demand Curve
Copyright © 2004 South-Western
Figure 1 The Demand Schedule and the Demand Curve
Figure 6 How the Price Affects Producer Surplus
(a) Producer Surplus at Price P Price Supply
P1
B Producer surplus C
A
0 Q1 Quantity
曼昆微观经济学经济学十大原理 英文版
1
CHAPTER
1
Ten Principles of Economics (经济学十大原理)
Economics
PRINCIPLES OF
N. Gregory Mankiw
© 2015 CUFE
In this chapter, look for the answers to these questions:
边际是高等数学微分的概念;理性人决策:边际收益>边际成
本(Do);边际收益<边际成本(Undo)
13
HOW PEOPLE MAKE DECISIONS
Principle #3: 理性人考虑边际量
Rational People Think at the Margin Exampconsiders whether to go to
HOW PEOPLE MAKE DECISIONS
Principle #2: 某种东西的成本是为了得到它而放弃的东西
The Cost of Something Is What You Give Up to Get It
Making decisions requires comparing the costs and
7
Society faces an important tradeoff:
HOW PEOPLE MAKE DECISIONS Principle #1: 人们面临权衡取舍
效率 (efficiency) vs. 平等 (equality)
Efficiency: 社会能从稀缺资源获得最大利益的特性 . when
college for an additional year, he compares the fees & foregone wages to the extra income he could earn with the extra year of education.
微观经济学原理第七版曼昆名词解释带英文
微观经济学原理曼昆名词解释1.需求价格弹性price elasticity of demand:2.蛛网模型:对于生产周期较长的商品供给的时滞性,需求的不是动态模型分类,画图3.边际效用递减diminishing marginal utility——基数效用论不违反边际效用递减规律;因为边际效用是指物品的消费量每增加或减少一个单位所增加或减少的总效用的量;这里的“单位”是指一完整的商品单位,这种完整的商品单位,是边际效用递减规律有效性的前提;比如,这个定律适用于一双的鞋子,但不适用于单只的鞋子;对于四轮车而言,必须是有四个轮子的车才成为一单位;三个轮子不能构成一辆四轮车,因而每个轮子都不是一个有效用的物品,增加一个轮子,才能使车子有用;因此,不能说第四个轮子的边际效用超过第三个轮子4.无差异曲线indifference curve:一条表示给消费者相同满足程度的消费组合的曲线;2特征:凸向原点越远越大不相交5.边际替代率marginal rate of :——序数效用论6.预算线Budget line/ budget constraint7.吉芬物品Giffen good:价格上升引起需求量增加的物品;8.柯布道格拉斯生产函数稀缺性scarcity:社会资源的有限性;经济学economics:研究社会如何管理自己的稀缺资源;效率efficiency:社会能从其稀缺资源中得到最多东西的特性;平等equality:经济成果在社会成员中公平分配的特性;机会成本opportunity cost:为了得到某种东西所必须放弃的东西;理性人rational people:系统而有目的地尽最大努力实现起目标的人; 边际变动marginal change:对行动计划微小的增量调整;激励incentive:引起一个人做出某种行为的某种东西;市场经济market economy:当许多企业和家庭在物品与劳务市场上相互交易时,通过他们的分散决策配置资源的经济;产权property rights:个人拥有并控制稀缺资源的能力;市场失灵market failure:市场本身不能有效配置资源的情况;外部性externality:市场势力market power:一个经济活动者或经济活动者的一个小集团对市场价格有显着影响的能力;生产率productivity:一个工人一小时所生产的物品与劳务量;通货膨胀inflation:经济中物价总水平的上升;经济周期business cycle:就业和生产等经济活动的波动就是生产这类经济活动的波动;循环流向图circular-flow diagram:一个说明货币如何通过市场在家庭与企业之间流动的直观经济模型;生产可能性边界production possibilities frontier:表示一个经济在可得到的生产要素与生产技术既定时所能生产的产量的各种组合的图形;微观经济学microeconomics:研究家庭和企业如何做出决策,以及它们在市场上的相互交易;宏观经济学macroeconomics:研究整体经济现象,包括通货膨胀、失业和经济增长; 实证表述positive statements:企图描述世界是什么的观点;规范描述normative statements:企图描述世界应该如何运行的观点;绝对优势absolute advantage:根据生产率比较一种物品的生产者;比较优势comparative advantage :根据机会成本比较一种物品的生产者;进口品imports:国外生产而在国内销售的物品;出口品exports:国内生产而在国外销售的物品;市场market:由某种物品或劳务的买者与卖者组成的一个群体;竞争市场competitive market :有许多买者与卖者,以致于每个人对市场价格的影响都微乎其微的市场;需求量quantity demanded:买者愿意而且能够购买的一种物品量;需求定理law of demand:认为在其他条件相同时,一种物品价格上升,该物品需求量减少的观点;需求表demand schedule:表示一种物品价格与需求量之间关系的表格;需求曲线demand curve:一种物品价格与需求量之间关系的图形;正常物品normal good:在其他条件相同时,收入增加引起需求量增加的物品; 低档物品inferior good:在其他条件相同时,收入增加引起需求量减少的物品; 替代品substitutes:一种物品价格上升引起另一种物品需求增加的两种物品; 互补品complements:一种物品价格上升引起另一种物品需求减少的两种物品; 供给量quantity supplied:卖者愿意而且能够出售的一种物品量;供给定理law of supply:认为在其他条件相同时,一种物品价格上升,该物品供给量增加的观点;供给表supply schedule:表示一种物品价格与供给量之间关系的表格;供给曲线supply curve:一种物品价格与供给量之间关系的图形;均衡equilibrium:供给与需求达到了平衡的状态;均衡价格equilibrium price:使供给与需求平衡的价格;均衡数量equilibrium quantity:当价格调整到使供给与需求平衡时的供给量与需求量;过剩surplus:供给量大于需求量时的状态;短缺shortage:需求量大于供给量时的状态;供求定理law of supply and demand:认为任何一种物品的调整都会使该物品供求平衡的观点;弹性elasticity:需求量或供给量对其决定因素中某一种的反应程度的衡量; 总收益total revenue:一种物品买者支付的量和卖者得到的量,用该物品的价格乘以销售量来计算;需求收入弹性income Elasticity of demand:一种物品需求量对消费者收入变动反应程度的衡量,用需求量变动百分比除以收入变动百分比来计算;需求的交叉价格弹性cross-price elasticity of demand:衡量一种物品需求量对另一种物品价格变动的反应程度,用第一种物品需求量变动百分比除以第二种物品价格变动百分比来计算;供给价格弹性price elasticity of supply:一种物品供给量对其价格变动反应程度的衡量,用供给量变动百分比除以价格变动百分比来计算;价格上限price ceiling:可以出售一种物品的法定最高价格;价格下限price floor:可以出售一种物品的法定最低价格;税收归宿tax incidence:关于由谁来承担税收负担的研究;福利经济学welfare economists:研究资源配置如何影响经济福利;支付意愿willingness to pay:买者愿意为某种物品支付的最高量;消费者剩余consumer surplus:买者的支付意愿减买者的实际支付量;成本cost:卖者为了生产一种物品必须放弃的每种东西的价值;生产者剩余producer Surplus:卖者出售一种物品得到的量减卖者的成本;效率efficiency:资源配置使社会所有成员得到的总剩余最大化的性质;平等equality:福利在社会成员中分配的公平性;无谓损失deadweight loss:税收引起的总剩余减少;世界价格world price:一种物品在世界市场上所流行的价格;关税tariff:对在国外生产而在国内销售的物品征收的税;外部性externality:一个人的行为对旁观者福利的影响;外部性的内在化internalizing the externality :改变激励,以使人们考虑到自己行为的外部效应;科斯定理coase theorem:一种观点,认为如果私人各方可以无成本地就资源配置进行协商,那么,他们就可以解决外部性问题;交易成本transaction cost:各方在协议与遵守协议过程中所发生的成本;庇古税pigovian taxes:用于纠正负外部性影响的税收;排他性excludability:可以阻止一个人使用一种物品时该物品的特性;竞争性rivalry:一个人使用一种物品减少其他人使用时该物品的特性;私人物品private goods:既有排他性又有竞争性的物品;公共物品public goods:既无排他性又无竞争性的物品;公有资源common resources:有竞争性但无排他性的物品;搭便车者free rider:得到一种物品的利益但避开为此支付的人;成本—收益分析coast-benefits analysis:比较提供一种公共物品的社会成本与利益的研究;公地悲剧tragedy of the commons:一个寓言,说明从整个社会的角度看为什么公有资源的使用大于合意的水平;预算盈余budget surplus:政府收入大于政府支出;预算赤字budget deficit:政府支出大于政府收入;平均税率average tax rate:总收入除以支付的总税收;边际税率marginal tax rate:增加1美元收入支出的额外税收;定额税lump-sum tax:每个人等量的税收;受益原则benefits principle:认为应该根据人们从政府服务中得到的利益来纳税的思想;支付能力原则原则ability-to-pay principle:认为应该根据一个人可以承受的负担来对这个人征税的思想;纵向平等vertical equity:主张支付能力高的纳税人应该交纳更多税的思想; 横向平等horizontal equality:主张有相似支付能力的纳税人应该交纳等量税收的思想;比例税proportional tax:高收入纳税人和低收入纳税人交纳收入中相同比例的税收;累退税regressive tax:高收入纳税人交纳的税收在收入中的比例低于低收入纳税人的税收;累进税progressive tax:高收入纳税人交纳的税收在收入中的比例高于低收入纳税人的税收;总收益total revenue:企业出售其产量所得到的量;总成本total cost:企业购买生产投入所支付的量;利润profit:总收益减总成本;显性成本explicit costs:要求企业支出货币的投入成本;隐性成本implicit costs:不要求企业支出货币的投入成本;经济利润economic profit:总收益减总成本,包括与隐性成本;会计利润accounting profit:总收入减显性成本;生产函数production function:用于生产一种物品的投入量与该物品产量之间的关系;边际产量marginal product:增加的一单位投入所引起的产量增加;边际产量递减diminishing marginal product:固定成本fixed costs:不随着产量变动而变动的成本;可变成本variable costs:随着产量变动而变动的成本;平均总成本average total cost:总成本除以产量;平均固定成本average fixed costs:固定成本除以产量;平均可变成本average variable costs:可变成本除以产量;边际成本efficient scale:额外一单位产量所引起的总成本的增加;有效规模efficient scale:使平均总成本最小的产量;规模经济economics of scale:长期平均总成本随产量增加而减少的特性;规模不经济diseconomies of scale:长期平均总成本随产量增加而增加的特性; 规模收益不变constant returns to Scale:长期平均总成本随产量增加而保持不变的特性;竞争市场competitive market:有许多交易相同产品的买者与卖者,以至于每一个买者和卖者都是价格接受者的市场;平均收益average revenue:总收益除以销售量;边际收益marginal revenue:增加一单位销售量引起的总收益变动;沉没成本sunk cost:已经发生而且无法收回的成本;垄断企业monopoly:一种没有相近替代品的产品的惟一卖者的企业;自然垄断natural monopoly:由于一个企业能以低于两个或更多企业的成本向整个市场供给一种物品或劳务而产生的垄断;价格歧视price discrimination:以不同价格向不同顾客出售同一种物品的经营做法;寡头oligopoly:只有少数几个卖者提供相似或相同产品的的市场结构;垄断竞争monopolistic competition:许多出售相似而不相同的产品的企业的市场结构;勾结collusion:一个市场上的企业之间就生产的产量或收取的价格达成的协议; 卡特尔Cartel:一致行动的企业集团;纳什均衡Nash equilibrium:相互作用的经济主体在假定所有其他主体所选战略为既定的情况下选择自己最优战略的状态;博弈论game theory:研究人们在各种策略情况下如何行事;囚徒困境prisoners' dilemma:两个被捕获的囚徒之间的一种特殊“博弈”,说明为什么甚至在合作对双方有利时,保持合作也是困难的;占优优势策略dominant strategy:无论其他参与者选择什么策略,对一个参与者都为最优的策略; 125生产要素:用于生产物品和劳务的投入;生产函数production function:用于生产一种物品的投入量与该物品产量之间的关系;劳动的边际产量marginal product of labor:增加的一单位劳动所引起的产量增加量;边际产量递减diminishing marginal product:一单位投入的边际产量随着投入量增加而减少的性质;边际产量值value of the marginal product:一种投入的边际产量乘以该产品的价格;资本capital:用于生产物品与劳务的设备和建筑物;补偿性工资差别compensating differential:为抵消不同工作的非货币特性而产生的工资差别;人力资本human capital:对人的投资的积累,如教育和在职培训;工会union:与雇主谈判工资和工作条件的工人协会;罢工strike:工会有组织地从企业撤出劳动;效率工资efficiency wages:企业为了提高工人的生产率而支付的高于均衡工资的工资;歧视discrimination:对仅仅由于种族、宗教、性别、年龄或其他个人特征不同的相似个人提供不同的机会;贫困率poverty rate:家庭收入低于一个称为贫困线的绝对水平的人口百分比; 贫困线poverty line:由联邦政府根据每个家庭规模确定的一种收入绝对水平,低于这一水平的家庭被认为处于贫困状态;实物转移支付in-kind transfers:以物品和劳务而不是以现金形式给予穷人的转移支付;生命周期life cycle:在人的一生中有规律的收入变动形式;持久收入permanent income:一个人的正常收入;功利主义utilitarianism:一种政治哲学,根据这种政治哲学,政府应该选择使社会上所有人总效用最大化的政策;效用utility:衡量幸福或满足程度的指标;自由主义liberalism:一种政治哲学,根据这种政治哲学,政府应该选择必要的公正的政策;这种公正要由yield在“无知面纱”的背后的无偏见观察者来评价;最大最小准则maximin criterion:一种主张,认为政府的目标应该是使社会上状况最差的人的福利最大化;社会保险social insurance:旨在保护人们规避负面事件风险的政府政策;自由至上主义libertarianism:一种政治哲学,根据这种政治哲学,政府应该惩罚犯罪并进行自愿的协议,但不应该进行收入再分配;福利welfare:补贴需要者收入的政府计划;负所得税negative income tax:向高收入家庭征税并给低收入家庭补贴的税制; 预算约束线budget constraint:对消费者可以支付得起的消费组合的限制;完全替代品perfect substitutes:无差异曲线为直线的两种物品;完全互补品perfect complements:无差异曲线为直角形的两种物品;收入效应income Effect:当一种价格变动使消费者移动到更高或更低无差异曲线时所引起的消费变动 ;替代效应substitution effect:当一种价格变动使消费者沿着一条既定的无差异曲线变动到有新边际替代率的一点时所引起的消费变动;寻租理论Rent-seeking theory:。
微观经济学 曼昆 第七章
25
C. 新进入市场买者的消费者剩余
20
= ½ x 10 x $10 = $50
15 D. 已进入市场买者由于价格下降而增加的消费
者剩余
= 10 x $10 = $100
10
5 0
0
需求曲线 Q
5 10 15 20 25 17
成本与供给曲线
▪ 成本:卖者为了生产一种物品而必须放弃的每种东西的价值(也是机会成本) ▪ 包括所有用于生产物品的资源的成本和卖者对于他们自己时间的评价 ▪ 例如:三个提供除草服务卖者的成本
总结:总消费者剩余等于需求曲 线以下和价格以上的面积
$200
$150
$100
$50
$0
Q
01234
消费者、生产者与市场效率
12
许多消费者的剩余与一条光滑的需求曲线
当 Q = 5(千双), 支付意愿是$50
边际买者为每每双双鞋鞋的的价格
如果 P = $30.
他的消费者剩余
P
$ 60
= $20.
50
对鞋的需求
因此, Qd = 2 当价格为P = $200时
消费者、生产者与市场效率
4
支付意愿与需求曲线
得出需求表
P (iPod的价格)
谁会买
人名
Anthony Chad Flea John
支付意愿
$250 175 300 125
$301及以上 没人
251 – 300 Flea
176 – 250 Anthony, Flea
29
资源的市场配置
▪ 市场经济中,资源的配置是由许多分散自利的买者与卖者相互作用决定的 ▪ 市场对资源的配置是合意的吗?还存在另一个不同的配置方法能使社会更好吗? ▪ 为回答这个问题,我们使用总剩余作为衡量社会福利的指标,我们也考虑市场配置是否有效率
- 1、下载文档前请自行甄别文档内容的完整性,平台不提供额外的编辑、内容补充、找答案等附加服务。
- 2、"仅部分预览"的文档,不可在线预览部分如存在完整性等问题,可反馈申请退款(可完整预览的文档不适用该条件!)。
- 3、如文档侵犯您的权益,请联系客服反馈,我们会尽快为您处理(人工客服工作时间:9:00-18:30)。
.
4
WTP and the Demand Curve
Derive the demand schedule:
P (price of iPod)
who buys
Qd
$301 & up nobody
0
name WTP 251 – 300 Flea
1
P
$350 $300 $250
P $301 & up
$200
251 – 300
$150 $100
$50 $0
176 – 250 126 – 175
0 – 125
Q
01234
.
Qd 0 1 2 3 4
6
About the Staircase Shape…
P
$350 $300 $250 $200 $150 $100
Q: If price of iPod is $200, who will buy an iPod, and what is quantity demanded?
name WTP
Anthony $250
Chad
175
Flea
300
John
125
A: Anthony & Flea will buy an iPod, Chad & John will not.
P
$350 $300 $250 $200
Flea’s WTP
supply curve?
▪ Do markets produce a desirable allocation of
resources? Or could the market outcome be improved upon?
1
Welfare Economics
▪ Recall, the allocation of resources refers to:
WTP measures how much the buyer values the good.
name WTP
Anthony $250
Chad
175
Flxample: 4 buyers’ WTP for an iPod
.
3
WTP and the Demand Curve
7 C H A P T E R
Consumers, Producers, and the Efficiency of Markets
Economics P R I N C I P L E S O F
N. Gregory Mankiw
© 2009 South-Western, a part of Cengage Learning, all rights reserved
In this chapter, look for the answers to these questions:
▪ What is consumer surplus? How is it related to the
demand curve?
▪ What is producer surplus? How is it related to the
At any Q, the height of the D curve is the WTP of the marginal buyer, the buyer who would leave the market if P were any higher.
$0
Q
01234
.
8
Consumer Surplus (CS)
Suppose P = $260.
Flea’s CS = $300 – 260 = $40.
The others get no CS because they do not buy an iPod at this price.
Total CS = $40.
.
9
CS and the Demand Curve
Consumer surplus is the amount a buyer is willing to pay minus the amount the buyer actually pays:
CS = WTP – P
name WTP
Anthony $250
Chad
175
Flea
300
John
125
▪ how much of each good is produced ▪ which producers produce it ▪ which consumers consume it
▪ Welfare economics studies how the allocation
of resources affects economic well-being.
$50
This D curve looks like a staircase with 4 steps – one per buyer.
If there were a huge # of buyers, as in a competitive market,
there would be a huge # of very tiny steps,
Anthony $250 176 – 250 Anthony, Flea
2
Chad Flea John
175 300
126 – 175
Chad, Anthony, Flea
3
125
0 – 125
John, Chad, Anthony, Flea
4
.
5
WTP and the Demand Curve
and it would look more like a smooth curve.
$0
Q
01234
.
7
WTP and the Demand Curve
P
$350 $300 $250 $200 $150 $100
$50
Flea’s WTP Anthony’s WTP
Chad’s WTP John’s WTP
▪ First, we look at the well-being of consumers.
.
2
Willingness to Pay (WTP)
A buyer’s willingness to pay for a good is the maximum amount the buyer will pay for that good.