作文范文之雅思表格作文
雅思表格作文
雅思表格作文英文回答:Table: Number of people who use different modes of transportation to work in a city.The table shows the number of people who use different modes of transportation to work in a city. The data was collected in 2018.As can be seen from the table, the most popular mode of transportation is driving alone, with 45% of people usingit to commute to work. Public transportation is the second most popular mode, with 30% of people using it. Carpooling and walking are the third and fourth most popular modes, with 10% and 8% of people using them, respectively. Only a small percentage of people (7%) use a bike to commute to work.中文回答:表格,在城市中使用不同交通方式上班的人数。
该表格显示了在城市中使用不同交通方式上班的人数。
数据是在2018年收集的。
从表格中可以看出,最受欢迎的交通方式是独自驾车,有45%的人使用它上下班。
公共交通是第二受欢迎的交通方式,有30%的人使用它。
拼车和步行是第三和第四受欢迎的交通方式,分别有10%和8%的人使用。
只有很少一部分人(7%)使用自行车上班。
雅思英语图表作文范文(必备3篇)

雅思英语图表作文范文第1篇A类雅思各类图表作文要点及范文一.曲线图解题关键1曲线图和柱状图都是动态图,解题的切入点在于描述趋势。
2在第二段的开头部分对整个曲线进行一个阶段式的总分类,使写作层次清晰,同时也方便考官阅卷。
接下来再分类描述每个阶段的specifictrend,同时导入数据作为分类的依据。
3趋势说明。
即,对曲线的连续变化进行说明,如上升、下降、波动、持平。
以时间为比较基础的应抓住“变化”:上升、下降、或是波动。
题中对两个或两个以上的变量进行描述时应在此基础上进行比较,如变量多于两个应进行分类或有侧重的比较。
4极点说明。
即对图表中最高的、最低的点单独进行说明。
不以时间为比较基础的应注意对极点的描述。
5交点说明。
即对图表当中多根曲线的交点进行对比说明。
6不要不做任何说明就机械地导入数据,这不符合雅思的考试目的。
曲线图常用词汇动词—九大运动趋势一:表示向上:increase,rise,improve,grow,ascend,mount,aggrandize,goup,climb, take off, jump,shoot up暴涨,soar,rocket, skyrocket雅思英语图表作文范文第2篇It is said that countries are becoming similar to each other because of the global spread of the same products, which are now available for purchase almost anywhere. I strongly believe that this modern development is largely detrimental to culture and traditions worldwide.A country’s history, language and ethos are all inextricably bound up in its manufactured artefacts. If the relentless advance of international brands into every corner of the world continues, these bland packages might one day completely oust the traditional objects of a nation, which would be a loss of richness and diversity in the world, as well as the sad disappearance of t he manifestations of a place’s character. What would a Japanese tea ceremony be without its specially crafted teapot, or a Fijian kava ritual without its bowl made from a certain type of tree bark?Let us not forget either that traditional products, whether these be medicines, cosmetics, toy, clothes, utensils or food, provide employment for local people. The spread of multinational products can often bring in its wake a loss of jobs, as people urn to buying the new brand,perhaps thinking it more glamorous than the one they are used to. This eventually puts old-school craftspeople out of work.Finally, tourism numbers may also be affected, as travelers become disillusioned with finding every place just the same as the one they visited previously. To see the same products in shops the world over is boring, and does not impel visitors to open their wallets in the same way that trinkets or souvenirs unique to the particular area too.Some may argue that all people are entitled to have access to the same products, but I say that local objects suit local conditions best, and that faceless uniformity worldwide is an unwelcome and dreary prospect.Heres my full answer:The line graphs show the average monthly amount that parents in Britain spent on their children’s s porting activities and the number of British children who took part in three different sports from 2008 to is clear that parents spent more money each year on their children’s participation in sports over the six-year period. In terms of the number of children taking part, football was significantly more popular than athletics and 2008, British parents spent an average of around £20 per month on their children’s sporting activities. Parents’ spending on children’s sports increased gradually over the followi ng six years, and by 2014 the average monthly amount had risen to just over £ at participation numbers, in 2008 approximately 8 million British children played football, while only 2 million children were enrolled in swimming clubs and less than 1 million practised athletics. The figures for football participation remained relatively stable over the following 6 years. By contrast, participation in swimming almost doubled, to nearly 4 million children, and there was a near fivefold increase in the number of children doing athletics.剑桥雅思6test1大作文范文,剑桥雅思6test1大作文task2高分范文+真题答案实感。
作文范文之雅思图表类英语作文模板

雅思图表类英语作文模板【篇一:雅思图表作文模板】1according to the chart'''2the date lead us to the conclusion that'''3the date show'''4the tree diagram reveals how'''5the figures show'''6this is a cure graph which describes the trend of'''7the pie graph depicts'''8the graph provides some interesting date regrarding'''9the table shows the changes in the number of ''' over the period from '''to '''10as is shown in the table '''11from the table ,we can clearly see that '''12this table shows the changing proportion of x and y from ''' to '''' 13the graph,presented in a pie chart, shows the general trend '''14as can be seen from the grape ,the two curves show the flutuation of '''15over the period from '''to '''the'''remained level.16in the year between '''and '''.17in the 3 years spanning from 2005 through 2008.18the number of ''' remained steady from '''to ''''.19the number sharply went up to '''20the percentage of ''' stayed the same between ''' and '''21the percentage remainede steady at'''22the percentage of '''is sightly large than that of.23there is not a great deal of differece between '''and '''24the graphs show a three fold increase in the number of '''25'''decreased year by year while '''increased steadily.26there is an upward trend in the number of '''27 a considerable increase occurred from '''to '''28from '''to '''the rate of decrease slow down.29from this year on,there was a gradual declinel reduction in the'''reaching a figure of.30be similar to '''be the same as31there are a lot similarities between '''and '''32the difference between x and y lies in ''para 1,两句话:第一句:___________ this is a c hart, which demonstrates thenumber of ______ from ____ to____ .如果两个图,则:there are two charts below. the ___chart describes the number of_____ , and the ____ chart illustrates the figure of . 第二句:(所有题目适用),f rom thechart we can see that the number of ______ variesconstantly/greatly in ____ . )para 2, as we can see from the chart,/or it is clear from thechart that __ . 如果有两个图:则:the ____ chart shows that ______ ./or as we can see from thefirst chart, ______para 3, (如果两个图的话,) it is clear from the second chartthat ?para 4 结尾:from the figures/statistics above, we cansee/conclude/draw a conclusion that ?the bar chart indicates the current situation of the amount of money spent on fastfoods according to different income classes in britain.for those who belong to the high-income class, hamburgerhas been shown to beperson per week. by contrast fish and chips remain at a ratherlow level of about 16pence per person per week, and pizza, though attracts moreexpenses, accounts for 19pence per person per week, merely 3 pence more than that of fish and chips.as expected, low-income class spend much less in all 3categories than high-incomeclass, with fish and chips at the top of the list at 15 pence percapital per week, andpizza at the bottom at a weekly expense of 8 pence per capital. the average income group resembles high-income class in hamburger consumptionat the largest amount of 33 per person every week, and low- income class in pizzaconsumption at the smallest amount of 11 per person everyweek, but amazingly, fishand chips consumed by this group leads all classes at aweekly expense of 25 penceper person.in conclusion, hamburgers, in general gain more welcomethan other types of fastfood.para1. this is a table / chart / (line 线状bar 柱状pie 饼状)graph which demonstrate / illustrate /reveal /depict /privide information about ....para2.(1)obvious /apparent from the graph is that ...rank thefirst/highest,while/whereas turn out tobe the lowest(2)it is exhibited/shown in the table that(3)it can be seen from the table thatpara3.(1) 饼.柱图a,which accounts for...%,ranks the first;then nextis b with...%;followed byc,constituting...%;finally it comes d.e.fat...%...%and...%respectively(2)特殊变化(不变,增长或下降多的)(3)① it is worth mentioning that.... ② it must be pointed outthat . ③ morestriking/suprising is that para4.to conclude /inconclusion/overall1.最明显的原因__,因此___the most obvious reason for this phenomenon is that_____ c onsequently, _____ .2.无论你喜欢与否,_____ 已经变得越来越流行,这是有原因的no matter you like it or not, aaa has become more and more popular and there are many reason for it.3.对我们来说,改变这个不利的环境____ 是非常紧急的it ’ s an urgent task for us to change this unfavorable situation:4.这个图片会让你想起一些奇怪的东西,这种现象还是会继续存在这个社会the picture can reminds you of some strange, yet familiar phenomena existing in our society.5.提供了大量的解决方案,一些人建议___, 另一些人建议___a great number of solutions are being offered. some peoplesuggest that _____ . others argue that .6.对于__ ,我们应该___confronted with aaa, we should take a serious of effectivemeasures to cope with thesituation.7.然而,___引起了许多为问题,however _____ may cause some problems. first, it is__second,__. finally, __ . so, it is clear that__has its advantages and disadvantages.8.虽然___ 有一个__的非常大的好处,但是它不能完全__在__方面although ______ h as a great advantage of ______ , it cantcompete with _____ i n ___ .9.____ 也许更喜欢 ____ _________ , 但是 __ 忍受的不利之出_____ may be preferable to ____ , but it suffers from the disadvantages that___.10.____ 的有利之处比__ 的有利之处要多,举例说明,____ the advantages of _______ are much greater that thoseof ____ .for instance, ___.11.but i don ’ t think it is a very good way to solve ___. for instance, _____ .worst of all, _____ .12.there are many ways to ______ . first, __ . second, _____ .third, ___.13.on the contrary, there are some people in favor of __ .14.they believe___. moreover, they think __ . there areseveral measures for us to adopt. first,we can _____ , there are a number of advantages of ___ .another solution is to ____ .15.it is high time that something was done about it. forexample, _______ . in addition,______ . all these measures will certainly _.16. there are some other people, who ______ . their reasons are different, something for ____ ,sometimes for _____ , and sometimes simply for ______ .17. ___ is necessary and important to our country ’ sdevelopment and construction. first, __ .what’ s more, ___. most important of all,___.18.however, if not managed properly, ___ can create manyproblems.sometimes ______ .furthermore,_. therefore, ___ has been gaining public concern.19.有很多原因___ ,???①there are probably many reasons for ___ . first, _.②second, ____ . finally, ___.there are, i think, two mainreasons for __. in the first place, ___. in the second place, __. therefore,③well, why is there __ ? i think there might be two reasons.one is ___, and the other is ___ .④why___? for one thing, ___ . for another, ___ . perhaps themain reason is ___.⑤why ______ ? the first reason is that___. the second reason is___. the third is__. for all this,the main cause of ______ is due to ___ .1..it is no easy job to find the reasons for this tendency which involves several complicated factors. for some ___. for others21.“ why do _____ ? ” many people often ask questions likethis.22.in recent years, there is a general tendency to ___. according to a study, there is__. compared with __ last year. why ?23.according to a survey, there is a growing number of ___.what brings this result? the mainreason rests with.24.① some people prefer to ___. in their opinion, _ . inaddition, ___ . nevertheless,nowadays, __ has become more and more common.② many people are inclined to __ . in their opinion, ___.theybelieve that ___.25.today, there __, which have brought a lot of harms in our daily life. first, __ second, _____ . what makes things worse isthat ___.26.nowadays, ___ has become a problem we have to face. though it ’ s easier said than done, with the help of modern technology, we now have many means to solve it.27.对于这个图,说明了_①t he graph shows the general trend in ______ .②a ccording to the figures/numbers/statistics/percentages in the table/chart/bar graph/line graph, it can be seen that ___. obviously, , but why?③t he figure indicates/shows/suggests/proves that___. there is a steady/rapid development/trend of _.④f rom the graph/chart, we know the statistics of __ and _. it can be seen easily that ___. ⑤ according to the two graphs presented, it can be observed that ___ in the left graph, __. at the same time, _ as the right graph shows.28.现在我们经常听到____ , 但是真的如此吗?①these days we are often told that _. but is it true?②t hese days we often hear about ___. but is this really the case?29.一位著名的作家曾经说过 ___one of the great writers once said that _. now it still has a realistic significance.30.回看历史,_____ 的想法从来都没流行过,一方面_____ 另一方面 ____in our history, the idea that never has been so popular.on one hand, ___, on the other hand,31.人们中有许多像___ 不同的意见,一些人认为______there are different opinions among people as to ___ . somepeople suggest that __.32.一些人认为__对 _____ 来说在许多方面都是好的,然而,其他人不同意some people hold the opinion that _ is superior to __ in many ways: others, however, disagree with it.33.现在虽然越来越多的人___, 但仍有一些__的人,他们也许认为nowadays although more and more people __, still there are some who think __, they may think【篇二:雅思图表作文模板20 篇下载】智课网ielts 备考资料雅思图表作文模板20 篇下载摘要:雅思图表作文模板20 篇下载。
雅思小作文范文表题(必备14篇)
雅思小作文范文表题(必备14篇)(经典版)编制人:__________________审核人:__________________审批人:__________________编制单位:__________________编制时间:____年____月____日序言下载提示:该文档是本店铺精心编制而成的,希望大家下载后,能够帮助大家解决实际问题。
文档下载后可定制修改,请根据实际需要进行调整和使用,谢谢!并且,本店铺为大家提供各种类型的经典范文,如工作总结、工作计划、合同协议、条据文书、策划方案、句子大全、作文大全、诗词歌赋、教案资料、其他范文等等,想了解不同范文格式和写法,敬请关注!Download tips: This document is carefully compiled by this editor. I hope that after you download it, it can help you solve practical problems. The document can be customized and modified after downloading, please adjust and use it according to actual needs, thank you!Moreover, our store provides various types of classic sample essays for everyone, such as work summaries, work plans, contract agreements, doctrinal documents, planning plans, complete sentences, complete compositions, poems, songs, teaching materials, and other sample essays. If you want to learn about different sample formats and writing methods, please stay tuned!雅思小作文范文表题(必备14篇)雅思小作文范文表题第1篇The graph below shows the amounts of waste produced by three companies over a period of 15 years.雅思小作文范文The line graph compares three companies in terms of their waste output between the years 2000 and 20XX.It is clear that there were significant changes in the amounts of waste produced by all three companies shown on the graph.While companies A and B saw waste output fall over the 15-year period, the amount of waste produced by company C increased considerably.In 2000, company A produced 12 tonnes of waste, while companies B and C produced around 8 tonnes and 4 tonnes of waste material respectively.Over the following 5 years, the waste output of companies B and C rose by around 2 tonnes, but the figure for company A fell by approXimately 1 tonne.From 2005 to 20XX, company A cut waste production by roughly 3 tonnes, and company B reduced its waste by around 7 tonnes.By contrast, company C saw an increase in waste production of approXimately 4 tonnes over the same 10-year period.By 20XX, company C’s waste output had risen to 10 tonnes,while the respective amounts of waste from companies A and B had dropped to 8 tonnes and only 3 tonnes.(192 words, band (9)雅思图表作文真题:混合图:温度与降水The climograph below shows average monthly temperatures and rainfall in the city of Kolkata.雅思小作文范文The chart compares average figures for temperature and precipitation over the course of a calendar year in Kolkata.It is noticeable that monthly figures for precipitation in Kolkata vary considerably,whereas monthly temperatures remain relatively stable.Rainfall is highest from July to August, while temperatures are highest in April and May.Between the months of January and May,average temperatures in Kolkata rise from their lowest point at around 20°C to a peak of just over 30°C.Average rainfall in the city also rises over the same period, from approXimately 20mm of rain in January to 100mm in May.While temperatures stay roughly the same for the neXt four months, the amount of rainfall more than doubles between May and June.Figures for precipitation remain above 250mm from June to September, peaking at around 330mm in July.The final threemonths of the year see a dramatic fall in precipitation, to a low of about 10mm in December,and a steady drop in temperatures back to the January average.(173 words, band (9)雅思图表作文真题:混合图:独居人口The bar chart below shows the proportions of English men and women of different ages who were living alone in 20XX.The pie chart compares the numbers of bedrooms in these one-person households.Living alone in England by age and gender, of bedrooms in one-person households (England, 20XX)雅思小作文范文The two charts give information about single-occupant households in England in the year 20XX.The bar chart compares figures for occupants age and gender, and the pie chart shows data about the number of bedrooms in these homes.Overall, females made up a higher proportion of people living alone than males, and this difference is particularly noticeable in the older age categories.We can also see that the most common number of bedrooms in a single-occupant home was two.A significant majority of the people aged 65 or over whowere living alone in England in 20XX were female.Women made up around 72% of single occupants aged 75 to 84, and 76% of those aged 85 or over.By contrast, among younger adults the figures for males were higher.For eXample, in the 35-49 age category,men accounted for nearly 65% of people living alone.In the same year, of one-person households in England had two bedrooms,while one-bedroom and three-bedroom homes accounted for 28% and of the total.Under 7% of single-occupant homes had four or more bedrooms.(189 words, band(9)以上就是雅思图表作文真题及高分范文汇总的全部内容,更多雅思小作文及图表作文真题范文,请关注小站雅思频道。
雅思小作文范文表题(必备14篇)

雅思小作文范文表题(必备14篇)雅思小作文范文表题第9篇雅思小作文范文表题第10篇Task achievement1. 文章基本呈现了图表中的全部数字。
为了避开数字过多的状况,同一学位水平中男女所占比例只消失了一个(总和为100%)。
不影响我们对图表的认知。
2. 文章结尾处总结了图表的整体特点,即文章来自老烤鸭雅思男性在高等学位和低等学位所占比例较多,而女性则在本科阶段所占比例较多。
3. 文章对数据进行了合理对比。
主体段一开头先指出男女差异最大的类别。
然后将剩余类别根据男性多于女性或者女性多于男性进行分类比较。
Coherence and Cohesion1. 文章规律结构合理。
分组之间没有消失重复的状况,而且点出了最大的差异所在。
2. 使用了各种各样的链接手段。
如其次段开头的immediately, 其次段结尾处的by contrast, 第三段开头的at the higher levels of education等。
也就是说链接手段并不肯定得是and或者however,重要的是让文章整体行文流利通常。
3. 指代方面,利用定语从句和词汇(counterpart)来避开混乱和重复。
Lexical Resource文章用词丰富,持有学位使用了held,with,reach等进行同义替换。
同时比较过程中除了使用比较级之外,还用了outnumber这样的词来展现自己的词汇积累。
Grammatical Range语法结构方面,文章虽然也有各种各样的从句,但并不是每个句子都很简单。
关键在于句子结构各不相同。
敏捷使用各种非谓语动词,状语前置来呈现句子的多样性。
雅思小作文范文表题第11篇题目:The bar chart below shows the proportions of English men and women of different ages who were living alone in 2023. The pie chart compares the numbers of bedrooms in these one-person households. Living alone in England by age and gender, 2023Number of bedrooms in one-person households (England, 2023)雅思小作文范文表题第12篇Dear Sir/ Madam,Dear Professor Moss,I am Sandy, a junior student of the Department of Electrical and Computer Engineering. I am writing to enquire about your African Literature and Culture course.Just a few days ago, I found the course when we were asked to choose optional courses for next semester. The name of African Literature and Culture aroused my great interest. Because of your reputation and my enthusiasm in literature, I hope I could study this course next semester. Except the name, however, all I know about the course is that it is atwo-hour one held every Thursday afternoon. I want to get more details of the course. First of all, I would like to know the brief outline of the course. Moreover, I wonder if there are some relevant books that you can recommend for me to read before the course.I also heard that another course of yours, Chinese Literature, is held every Friday afternoon. If the registration of this course hasn’t closed yet, I will be so glad to participate in your class.Sorry to bother you. Your help will be greatly appreciated.Yours sincerely,Sandy雅思小作文范文表题第13篇题目:The chart below shows the total number of minutes (in billions) of telephone calls in the UK, divided into three categories, from 1995-2023. Here's my suggested outline for a 4-paragraph report: Introduction: rewrite the question statement in your own words.Overview: point out which category was highest in each year, which was lowest, and which saw the biggest changes.Details: compare the 3 categories in 1995, then say what happened up until 1999.Details: notice what happened to local calls from 1999 onwards, and contrast this with the other 2 categories. Finish with a comparison of thefigures in 2023.雅思小作文范文表题第14篇The graph below shows the proportion of the population aged 65 and over between 1940 and 2040 in three different countries.雅思小作文范文:The line graph compares the percentage of people aged 65 or more in three countries over a period of 100 years.It is clear that the proportion of elderly people increases in each country between 1940 and 2040. Japan is expected to see the most dramatic changes in its elderly population.In 1940, around 9% of Americans were aged 65 or over, compared to about 7% of Swedish people and 5% of Japanese people. The proportions of elderly people in the USA and Sweden rose gradually over the next 50 years, reaching just under 15% in 1990. By contrast, the figures for Japan remained below 5% until the early 2000s.Looking into the future, a sudden increase in the percentage of elderly people is predicted for Japan, with a jump of over 15% in just 10 years from 2030 to 2040. By 2040, it is thought that around 27% of the Japanese population will be 65 years old or more, while the figures for Sweden and the USA will be slightly lower, at about 25% and 23% respectively.(178 words, band 9)。
作文范文之雅思表格作文
雅思表格作文【篇一:雅思a类图表作文常用句型】2 the first point to note is the huge increase in the number of 需要注意的第一点就是…的急剧增长3 the statistics show that这些数据表明4 占百分之几form/comprise/make up/constitute/ accountfor ….percent 5 this cure graph describes the trend of该曲线图描述了…的趋势6 the statistics lead us to the conclusion that由这些数据,我们可以做出如下结论7 as can be seen from the line graph,由线状图我们可以看出8 增加:increase / raise / rise / go up/ soar/ ascend/ mount/ climb9 减少:decrease / grow down / drop / fall/ reduce/ descend/ shrink to/decline 10 稳定:remain stable / stabilize / level off/ remain unchanged 11 it can be seen from the table that由表格我们可以看出12 the table shows the changes in the number of… over the period from…to… 该表格展示了从…到…数据的变化13 the table provides some data of该表格提供了有关…的数据14 as can be seen clearly from the table,从表格中我们可以清楚地看出,15 as can be seen from the table, great changes have taken place in... 从表格中可以看出,...发生了巨大变化16 this table illustrates the changing proportion of a and b from...to... 该表格描述了...年到...年间a与b的比例关系17 急剧地 sharply, steeply, dramatically, drastically, suddenly18 显著地,considerably, significantly, noticeably, remarkably, rapidly 19 稳步地, 逐渐地 steadily, moderately, gradually, smoothly20 轻微地, 缓慢地 slightly, slowly, mildly, moderately21 the following diagram shows the structure of......以下的图展示了...的结构22 the picture illustrates......该图展示了...23 it mainly consists of following steps.它主要包括以下步骤24 the whole procedure can be divided into...stages.整个的过程可以分为...步25 the first step is to第一步是...26 the next step is to接下来的一步是...27 the last step is to最后的一步是...28 the first stage involves第一步包括...29 in the next stage接着,30 in the last stage最后,31 the bar chart illustrates that…该柱状图展示了32 as is shown in the bar chart,如柱状图所示,33 it can be concluded from the bar chart that…从该柱状图我们可以推导出34 the bar chart presents the general trend in…该柱状图描述了……总的趋势35 this bar chart displays the numbers of…该柱状图展示了…的数据36 the number of … increased by %…的数字上升了百分之…37 the number of… dropped by %…的数字下降了百分之…38 the chart reflects several trends.该图展示了几个趋势39 as can be seen clearly from the bar chart, the fluctuation of…took place 从该柱状图我们可以清楚地看出:…出现了波动40 over the period from…to…the…remained level.在……至……期间,…基本不变雅思图表作文经典句型总结(一)一.上升增长1.…add up to… 增加了eg. the total amount of … added up to 14 billion pounds(14%) in 1994.2. to jump to / to soar to.. 一跃达到/ 猛增到…eg. the total working days lost soared to 10 million in 1979.3.…an increase of about…percent as compared with.. 与…相比大约增加了…eg. in august as many as 39 car accidents were reported, indicating an increase of about 79% as compared with the number of january.4.…to experience an increase/incline …有了增长eg. tobacco consumption is experiencing an incline.二.下降,减少1.…to sink/drop/reduce to… 减少到…eg. the rate of strikes sank/dropped to the lowest point in 1979. 2.…to experience a decrease/decline …有了减少eg. tobacco consumption is experiencing a decrease.注意:修饰上升/减少的副词有:rapidly slowly dramatically respectively 表达上升/减少的最后状态的词有:the highest peak the lowest point 10 million 10%三.起伏1.…to go up and down …起伏不定eg. the strike rate went up and down during the period from 1952 to 1967.2.there be ups and downs …有起有伏eg. between 1972 and 1979, there were several ups and downs in (某方面).四.稳定1.…to remain steady/level/unchanged …保持稳定,几乎不变eg. the rate of …remained steady(fairly level/almost unchanged) during the four years from 1963 to 1967.2.…to level off (vi.)eg. after a steady decline for a whole decade, the …rate shows signs of leveling off.注意:修饰起伏或稳定状态的副词有:almost fairly 可以用于表达起伏,稳定状态的句子中的词组或句型: the general situation was not worseningshow indications of improvementit can be predictedthat…eg. the rate of …remained steady during the four years from 1963 to 1967,and it can be predicted that the general situation was not worsening.eg. the rate of …remained steady duringthe four years from 1963 to 1967,showing signs ofimprovement in …五.成正比,反比1.…be in direct /inverse ratio to/with 与…成正比/反比eg. male illustrations are in direct ratioto /with the advancement of grades, while female illustrations are ininverse ratio.六.占百分之几,几分之几1….to form/comprise/make up/constitute ….percent …占百分之…eg. women comprise more than 50% of the us.population.eg. females make up only 24% of the illustrations whereas males constitute 76%.2.…to form/comprise/constitute a half/third/fourth of……占…的1/2,1/3,1/4eg. female illustrions form less than a fourth of the total.3.…account for…percent占百分之几eg. ……, accounting for approximately 20 percent of…七.倍数1.a be …times as much/many as beg. the annual rainfall of hunan is 5 times as much as that of sichuan.2.a doubles/is half/triples b a是b的两倍,一半,三倍eg. the annual rainfall of jidda doubles that of janta, but is only half the amount of rain kuwait receiveseach year.附一圆盘比例型图表例:一个圆盘显示了大学生在food, books, transportations, entertainment, clothes, unknown中的开销,它们各自占的比例依次是60%,3%,5%,10%,10%,12%,要求你描叙这个圆盘图。
雅思图表小作文范文(合集23篇)

雅思图表小作文范文(合集23篇)Most senior citizens retire or no longer work full-time. They usually live in their own houses not far from their children's, while the children of a few senior citizens have gone abroad and work or study far beyond the oceans. For certain senior citizens, tile years after retirement are not very enjoyable. First, they feel that their lives lose meaning for being at home all day. In addition, they may feel lonely, especially those without children around. Moreover, they become more concerned with their health, as they grow older, and worry a lot about their safety. At the same time, many senior citizens enjoy their lives. They feel free to do things they were not able to do when they were working and raising their families. They spend their time travelling, doing exercises or watching TV. They get together with their fellow members who have the common interests and equal free time.大多数的老人退休或不再做全职工作。
雅思写作八分经典范文背诵:图表作文(5)
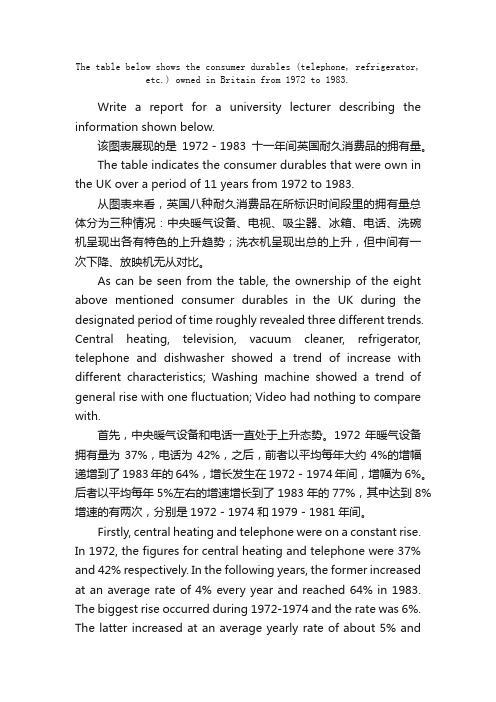
The table below shows the consumer durables (telephone, refrigerator, etc.) owned in Britain from 1972 to 1983.Write a report for a university lecturer describing the information shown below.该图表展现的是1972-1983十一年间英国耐久消费品的拥有量。
The table indicates the consumer durables that were own in the UK over a period of 11 years from 1972 to 1983.从图表来看,英国八种耐久消费品在所标识时间段里的拥有量总体分为三种情况:中央暖气设备、电视、吸尘器、冰箱、电话、洗碗机呈现出各有特色的上升趋势;洗衣机呈现出总的上升,但中间有一次下降、放映机无从对比。
As can be seen from the table, the ownership of the eight above mentioned consumer durables in the UK during the designated period of time roughly revealed three different trends. Central heating, television, vacuum cleaner, refrigerator, telephone and dishwasher showed a trend of increase with different characteristics; Washing machine showed a trend of general rise with one fluctuation; Video had nothing to compare with.首先,中央暖气设备和电话一直处于上升态势。
- 1、下载文档前请自行甄别文档内容的完整性,平台不提供额外的编辑、内容补充、找答案等附加服务。
- 2、"仅部分预览"的文档,不可在线预览部分如存在完整性等问题,可反馈申请退款(可完整预览的文档不适用该条件!)。
- 3、如文档侵犯您的权益,请联系客服反馈,我们会尽快为您处理(人工客服工作时间:9:00-18:30)。
作文范文之雅思表格作文作文范文之雅思表格作文雅思表格作文【篇一:雅思a类图表作文常见句型】2 the first point to note is the huge increase in the number of需要注意的第一点就是…的急剧增长3 the statistics show that这些数据表明4 占百分之几form/comprise/make up/constitute/ accountfor ….percent 5 this cure graph describes the trend of该曲线图描述了…的趋势6 the statistics lead us to the conclusion that由这些数据,我们能够做出如下结论7 as can be seen from the line graph,由线状图我们能够看出8 增加:increase / raise / rise / go up/ soar/ ascend/ mount/ climb9 减少:decrease / grow down / drop / fall/ reduce/ descend/ shrink to/decline 10 稳定:remain stable / stabilize / level off/ remain unchanged 11 it can be seen from the table that 由表格我们能够看出12 the table shows th e changes in the number of… over the period from…to… 该表格展示了从…到…数据的变化13 the table provides some data of该表格提供了有关…的数据14 as can be seen clearly from the table,从表格中我们能够清楚地看出,15 as can be seen from the table, great changes have takenplace in... 从表格中能够看出,...发生了巨大变化16 this table illustrates the changing proportion of a and b from...to... 该表格描述了...年到...年间a与b的比例关系17 急剧地sharply, steeply, dramatically, drastically, suddenly18 显著地,considerably, significantly, noticeably, remarkably, rapidly 19 稳步地, 逐渐地steadily, moderately, gradually, smoothly20 轻微地, 缓慢地slightly, slowly, mildly, moderately21 the following diagram shows the structure of......以下的图展示了...的结构22 the picture illustrates......该图展示了...23 it mainly consists of following steps.它主要包括以下步骤24 the whole procedure can be divided into...stages.整个的过程能够分为...步25 the first step is to第一步是...26 the next step is to接下来的一步是...27 the last step is to最后的一步是...28 the first stage involves第一步包括...29 in the next stage接着,30 in the last stage最后,31 the bar chart illustrates that…该柱状图展示了32 as is shown in the bar chart,如柱状图所示,33 it can be concluded from the bar chart that…从该柱状图我们能够推导出34 the bar chart presents the general trend in…该柱状图描述了……总的趋势35 this bar chart displays the numbers of…该柱状图展示了…的数据36 the number of … increased by %…的数字上升了百分之…37 the number of… dropped by %…的数字下降了百分之…38 the chart reflects several trends.该图展示了几个趋势39 as can be seen clearly from the bar chart, the fluctuation of…took place 从该柱状图我们能够清楚地看出:…出现了波动40 over the period from…to…the…remained level.在……至……期间,…基本不变雅思图表作文经典句型总结(一)一.上升增长1.…add up to… 增加了eg. the total amount of … added up to 14 billion pounds(14%) in 1994.2.to jump to / to soar to.. 一跃达到/ 猛增到…eg. the total working days lost soared to 10 million in 1979.3.…an increase of about…percent as compared with.. 与…相比大约增加了…eg. in august as many as 39 car accidents were reported, indicating an increase of about 79% as compared with the number of january.4.…to experience an increase/incline …有了增长eg. tobacco consumption is experiencing an incline.二.下降,减少1.…to sink/drop/reduce to… 减少到…eg. the rate of strikes sank/dropped to the lowest point in 1979.2.…to experience a decrease/decline …有了减少eg. tobacco consumption is experiencing a decrease.注意:修饰上升/减少的副词有:rapidly slowly dramatically respectively 表示上升/减少的最后状态的词有:the highest peak the lowest point 10 million 10% 三.起伏1.…to go up and down …起伏不定eg. the strike rate went up and down during the period from 1952 to 1967.2.there be ups and downs …有起有伏eg. between 1972 and 1979, there were several ups and downs in (某方面).四.稳定1.…to remain steady/level/unchanged …保持稳定,几乎不变eg. the rate of …remained steady(fairly level/almost unchanged) during the four years from 1963 to 1967.2.…to level off (vi.)eg. aft er a steady decline for a whole decade, the …rate shows signs of leveling off.注意:修饰起伏或稳定状态的副词有:almost fairly 能够用于表示起伏,稳定状态的句子中的词组或句型:the general situation was not worseningshow indications of improvementit can be predictedthat…eg. the rate of …remained steady during the four years from 1963 to 1967,and it can be predicted that the general situation was not worsening.eg. the rate of …remained steady during the four years from 1963 to 1967,showing signs of improvement in …五.成正比,反比1.…be in d irect /invers e ratio to/with 与…成正比/反比eg. male illustrations are in direct ratioto /with the advancement of grades, while female illustrations are in inverse ratio.六.占百分之几,几分之几1….to form/comprise/make up/constitute ….percent …占百分之…eg. women comprise more than 50% of the us.population.eg. females make up only 24% of the illustrations whereas males constitute 76%.2.…to form/comprise/constitute a half/third/fourth of……占…的1/2,1/3,1/4eg. female illustrions form less than a fourth of the total.3.…account for…percent占百分之几eg. ……, accounting for approximately 20 percent of…七.倍数1.a be …times as much/many as beg. the annual rainfall of hunan is 5 times as much as that of sichuan.2.a doubles/is half/triples b a是b的两倍,一半,三倍eg. the annual rainfall of jidda doubles that of janta, but is only half the amount of rain kuwait receiveseach year.附一圆盘比例型图表例:一个圆盘显示了大学生在food, books, transportations, entertainment, clothes, unknown中的开销,它们各自占的比例依次是60%,3%,5%,10%,10%,12%,要求你描叙这个圆盘图。