大学英语图表作文(教学版,含范文,常用句型)
图表类作文大学英语

图表类作文大学英语English:In this chart, we can see the percentage of people who prefer different modes of transportation for commuting. The most popular mode of transportation among respondents is car, with 40% of people choosing to drive to work. This is followed by public transport, with 35% of respondents indicating that they prefer taking the bus or train. Walking is the third most popular choice, with 15% of people opting to walk to their workplace. Cycling is the least favored mode of transportation, with only 10% of respondents indicating that they choose to ride a bike to commute. These results show that cars are still the preferred mode of transportation for the majority of people, while public transport is also a popular choice. It is interesting to note that walking is preferred more than cycling, which could be attributed to factors such as better pedestrian infrastructure and convenience. This data provides valuable insights into the transportation choices of people and can be useful for urban planners and policymakers in designing transportation systems that cater to the needs of the public.中文翻译:在这个图表中,我们可以看到人们在通勤时喜欢不同交通方式的百分比。
大学英语四级作文-图表

(2) 图表作文1)高分作文剖析Directions:For this part, you are allowed 30 minutes to write an essay entitled Living Expenditure of College Students. You should write at least 120 words following the outline given below in Chinese:Year〖〗1990〖〗1995〖〗2000〖〗2005Food〖〗24 5%〖〗24 5%〖〗24%〖〗23 7%Clothes〖〗10 9%〖〗12 7%〖〗15%〖〗18 5%Transportation and Communication 〖〗10 2%〖〗12%〖〗17 4%〖〗20 3%Entertainments〖〗7 5%〖〗7 5%〖〗13 5%〖〗17%1. 上图所示为1990年、1995年、2000年和2005年某校大学生生活费用的变化情况,请描述其变化2. 请说明发生这些变化的原因3. 你的看法Living Expenditure of College Students(1) Studying the above table carefully, we can see that in the past 15 years, there have been great changes in college students living expenditure. (2) Expense on food is on the decline from 24 5% to 2005 s 23 7% of all. (3) By contrast, the money spent on clothes, transportation, communication and entertainments is on the rise. (抓住了表格变化的主要规律,具有高度的概括性)(4) The essential reason for this phenomenon is probably the change of college students living circumstances. (5) In the early 1990s, most of the students had little money to spend and therefore they led a comparatively simple life on campus. (6) However, with the development of economy these years, the overall living standard of Chinese people has been greatly improved. (7) So the students in college own much more chances as well as money to enjoy a colorful campus life. (8) Naturally, not worrying about basic living necessities, they pay more attention to clothes, communication, entertainments, etc.(找到了导致这一变化的最根本原因,分析透彻)(9) From my point of view, this kind of change is a necessary outcome of social development. (10) As a college student, I can feel this change and enjoy my pleasant campus life.2)常用表达图表类型:饼型图pie;柱型图column, chart;线型图graph, curve;统计表table上升: increase, rise, ascend, surge, go up, climb to, mount to下降: decrease, fall, descend, drop, go down, decline稳定: be stable, be steady, remain/maintain/keep the same as...波动: fluctuate, rise and fall, go up and down占据: occupy, take up, account for, gain the percentage of波峰: the top, the summit, the peak波谷: bottom3)常用句式起始语As is shown from the table/chart/graph ...The table/chart/graph shows the difference between ...From/According to the table/chart/graph, we can see that ...数字的比较—同级比较:A is twice as much/many as B.(A是B的二倍)—比较级:A is three times larger than B. (A是B的四倍)—increase/decrease by/to 50%时间(跨度)的描述—over the period of 1978-2005—during the past 5 years—in the 7 years spanning from 1998 to 2005评论语—There is a rapid/dramatic/marked/sharp/steep...(slow/slight/small/gradual...) rise/ increase/ decrease/ drop/ fall ... in ...描述原因(图表作文的第二部分往往要求分析图表呈现某种特点的原因)—There are three reasons for this—The reasons for this are as follows—The reasons for this are obvious—We have good reasons to believe that...结束语—According to the figures shown in the graph, we can conclude that...—After considering the information in the graph,we might conclude that...—Therefore/In conclusion/Thus/Finally, we may say that...4)范文点评范文一(CET4,2002-6)1. 上图所示为1990年、1995年、2000年某校大学生使用计算机的情况,请描述其变化2. 请说明发生这些变化的原因(可从计算机的用途、价格或社会发展等方面加以说明)3. 你认为目前大学生在计算机使用中有什么困难或问题『8分档』Nowadays, computers are more and more popular, especially in the college students.(介词使用不当)we know that at 1990(介词使用不当)the average hours a student spends on the computer per week are very low, just about 2 hours. As the time passed, the number at 1995 was as twice as that at 1990(比较级结构错误). However, this number explored(动词词义不符)to 20 at 2000, which was 10 times as that in 1990.Why have this change?(句子结构混乱)In my opinion, there are two causes. On one hand, the computer is essential for study. Students can copy or download the contents of the subjects they study, that (定语从句的连接词使用不当)is very convenient. On the other hand, the price of the computer has been declining in recent years. So more and more students can afford it. Computer is widely used, because more and more troubles have come up.(不合逻辑)Most students don t have enough knowledge to use the computer when it has any trouble. And many students play computer games day and night and it is harm to them.(词性错误)In a word, computer has brought us lot of convenient.(词性错误)We should use it fully.这篇作文的第一部分主要考查的是学生对图表的描述能力。
大学英语图表作文范文

大学英语图表作文范文1. The bar chart shows the percentage of students participating in extracurricular activities in a university. It's interesting to see the variation in participationrates among different activities.2. The pie chart illustrates the distribution of majors among undergraduate students. It's clear that the majorityof students are enrolled in the business and engineering programs.3. The line graph depicts the trend of international student enrollment over the past five years. It's evident that there has been a steady increase in the number of international students studying at the university.4. The scatter plot displays the correlation between GPA and hours spent studying per week. It's apparent that students who study more hours tend to have higher GPAs, but there are also outliers that defy this trend.5. The table presents the average class sizes in various departments. It's notable that classes in the humanities department tend to be smaller compared to those in the science and technology departments.6. The heatmap indicates the peak times of library usage throughout the day. It's clear that the library is most crowded during the late afternoon and evening hours.7. The radar chart showcases the skills and competencies developed by students through internships.It's impressive to see the diverse range of skills that students have acquired in areas such as communication, problem-solving, and teamwork.8. The histogram displays the distribution of student grades in a particular course. It's evident that the majority of students fall within the average grade range, with a smaller number of students achieving high or low grades.9. The box plot illustrates the variability in student performance on a standardized test. It's interesting to see the range of scores, as well as any outliers that may indicate exceptional performance or areas for improvement.10. The area chart shows the allocation of university funding across different departments. It's clear that a significant portion of the budget is allocated to research and development, reflecting the university's commitment to academic excellence.。
英语作文图表作文(五篇范文)

英语作文图表作文(五篇范文)第一篇:英语作文图表作文图表分析作文1As is clearly shown in the table/ figure/ graph / chart, 图表总体描述 between 年代 and 年代.Especially, 突出的数据变化.There are three reasons for 具体表示急剧上升、下降或特殊现象的词.To begin with, 原因一.In addition / Moreover, 原因二.For example, 具体例证.Last but no least, 原因三.In short,总结上文.As far as I am concerned, / For my part, / As for me,作者自己的观点.On the one hand, 理由一.On the other hand, 理由二.In brief,总结上文.图表分析作文2The table / figure / graph / chart shows that 图表总述from 年代to年代.It is self-evident that突出的数据变化.Three possible reasons contribute to 具体表示急剧上升、下降或特殊现象的词或代词代替上文内容.One reason is that原因一.Another reason is that 原因二.For instance,举例证.What’s more原因三.As a result, 重述上文之趋势.However, in my opinion 作者观点.For one thing,理由一.For another, 理由二.T o sum up,总结上文.图表分析作文3It can be seen from the table / figure / graph / chart that图表总述between年代and年代.Especially,突出的数据变化.Why are there such great changes during 图表涉及的年头数years? There are mainly two reasons explaining具体表示急剧上升、下降或特殊现象的词或代词代替上文内容.First,原因一.In the old days,比较法说明过去的情况.But now,说明现在的情况.Second,原因二.As a result,总结上文.In my viewpoint,作者自己的观点.On the one hand,论点一.On the other hand,论点二.图表分析作文4As the table / figure / graph / chart shows,图表总述in the past years年代.Obviously,突出的数据变化.Why are there suchsharp contrasts during 图表涉及的年头 years?Two main factors contribute to具体表示急剧上升、下降或特殊现象的词或代词代替上文内容.First of all,原因一.In the past,比较法说明过去的情况.But now 说明现在的情况.Moreover,原因二.Therefore,总结上文.As I see it,作者自己的观点.For one thing,论点一.For another,论点二.图表作文补充句型• As is shown in the graph…如图所示…•The graph shows that…图表显示…•As can be seen from the table,…从表格中可以看出…•From the chart, we know that…从这张表中,我们可知…• All these data clearly prove the fact that… 所有这些数据明显证明这一事实,即…• The increase of ….In the ci ty has reached to 20%.….在这个城市的增长已达到20%.• In 1985, the number remained the same.1985年,这个数字保持不变.• There was a gradual decline in 1989.1989年,出现了逐渐下降的情况.第二篇:英语图表作文图表描述专题训练(一)这类作文时,注意以下几点:第一,审题时,除了要把握好图表的表层信息外,还要分析图标的深层含义,如原因、根源、可能的发展趋势等。
英语图表作文实用模板
实用图表描述专题训练〔一〕这类作文时,注意以下几点:第一,审题时,除了要把握好图表的表层信息外,还要分析图标的深层含义,如原因、根源、可能的开展趋势等。
图表中所提供的说明文字往往是问题的切入点,一定要仔细分析。
第二,描述数据时要抓住重点,为中心效劳,不必面面俱到,切忌毫无目的地罗列图表中的数据。
如果数据较多,抓住图表中的极端点〔如最大或最小、最多或最少,最好或最差〕和根本相同进行描述。
第三,主题句应明确,最好放在文章的开头,这样会使重点突出,主题明了。
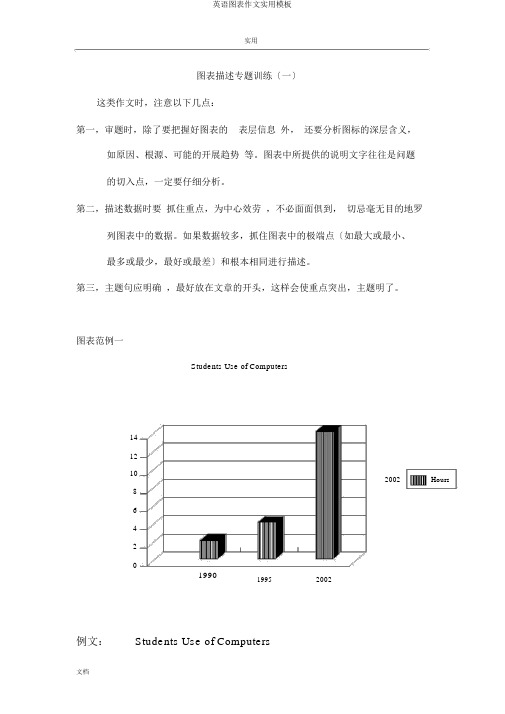
图表范例一Students Use of Computers1412102002Hours 8642199019952002例文:Students Use of Computers提纲: 1. 上图所示为某校大学生平均每周使用计算机的时间:年 (14 1990 年〔 2 hours 〕, 1995 年 (4 hours), 2002hours) ,请描述其变化;2.请说明发生这些变化的原因〔可从计算机的用途、价格或社会开展等方面加以说明〕;3.你认为目前大学生在计算机使用中有什么困难或问题。
参考范文 (1)Student Use of ComputersAs is clearly shown in the chart,the number of hours students spent on computers increased from two to four hours per week from 1990 to 1995. Especially, the number roseto about 14 hour per week in 2002.There are three factors leading to the change.To begin with, the price of computers is getting much lower than beforeso that many students can afford it.In addition,it is very convenient for us to study with the help of computers.For example, e-mails enable us to keep in touch with our teachersand friends. Last but not least, with fast development of themodern society,a computer has become a must for many people.To sum up, low price, convenience and wide use contribute to the increase in the use of computers.As for me,student use of computers is a double-edged sword. On the one hand, it is a good helper in searching for information,drawing pictures,etc.One the other hand, various computer games might distract students from their studies. In brief, computers can serve us well if they are used inthe right way.学生使用电脑如图表所示,学生花在电脑上的时间从每周1995 小时增加到四小时,从 1990 小时增加到了 12 小时。
大学英语四级作文模板:图表类作文
大学英语四级作文模板:图表类作文大学英语四级作文模板:图表类作文想要写好英语四级作文,背一些作文模板是很重要的,下面店铺为大家带来了图表类作文的四级作文模板,希望能够帮助到大家。
(1)英语四级作文模板According to the chart / graph / diagram / table, we clearly learn that _________. As early as _________,___________. Then,_________. Last,__________. In contrast, by _________,__________.There are many reasons accounting for _________. Firstly, _________.Secondly,__________. Finally,_________. As a result,_________.As far as I am concerned,_________. For one thing,__________. For another,________. In brief, I hold that__________.(2)英语四级作文模板What is shown in the chart / graph / diagram / table above indicates that in recent years, more and more people pay attention to _________. The number of those who _________ has increased ________, and furthermore,____________.There are two factors responsible for the changes. In the first place,_________. Moreover,__________. Yet, it is noticeable that __________.From the analysis, we can safely draw the conclusion that__________. It is possible that in the future, the tendency will__________.(3)英语四级作文模板It is obvious in the graph/table that the rate/number/amount of Y has undergone dramatic changes. It has gone up/grown/fallen/dropped considerably in recent years (as X varies). At the point of (接近)X1, Y reaches its peak value of (多少).What is the reason for this change? Mainly there are (多少)reasons behind the situation reflected in the graphic/table. First of all, (第一个原因). More importantly, (第二个原因). Most important of all, (第三个原因).From the above discussions, we have enough reason to predict what will happen in the near future. The trend described in the graph/table will continue for quite a long time (if necessary measures are not taken括号里的`使用于那些不太好的变化趋势).。
英语图表作文模板及范文(通用12篇)

英语图表作文模板及范文(通用12篇)(经典版)编制人:__________________审核人:__________________审批人:__________________编制单位:__________________编制时间:____年____月____日序言下载提示:该文档是本店铺精心编制而成的,希望大家下载后,能够帮助大家解决实际问题。
文档下载后可定制修改,请根据实际需要进行调整和使用,谢谢!并且,本店铺为大家提供各种类型的经典范文,如工作总结、工作计划、合同协议、条据文书、策划方案、句子大全、作文大全、诗词歌赋、教案资料、其他范文等等,想了解不同范文格式和写法,敬请关注!Download tips: This document is carefully compiled by this editor. I hope that after you download it, it can help you solve practical problems. The document can be customized and modified after downloading, please adjust and use it according to actual needs, thank you!Moreover, our store provides various types of classic sample essays for everyone, such as work summaries, work plans, contract agreements, doctrinal documents, planning plans, complete sentences, complete compositions, poems, songs, teaching materials, and other sample essays. If you want to learn about different sample formats and writing methods, please stay tuned!英语图表作文模板及范文(通用12篇)英语图表作文模板及范文第1篇The table/chart diagram/graph shows (that)According to the table/chart diagram/graphAs (is)shown in the table/chart diagram/graphAs can be seen from the table/chart/diagram/graph/figures,figures/statistics shows (that)……It can be seen from the figures/statisticsWe can see from the figures/statisticsIt is clear from the figures/statisticsIt is apparent from the figures/statisticstable/chart/diagram/graph figures (that)……table/chart/diagram/graph shows/describes/illustrates图表类英语作文范文The past years have witnessed a mounting number of Chinese scholars returning from overseas.As is lively illustrated by the column chart, the number of returnees climbed from a mere thousand in 20XX to over thousand in 20XX, at an annual increase rate of around 50%.A multitude of factors may have led to the tendency revealed by the chart, but the following are the critical ones from my perspective.First and foremost, along with the development ofChinese economy and society, the number of Chinese studying abroad has been soaring in the past years, which has provided an eXpanding base for the number of returnees.In the second place, the government has enacted a series of preferential policies to attract overseas Chinese scholars back st but not least, the booming economy, science and technology in this country have generated more attative job opportunites for scholars returning from overseas.The waves of returnees will definitely contribute to this nation’s development, since they have brought back not only advanced science and technology but also pioneering concepts of education and management.With more scholars coming back from overseas, and with the concerted efforts of the whole nation,we have reasons to eXpect a faster rejuvenation of this country.更多培训课程:苏州个人提升英语更多学校信息:苏州虎丘区朗阁教育机构咨询电话:英语图表作文模板及范文第2篇Students tend to use computers more and more frequently nowadays.Reading this chart, we can find that the average number of hours a student spends on the computer per week has increased sharply.In 1990, it was less than 2 hours; and in 1995, it increased to almost 4 hours, and in 2000, the numbersoared to 20 hours.Obviously computers are becoming increasingly popular.There are several reasons for this change.First,computers facilitate us in more aspects of life.Also, the fast development of the Internet enlarges our demands for using computers.We can easily contact with friends in remote places through the Internet.Besides, the prices of computers are getting lower and lower,which enables more students to purchase them.However, there still eXist some problems, such as poor quality, out-of-date designs and so on.And how to balance the time between using computers and studying is also a serious problem.Anyhow, we will benefit a lot from computers as long as we use them properly.英语图表作文模板及范文第3篇As can be clearly seen from the graph/table/chart (As is shown in the table/figure), great changed have taken place in_______,The_________have/has skyrocketed/jumped from _____to _____.When it comes to the reasons for the changes,different people give different eXplanations.Here I shall just give a begin with, ______What’s more,___________, Last but not least, ________.While it is desirable that ___________,there are still some problems and difficulties for __________Firstly, __________,In addition, __________,In a word, __________.以上就是为大家整理的英语专四图表作文范文模板,希望能够对大家有所帮助。
英语四级图表作文讲解及参考范文

英语四级图表作文讲解及参考范文图表作文也是四(六)级考试中常见,而且被认为是一种较难的作文形式。
图表作文就是把非文字信息(通常为各种图表表示的数字信息等)转换成文字信息的一种作文。
它要求我们用文字来描述非文字性的图表或对图表显示的关系作解释说明。
第一节图表作文的出题形式和写作要领一、图表作文常见出题形式图表作文一般在题目中给出作文的标题和一个或几个统计表格、圆形图、曲线图或条形图,有时还用英文或中文提纲的形式给出提示,要求我们:1)用文字描述图表,客观解释图表中所传递的信息,并找出某种规律或趋势;2)就图表中所反映的某种趋势或问题分析其原因或后果。
图表作文着重说明事实,常常是通过对图表中所反映的具体数据的说明、分析、比较,对某种事物或现象的事实或变化情况等加以说明,并提出结论或看法。
因此,图表作文常常采用议论文体的写作方法。
写好图表作文,关键在于能否读懂图表中所提供的信息,把握各信息间的联系,用准确流畅的语言把这一信息表达出来,并就这一信息发表自己的看法。
二、图表作文的写作步骤写图表作文时,要注意遵循以下步骤:1)认真分析图表的含义,弄清图表中所含的信息及不同信息间的关系;2)确定文章的主题思想,构思出文章的基本框架,筛选出能说明图表主题思想的典型数据;3)编列文章的提纲;4)根据文章的提纲,将各段的提纲内容扩展成段落,然后将各个段落组成文章,注意段与段之间的衔接与过渡;5)检查与修改。
三、图表作文的篇章结构写图表作文时,常采用三段式的陈述方式。
文章的第一段往往分析图表中的数据变化反映什么问题或趋势,概述图表所揭示的信息。
第二段分析造成这一问题或趋势的原因。
第三段则展望未来的情况或提出解决问题的办法或建议。
这一结构可以简单地表述为:第一段:概述图表反映的主题思想(总趋势+极端值+特点,时态)第二段:分析产生的原因第三段:展望未来或提出方法或建议模板一①总的趋势②图表具体描述③剖析图表所揭示的含义④理由一⑤理由二⑥理由三⑦理由四⑧总结⑨前景预测As can be seen from the table, the past decade has witnessed dramatic changes in①______. While ②_______. It is obvious from the table that③_________.What contributed to these changes? I think the reasons are as follows. To start with, ④______. Secondly, ⑤______ . What’s more, ⑥ _______. Last but not lease, ⑦________.In conclusion, ⑧_________. Moreover, ⑨ ________.模板二①描述图表②分三方面解释原因③下结论1) During the period from _______to _______, ________rose from ________to _______, while _______ decreased from _______ to _______.2) We believe that three reasons can account for this phenomenon. First,____. Second, ____. Third, _____.3) ___.We are happy to see that things are becoming better and better nowadays. We can imagine that ___.模板三①描述图表②解释图表③补充解释1) During the period between _______ and ________, ________ declined abruptly from _______ to ________, while ________ increased sharply from ________ to _______.2) Several reasons can account for this phenomenon. Compared with _________ is much cheaper and more convenient__________ . Apart from that, _________.3) However, there are still a number of people who _________, generally for two reasons. On the one hand,________. On the other hand, ________.范文: Film Is Giving Way to TV1. 电影观众越来越少2. 电视观众越来越多,因为……3. 然而,还是有人喜欢看电影,因为……1.图表类型:table 表格; chart 图表; diagram图表或图解,示意图; graph图表, 曲线图; column/ bar chart柱状图; pie graph饼图2. 描述:show; describe; illustrate; can be seen from; clear; apparent; reveal 显示; represent表现, 描绘3.内容:figure数字; statistic统计值; statistics [用作复]统计, 统计数字[资料], 统计表number; percentage; proportion●表示数据上升:increase, rise, ascend, core, surge, go up, climb, mount, level up下降: decrease, fall, drop, descend, decline, reduce ,lessen, level, down平稳: stable, steady, remain steady/stable; /maintain/keep/be the same as/similar to ; little/hardly any /no change波动: fluctuate, fluctuation, rise and falls, up and down占: occupy, take up, account for, gain而: while, however, whereas , on the other hand, actually/in fact相比: by contract, on the contrary, likewise, compared with最高点: the highest, the top, the summit, the peak, the most最低点: bottom, less, least, rock bottom最低点例句Prices have hit rock bottom. 价格已达最低水平平均: mean平均值, average趋势: tendency, trend, inclination预见: prediction达到顶峰: mount to比例:20 per cent , 20%one in three, 1/3one out of every four, 1/4有一个稳定的过程: a stable period can be seen表示变化程度的词:sudden/suddenly 突然的,意外的rapid/rapidly 迅速的,飞快的,险峻的 dramatic/dramatically 戏剧性的,生动的significant/significantly 有意义的,重大的,重要的sharp/sharply 明显的,急剧的steep/steeply 急剧升降的steady/steadily 稳固的,坚定不移的gradual/gradually 渐进的,逐渐的slow/slowly 缓慢的,不活跃的 slight/slightly 轻微的、略微地stable/stably 稳定的表示范围:from…to… between…and… for …to …多长时间直到表示程度:almost adv. 几乎,差不多nearly adv. 几乎,密切地approximately adv. 近似的,大约just over 刚超过exactly adv. 正确地,严密地precisely adv. 正好精确地;清晰地●常用词和短语significant changes 图中一些较大变化noticeable trend 明显趋势during the same period 在同一时期grow/grew 增长distribute 分布,区别unequally 不相等地pronounced 明显的average 平均no doubt 无疑地corresponding adj. 相应的,通讯的represent vt. 阐述,表现overall 体上讲except 除外in the case of adv. 在…的情况下in contrast 相反,大不相同in conclusion adv. 最后,总之in comparison 相比之下inversely adv. 相反地,倒转地in general 通常,大体上,一般而言rang from…to 从…到…不等excessive adj. 过多的,过分的,额外lower v. 降低,跌落elapse vi. (时间)过去,消逝category n. 种类government policy 政府政策market forces 市场规律measure n. 尺寸,方法,措施 v.估量,调节forecast n. 先见,预见表示程度的副词:1.)程度较大:considerably dramatically greatly markedly obviously quickly rapidly sharply significantly suddenly2)程度较小:slightly gradually slowly steadily四、图表作文常用的句型(1)常用的开篇句型(即概述图表内容时常用的表达法)① According to the table/pie chart/line graph/bar graph, we can see/conclude that …根据该表/图,我们可知……② The table/graph reveals (shows/indicates/illustrates/ represents/points out) that …该表/图表明……③ As we can see from the table …As can be seen from the line/bar graph …As is shown (illustrated/indicated) in the pie chart …如表/图所示,……(2) 描述增减变化常用的句型① Compared with … is still increased by …② The number of … grew/rose from … to …③ An increase is shown in …; then came a sharp increase of …④ In … the number remains the same/drops to …⑤ There was a very slight (small/slow/gradual) rise/increase in 1990.⑥ There was a very steady (marked/sharp/rapid/sudden/ dramatic) drop(decrease/decline/fall/reduction) in 1998/ compared with that of last year).来看一篇范文:⑴From the graph, we can see that the number of car accidents in Walton city fluctuated during the year of 1990. ⑵The first two months of 1990 showed an increasing trend. ⑶The rate rose to 32 in March but fell to 26 in June. ⑷From June on, the rate was rising again and reached the peak point 39 in August. ⑸After August the rate began to decline remarkably, and eventually dropped to the lowest point 16 at the end of the year. ⑹Therefore, it’s obvious that car accident in Walton city declined in 1990.⑴主题句/概述表格反映的内容⑵—(5)反映交通事故的变化情况(6)小结:总结表格数据反映的总趋势⑺There are several reasons for the decline. ⑻First, a new traffic law was made and came into force. ⑼It provided that in summer every car must be air-conditioned. ⑽As a result, the highest rate in August, when humidity and high temperature make drivers impatient and easily lead to car accidents, dropped steadily. ⑾Second, new roads were built and some narrow streets were widened, which quickened the flow of traffic. ⑿Finally, the city administration made great efforts to heighten people’s awareness of observing traffic rules.⑺主题句⑻原因/措施一⑼解释措施一/次要辅助⑽采取措施一后的结果⑾原因/措施二⑿原因/措施三⒀With all these new measures, I’m sure the rate of car accidents in Walton city will go on falling this year.⒀总结:展望未来的情况第二节图表作文样题与样文举例样题一:Directions: For this part, you are allowed 30 minutes to write a composition on the topic How People Spend Their Holidays. You should write at least 120 words, and base your composition on the table and the outline given below:1、根据上表,简要描述1990年、1995年、2000年某城市人们度假方式的情况及其变化;2、请说明发生这些变化的原因;3、得出结论。
- 1、下载文档前请自行甄别文档内容的完整性,平台不提供额外的编辑、内容补充、找答案等附加服务。
- 2、"仅部分预览"的文档,不可在线预览部分如存在完整性等问题,可反馈申请退款(可完整预览的文档不适用该条件!)。
- 3、如文档侵犯您的权益,请联系客服反馈,我们会尽快为您处理(人工客服工作时间:9:00-18:30)。
图表作文
图表作文体裁介于说明文和议论文之间。
图表作文的题型实质上属于“受控制作文”的范畴。
考生在作文中涉及的主要信息是由试题提供的,“信息源”是试题的表格、图形等,当然也会有些简单的文字说明附在图表上。
这类试题一般要求考生用英文对图表中的数据、图像等所提供的信息作客观叙述,并且加以分析理解,然后得出正确结论或做出简短评论。
在进行图表作文之前,必须认真地审题,吃透要求,研究图表所传递的所有信息。
图表上方或下方的文字通常是其主题,而图表中的文字和说明实质上就是作文中的关键词。
只有在深入研究和透彻理解所提供信息的基础上进行分析、比较,发表看法和下结论时,才不易出差错。
千万不要因为赶时间而匆匆动笔。
下笔之前,应在纸上列出提纲,保证文章有条理,确保内容符合题目要求,没有遗漏。
图表作文一般分为三段,第一段通常阐述主题并描述图表的客观概况。
第二段对图中最有意义或最重要的信息进行描述、归纳或分析说明其原因。
第三段写出结论或评论,有的时候会提出解决问题的方法。
图表主要有以下几种样式:表格、圆形图、条形图及曲线图。
图表写作常用的句型
图表所表示的内容可以千百万化,但“万变不离其宗”,超不出这几种基本图型,因此考生记住一些常用的句型是有必要的,以免应试时搜肠刮肚。
在写作时,可以运用以下句型: 句型Ⅰ
the
句型Ⅱ
It can be seen from the
...
句型Ⅲ
The
句型Ⅳ句型Ⅴ
句型Ⅵ
表格
表格(Table)是人们最熟悉的图表,其最大特点是使大量的数据分门别类地系统化,直观易读,有利于进行各类有关数据的比较。
表格的主要组成部分为:表名 (Title)、表头 (Box head)、侧目 (Stub) 和主体 (Body)。
例如:
The Female Disadvantages
Adult Literacy Rate
Life
Expectancy
Wages as
XXX% of
Men’s
Egypt 37% 65 years 68 Hong Kong 87% 82 years 69
South Korea 96% 75 years 50
表名:The Female Disadvantages
表头:Adult Literacy Rate, Life Expectancy, Wages as XXX% of Men’s
侧目:Egypt, Hong Kong, South Korea
主体:有关数据
阅读表格时,要从纵向和横向获取信息,找出各项目间的关系,以及各数据的异同、变化或规律。
正如表名所示,表格的内容是谈妇女的不利情况,从表头上可以看出:成人识字率;期望生存寿命;与男子相比的工资情况。
侧目告诉我们有关国家(地区)的名字。
通过比较,可以看出妇女受教育程度,最高为韩国,最低为埃及。
期望寿命最长为香港,最短为埃及。
在收入上,香港妇女的工资为男子的69%,名次最高,韩国妇女为男子的50%,名次最低,埃及比香港只低一个百分点,比较接近。
这些仅仅是表层的直观的信息,常常只是写作的第一步,考生应按试题要求去挖掘深层的信息,这深层信息对于得分的高低影响很大。
从上面图表中,我们可以提取出在这三个国家(地区)之间的共同点:妇女仍然受到不平等的待遇,这集中反映在受教育和工资收入上。
韩国妇女虽然识字率很高,但工资收入比率最低,这也说明该国妇女地位仍然不高。
基本状况最差的要算埃及妇女:识字率最低、期望寿命最短。
如有必要,我们可以就这些事实发表自己的感想,如真正的男女平等还有很长的路要走,妇女连经济上的平等也得不到的时候,政治上的平等只能是奢谈……在图表作文中,“深层信息”主要是通过应试者的分析、比较来提取,这种素质的形成非一日之功,其实,只要我们肯多动脑筋,善于从多角度去观察、分析试题提供的信息,拓宽自己的思路,总会发现还是“有话可说”的。
请看一位学生根据上面表格写成的短文:
Are Women on an Equal Footing with Men?
Are women nowadays on an equal footing with men? Before we arrive at a conclusion, let us examine the information available in the table.
As shown in the table, the life expectancies of the three countries or regions (Egypt, Hong Kong and South Korea) are all over sixty years, but there is a huge gap between those of the industrialized country or region and that of the developing country Egypt. South Korean women can expect to live a life ten years longer than that of Egyptian women, and Hong Kong women will enjoy a life-span seventeen years longer than that of Egyptian women. In terms of adult literacy, the women of South Korea have the highest rate of 96%, the women of Hong Kong have a rate of 87% and Egyptian women are the most unlucky with a rate of 37%! The most striking disadvantage of women is the wages they receive. The women of Hong Kong receive 69 percent of the wages as paid to men; the women of South Korea are the most hit:their pay is only half as much as men’s.
From the information above, we can conclude that the status of women is not quite satisfactory. Women are still faced with various kinds of disadvantages, education and pay in particular. “Equal right for women” remains an empty promise. There is still a long, long way to go before women are really on an equal footing with men.
该短文是典型的“三段论”。
引言段以设问开始,但并没有作回答,只是为导入表格的信息作铺垫。
第二段重点介绍表格的内容,条理清楚,句式也有变化。
在结尾段里,作者提出自己的看法,同时也解答了短文开头的设问。
在英语短文试题中,如果是图表题,图表所含的信息量不会太多,图表本身也不会太复杂难懂,其真正的难点是挖掘图表背后的深层的信息,即该图表要揭示什么。
只要仔细阅读图表,拓宽思路,就一定能正确理解所给信息之意图,发现问题并予以评论,更或可以指出解决之道。