雅思常见饼图的整理分类
雅思作文写作Task1第二课时—柱状图和饼状图汇总
图表作文讲解2:柱状图和饼状图学生面授老师时间本次课时雅思写作第二课时教学思路1.作文简介、写作技巧2.实例讲解3.分析总结4.课后作业教学目标柱状图、饼状图知识点讲解基本特征和写作方法实例分析讲解重点写作技巧讲解范文学习柱状图和饼状图写作方法备考资料剑桥IELTS4-8教学详细内容:一、写作技巧详解1.柱状图特点柱状图是动态图表,切入点是描述趋势。
柱状图写作注重“比较”(找出similarity)和“对比”(找出difference),也就是说需要横向总结所有柱状图表的共性特征,也要分别描写各个柱子的个性特征。
两种写作方式:其一是对不同时间段内的数据进行比较,适合于数据代表的物体较少且时间界限明确的情况。
另外是对单独数据的全程描述,适合于描述数据对象很多且时间划定不清晰的情况。
2.饼状图特点饼形图与柱形图或者线形图所截然不同的是它没有了横轴与纵轴,而以饼形的分割来表示百分比,可以依照三步审题分析法来进行观察:观察共有几张饼状图,以及它们之间的关系是什么(一般说来,雅思图表题中极少见到单饼图);观察每张饼状图中有哪几个区域,以及各个区域分别代表什么;观察单个饼状图中各区域间的百分比差异,以及相同区域在各个饼状图间的百分比的比较或发展。
饼状图是所有图表题中最好写的一种,唯一值得注意的地方在于如何丰富百分比的表达和“占”的表达,要采取多样性的表达,如25%=a quarter of, 50%=half of, >50%=a/themajority of.描写饼状图中的比例构成就是饼状图图表作文的重点,但也应注意,这种描述并不是对图形的简单重复,对各项数据比例的描述应建立在归纳整理的基础上有条理地进行。
学生不仅要善于找数据,更重要的是要善于从数据或比例中升华出来,找到规律和本质。
常用词汇、句型及模板1.柱状图1)倍数的表达今年的产量是去年产量的两倍The output this year is two times(twice) more than last year’s.As much as 不可数名词 as many as 可数The books of this semester are two times as many as that of last semester.A is two times the amount of B不可数A is two times the number of B可数2) 常用套句There was …in the number of A from …to … (over next years), which was followed by … and then… until…when there was … for the next … years.From…onwards, there was … in the number of A which then increased / decreased … at …% in …In …, the number reached (was) …%, but (30) years later there was …The number of A increased rapidly from … to … during the (five-year) period.In the (three years) from … through…, the percentage of A was slightly larger / smaller than that of B.The graphs show a threefold increase in the number of A.Here is an upward trend in the number of A.… (year) witnessed / saw a sharp rise in A.2.饼状图1)常用词:percentage, proportion, make up, constitute, account for, take up, ..isdivided into…parts, consume the largest/smallest portion.2)例句:The graph, presented in a pie chart, shows the general trend in…..The percentage of A in … is more than twice tha n that of B.The biggest loss was to A area.There is not a great deal of difference between A and B.In general positions, females outnumber males.A much greater percentage of men than women are found in managerial positions.The profit of company A doubled from May to September.3)模板:The two pie charts describe ………………………The first point to note is …………………………Comparing the graphs, …………………………….The graphs also suggest that ………………………In conclusion, it can be seen from the data that …………………..4)饼状图作文模型The two pie charts illustrate the significant changes in people’s ways of communication from 1970 to 1995.The first graph shows that in 1975, the most popular way to communicate was letterwriting, with the percentage of 50%. Others ___________________________, the figures are 32% and 18% respectively.It can be seen from the second graph that ways of communication changed a lot intwo decades. By 1995, ______________________________. By contrast,________________________________.Comparing the two pie charts, we can see that the use of the phones and computersduring the same period had both risen considerably. However, letter writing became less popular among the people.In general, people inclined to use more modernized mediums to communicate withothers, while the traditional way became less employed.The pie chart depicts the proportion of ___________________________. It consistsof six segments, the largest one representing _________, which account for 26% ofthe total. _____________ takes up 21%, becoming the second largest.__________________________________. The rest proportions, 15% of all, constituting 5% and 10% respectively.From the chart it can be seen clearly that ________________________.二、实例分析分析思路:1.第一幅柱状图的描述单位是百万,即人数;第二幅则是百分比。
雅思写作预备4——饼图+表格31页PPT

48、法律一多,公正就少。——托·富 勒 49、犯罪总是以惩罚相补偿;只有处 罚才能 使犯罪 得到偿 还。— —达雷 尔
50、弱者比强者更能得到法律的保护 。—— 威·厄尔
61、奢侈是舒适的,否则就不是奢侈 。——CocoCha nel 62、少而好学,如日出之阳;壮而好学 ,如日 中之光 ;志而 好学, 如炳烛 之光。 ——刘 向 63、三军可夺帅也,匹夫不可夺志也。 ——孔 丘 64、人生就是学校。在那里,与其说好 的教师 是幸福 ,不如 说好的 教师是 不幸。 ——海 贝尔 65、接受挑战,就可以享受胜利的喜悦 。——杰纳勒 尔·乔治·S·巴顿
谢谢!
雅思小作文饼图写法全解析

雅思小作文饼图写法全解析雅思小作文饼图写法全解析无论是身处学校还是步入社会,大家都写过作文吧,作文根据体裁的不同可以分为记叙文、说明文、应用文、议论文。
你知道作文怎样写才规范吗?以下是店铺为大家收集的雅思小作文饼图写法全解析,仅供参考,希望能够帮助到大家。
雅思小作文饼图写法全解析在雅思的学术类小作文中我们经常会遇到饼状图写作,不要看着一张一张的图,就退缩了,但是相对来说,这个题型还是比较容易写的一种图形,不过学生们也一定不要当做这是一件简单的事情,想要拿高分还是需要努力的,千万不能掉以轻心,否则不要就是因为这部分得分的不达标而影响到最后的综合得分。
那么下面的文章中,朗阁雅思考试研究中心写作组的专家将要探讨的是饼图中静态数据和动态数据写法中的一些区别,并且将会从高分的角度来对各种写法作一汇总,希望对大家考试的准备有一定的帮助。
首先我们必须搞清楚什么是静态什么是动态数据的饼图:当我们在考试中看到这个图示上的数据都是固定的,没有发生任何变化的时候,那么就能够认定这属于静态数据,搞清楚之后我们就能够开始写作了。
图二:不要以为这里有很多的数据就属于动态的,其实这个图示还是表示是静态的,因为我们看到在途中的各项比重相对来说也是比较稳定的,因此这个饼图的数据也是属于静态的,那么究竟哪种数据属于动态的呢?图三:这个就是动态的图示,为什么这么说呢,因为两张图种的占比数据上出现了很大的差异,这是两个年份的数据,但是各自的所占比重有所不同,所以是动态的数据。
由此,我们可以得出结论,如果我们看到的是一张饼图,而且描述的是一段时间之内比较稳定的数据,那么我们就能基本上断定那就是静态的数据,但是我们如果看到的时候两张饼图,在两个时间段时间的对比,数据出现了明显的变化,那么就能够基本上断定这张图表示的就是动态的题型。
一、静态数据饼图的'主体段写作理论朗阁雅思考试研究中心建议考生可先按照扇形面积大小从大到小排列数据,若遇到饼图中有总数的描述,宜在开头先写。
雅思小作文饼图常用词汇、万能句型、范文整理
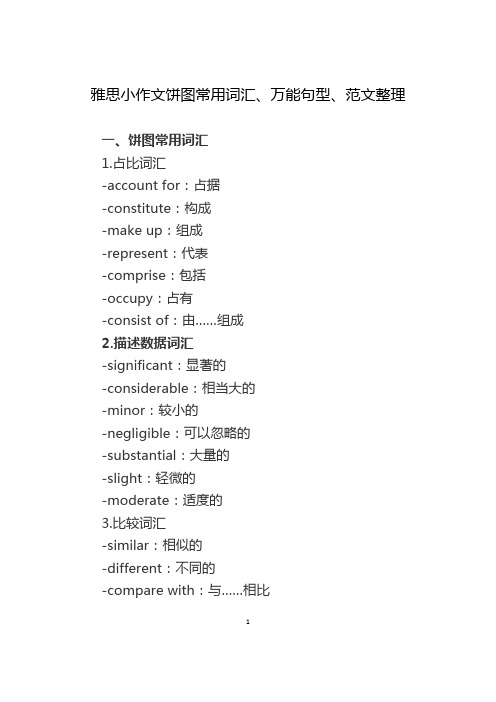
雅思小作文饼图常用词汇、万能句型、范文整理一、饼图常用词汇1.占比词汇-account for:占据-constitute:构成-make up:组成-represent:代表-comprise:包括-occupy:占有-consist of:由……组成2.描述数据词汇-significant:显著的-considerable:相当大的-minor:较小的-negligible:可以忽略的-substantial:大量的-slight:轻微的-moderate:适度的3.比较词汇-similar:相似的-different:不同的-compare with:与……相比1-in contrast to:与……形成对比-while:然而-whereas:然而-on the other hand:另一方面4.其他常用词汇-proportion:比例-segment:部分-percentage:百分比-distribution:分布-category:类别-sector:扇形二、饼图万能句型1.开头句型-The pie chart illustrates the proportion of categories in a specific field.-The pie chart provides information about the distribution of various segments.-The pie chart depicts the percentage of different categories in a given context.2.数据描述句型-Category A accounts for a significant proportion of the total, reaching XX%.-XX%of the total is occupied by CategoryB.emiring it the largest segment.2-Category C constitutes a considerable part, comprising XX%of the pie chart.-The proportion of Category D is relatively minor, only accounting for XX%.3.比较句型-In comparison with Category A, Category B has a higher percentage of XX%.-While Category A occupies XX%,Category B represents a larger proportion of XX%.-The distribution of Category C is similar to that of Category D, both comprising XX%.-In contrast to Category A, the percentage of Category B is significantly lower, at XX%.4.总结句型-Overall, the pie chart reveals a clear distribution of categories in the given field.-In summary, the majority of the pie chart is occupied by Category A, followed by Category B.-It can be concluded that Category C and Category D play minor roles in the overall distribution.三、实战演练题目:The pie chart below shows the main reasons for traffic accidents in a particular area. Summarise the3information by selecting and reporting the main features, and make comparisons where relevant.答案:The pie chart illustrates the main reasons for traffic accidents in a specific area. Upon analysis, several key points can be identified.First and foremost, the largest proportion of traffic accidents is caused by driver error, accounting for 45%of the total. This is followed by poor weather conditions, which constitute 25%of the accidents. Vehicle defects and road conditions each occupy 10%of the pie chart, while the remaining 10%is attributed to other factors.In comparison, driver error is the most significant factor, nearly doubling the percentage of poor weather conditions. Meanwhile, vehicle defects and road conditions share the same proportion, both comprising a minor part of the total.Overall, the pie chart reveals that driver error is the primary cause of traffic accidents in the given area, with poor weather conditions being the second most common factor. Other factors, such as vehicle defects and road conditions, play relatively minor roles in the overall distribution.4。
雅思图表写作:饼图(复习)

W Skills
riting
表达-5:
B公司的销售收入 排行第一,约7000 万美元。
B Company tops the list, with a sales figure about $70 million.
统计数据句型
W Skills
riting
表达-6:
中国有13亿人口, 占世界总人口的 五分之一。
China has 1.3 billion people, accounting for one fifth of the world’s population.
统计数据句型
W Skills
riting
表达-7:
十二人有硕士学 位,占职工总数 的四分之一。
There are 12 staff members with master’s degree, making up nearly a quarter of the workforce.
W Skills
实战练习
RITING
饼图写作练手
教材 P217 现在做!(只描述饼图。) Now, work!( 10 minutes )
P217饼图主体段写作示范1
As can be seen from the pie chart, it is thought that the costs of adult education should be shared by three sections: taxpayer, individual and employer. (第一句话综括组成部分,下面细说。) To be more specific, individual (对象-1) should pay (主要趋势) the largest portion, making up (极 值趋势) 40% (极值-最大) of the whole costs. Compared with individual, the proportion of taxpayer (对象-2) is less, (极值-最小) accounting for (极值趋势) 25% (数值). Then, the percentage of employer (对象-3) stands at (主要趋势) the middle of the list, which constitutes (极值-中) 35% (数值).
雅思图表写作饼图(复习)通用课件

练习三:分析并比较不同饼图的数据
总结词
培养数据分析能力
VS
详细描述
提供两张不同的饼图,要求学生对两张饼 图的数据进行分析和比较。学生需要识别 出两张图中各部分的比例差异,分析这些 差异产生的原因,并得出结论。此练习有 助于提高学生的数据分析能力和逻辑思维 能力。
THANKS
感谢观看
如何保证数据的准确性和客观性?
准确客观的数据来源
数据的准确性和客观性是图表写作的基础。要保证数据的准确性,需要从可靠的来源获取数据,并核 实数据的准确性。在引用数据时,需要注明数据的来源,以增加数据的可信度。同时,需要注意数据 的时效性,使用最新的数据能够更好地反映当前的情况。
如何让饼图更加直观易懂?
主题应具有实际意义 ,有助于读者了解该 领域源应具有权威性和可信 度,以确保数据的准确性和可 靠性。
数据来源应具有广泛性和多样 性,以涵盖不同方面的数据, 使饼图更加全面和客观。
数据来源应具有时效性,以确 保数据的最新性和有效性。
数据整理与分类
对数据进行清洗和整理,去除异 常值和重复值,确保数据的准确
合理使用图表元素
饼图是一种常见的图表形式,用于展示数 据的比例关系。要让饼图更加直观易懂,需 要合理使用图表元素。首先,需要选择合适 的颜色和标签,以便于区分不同的数据项。 其次,需要按照数据的大小合理安排扇区的 顺序,以便于读者比较大小关系。最后,需 要在图表中添加必要的说明和标注,帮助读
者理解图表的意义和重点。
雅思图表写作饼图(复习)通用 课件
目录
• 饼图的基本概念 • 饼图的写作技巧 • 饼图写作实例分析 • 常见问题与解答 • 练习与巩固
01
饼图的基本概念
雅思常见饼图的整理分类

动态图
• 主题:美国多种能源 分布
• 类型:图表中出现两 个时间,故判断为动 态图
• 时态:根据所出现时 间判断使用一般过去 时
动态图
• 主题:有关也门和意大利旳 人口年龄分布
• 描述:年龄分布旳对比和变 化趋势
• 时态:能够看到两个时间 2023和2050,所以用一般 过去时和表达将来旳预测
动态图
affected three regions of the world during the 1990s Summarise the information by selecting and reporting the
原因分布以及在各地域
main features, and make comparisons where relevant.
旳分布
• 类型:图表中并没有看 到时间分布,所以是一 片静态图拼图
• 描述:两个图旳内容旳 主要内容都要描述到
• 主题:描述新西兰两个 时间内零售业旳网购销 量
• 类型:看得出是两个时 间段2023和2023,判 断为动态图
• 时态:根据俄事件来判 断使用一般过去时
拼图
The pie chart shows the main reasons why agricultural land
becomes less productive. The table shows how these causes • 主题:农业土地恶化旳
静态图
主题:各行业 类型:只有一种时间点1966,能够判断是静态图 描述:各产业百分比描述 时态:一般过去时
静态图Biblioteka 静态图• 主题:有关青少年看 电视旳同步所做旳娱 乐活动旳问卷调查
雅思写作task 1 饼状图 Pie Chart
练习
• 女生的数量大约是男生的三倍 • The number of girls is about 3 times that of boys • The number of girls is about 3 times as high as boys • The number of girls is about twice higher than boys
P3
• Accommodation and food were the two biggest items of expenditure. Altogether they constituted around 60% of the total students’ expenditure in all the three countries. • The difference is that in country A and B accommodation spending exceeded food spending, while the reverse was true for country C. • 比较较大/最大
P4
• Overall, it is clear that by 2000 these two countries relied on different principal fuel sources: Australia relied on coal and France on nuclear power.
P1
• The charts compare the sources of electricity in Australia and France in the years 1980 and 2000. • Between these years electricity production almost doubled, rising from 100 units to 170 in Australia, and from 90 to 180 units in France. • 三倍triple 四倍quadruple n/adj/v • fourfold adj/adv
- 1、下载文档前请自行甄别文档内容的完整性,平台不提供额外的编辑、内容补充、找答案等附加服务。
- 2、"仅部分预览"的文档,不可在线预览部分如存在完整性等问题,可反馈申请退款(可完整预览的文档不适用该条件!)。
- 3、如文档侵犯您的权益,请联系客服反馈,我们会尽快为您处理(人工客服工作时间:9:00-18:30)。
• 主题:农业土地恶化的 原因分布以及在各地区 的分布 • 类型:图表中并没有看 到时间分布,所以是一 片静态图拼图 • 描述:两个图的内容的 重要内容都要描述到
静态图
主题:各行业 类型:只有一个时间点1966,可以判断是静态图 描述:各产业主题:关于青少年看 电视的同时所做的娱 乐活动的问卷调查 • 类型:没有时间显示, 故判断为静态图 • 描述:各项活动所 占的百分比的描述和 比较
• 时态:一般过去时或 一般现在时
动态图
• 主题:描述新西兰两个 时间内零售业的网购销 量 • 类型:看得出是两个时 间段2003和2013,判 断为动态图 • 时态:根据俄事件来判 断使用一般过去时
拼图
The pie chart shows the main reasons why agricultural land becomes less productive. The table shows how these causes affected three regions of the world during the 1990s Summarise the information by selecting and reporting the main features, and make comparisons where relevant.
动态图
• 主题:美国各种能源 分布 • 类型:图表中出现两 个时间,故判断为动 态图 • 时态:根据所出现时 间判断使用一般过去 时
动态图
• 主题:关于也门和意大利的 人口年龄分布
• 描述:年龄分布的对比和变 化趋势
• 时态:可以看到两个时间 2000和2050,所以用一般 过去时和表示将来的预测
常见饼图的整理分类
饼图分类
确定图的类别: • 只有一个时间的数据就是静态图 • 多于一个时间的数据就是动态图 • 拼图:动态饼图+ 静态饼图+
静态图
主题:世界各地石油产量和石油消耗的比例分布, 类型:没有时间的显示,故判断为静态图 描述:对象的比例分配,不存在趋势的描写 时态:一般现在时或一般过去都可以