常用网络设备巡检命令参考
巡检常用命令CISCO
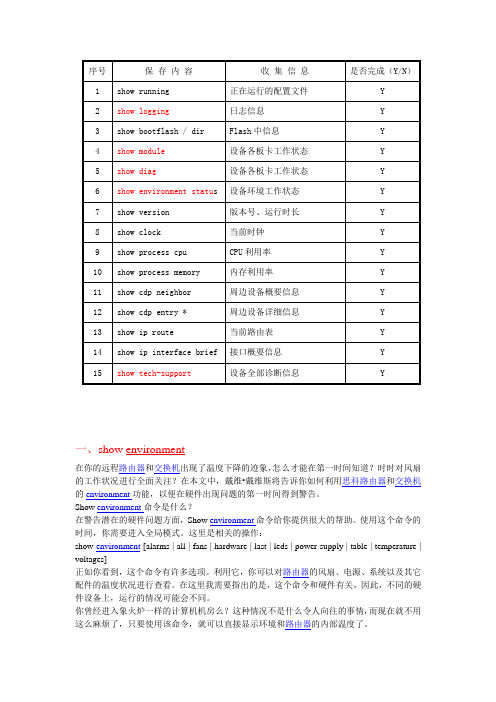
一、show environment在你的远程路由器和交换机出现了温度下降的迹象,怎么才能在第一时间知道?时时对风扇的工作状况进行全面关注?在本文中,戴维•戴维斯将告诉你如何利用思科路由器和交换机的environment功能,以便在硬件出现问题的第一时间得到警告。
Show environment命令是什么?在警告潜在的硬件问题方面,Show environment命令给你提供很大的帮助。
使用这个命令的时间,你需要进入全局模式。
这里是相关的操作:show environment [alarms | all | fans | hardware | last | leds | power-supply | table | temperature | voltages]正如你看到,这个命令有许多选项。
利用它,你可以对路由器的风扇、电源、系统以及其它配件的温度状况进行查看。
在这里我需要指出的是,这个命令和硬件有关,因此,不同的硬件设备上,运行的情况可能会不同。
你曾经进入象火炉一样的计算机机房么?这种情况不是什么令人向往的事情,而现在就不用这么麻烦了,只要使用该命令,就可以直接显示环境和路由器的内部温度了。
下面就让我们看看使用Show environment命令的三个例子。
它们分别基于不同的的路由器和交换机。
思科3845整合服务路由器显示的信息:Router# show environmentSYS PS1 is present.Fan status: NormalInput Voltage status: NormalDC Output V oltage status: NormalType: ACThermal status: NormalSYS PS2 is present.Fan status: NormalInput Voltage status: NormalDC Output V oltage status: NormalType: ACThermal status: NormalAUX(-48V) PS1 is absent.AUX(-48V) PS2 is absent.Fan 1 NormalFan 2 NormalFan 3 NormalFan Speed is NormalAlert settings:Intake temperature warning: Enabled, Threshold: 55Core temperature warning: Enabled, Threshold: 70 (CPU: 90)Board Temperature: NormalInternal-ambient temperature = 35, NormalCPU temperature = 46, NormalIntake temperature = 27, NormalBackplane temperature = 24, NormalV oltage 1(3300) is Normal, Current voltage = 3300 mVV oltage 2(5150) is Normal, Current voltage = 5153 mVV oltage 3(2500) is Normal, Current voltage = 2501 mVV oltage 4(1200) is Normal, Current voltage = 1203 mVNominal frequencyRouter#思科Catalyst 2960交换机显示的信息:switch# show environment ?all Show all environment statusfan Show fan statuspower Show power supply statusrps Show RPS statustemperature Show temperature statusswitch# show environment allFAN is OKTEMPERATURE is OKPOWER is OKRPS is NOT PRESENTswitch#你可以看到,在不同的硬件平台上,Show environment命令的功能是不相同的。
常用网络设备(华为思科港湾HP)巡检命令大全

网络设备安全巡检命令参考为了提高安全巡检工作效率,快速完成对网络设备交换机、路由器和防火墙的例行巡检,建议利用SecureCRT终端登录管理工具及拷贝粘贴批处理命令脚本快速完成网络设备巡检数据采集工作。
客户设备本地或远程登录统一采用SecureCRT工具,对所有巡检客户网络设备预先编辑好登录脚本,方便后期巡检和维护快速登录客户设备。
对要巡检的客户采用以下批处理执行命令快速完成数据采集任务。
在执行以下批处理命令前先使用SecureCRT软件设置log session 到一个新建txt文件,然后选取全部以下命令拷贝粘贴到设备特权模式"#"下,以下命令所显示的信息会自动发送到新建的txt文件里。
目录1CISCO网络设备例行巡检数据采集任务 (3)1.1CISCO交换机 (3)1.2CISCO 路由器 (3)1.3CISCO 防火墙 (4)1.4CISCO网络设备巡检命令解释 (5)2华为网络设备例行巡检数据采集任务 (7)2.1华为交换机 (7)2.2华为路由器 (7)2.3华为网络设备巡检命令解释 (7)3H3C网络设备例行巡检数据采集任务 (7)3.4H3C交换机 (7)3.5H3C 路由器 (7)3.6H3C网络设备巡检命令解释 (7)4港湾网络设备例行巡检数据采集任务 (8)4.7港湾交换机 (8)4.8港湾路由器 (9)4.9港湾网络设备巡检命令解释 (9)5HP网络设备例行巡检数据采集任务 (9)5.10HP交换机 (9)5.11HP 路由器 (9)5.12HP网络设备巡检命令解释 (9)1CISCO网络设备例行巡检数据采集任务1.1 CISCO交换机================================================================== terminal length 0show runnshow vershow ip socketshow ip socket detailshow tcpshow clockshow vtp statusshow vtp passshow env allshow inventoryshow spanning rootshow spanning blockshow spanningshow cdp neishow cdp nei detshow arpshow mac-address-tabledir all-show inter statusshow inter summshow inter | i errors|FastEthernet|GigabitEthernetclear countersshow proc cpu | ex 0.00%show proc memshow debugsh loggingshow ip routeterminal length 451.2 CISCO 路由器===================================================================== terminal length 0show vershow runnshow clockshow tcp brief allshow tcpshow env allshow inventoryshow cdp neishow cdp nei detshow arpdir all-show interfaceshow inter summshow inter | i errors|FastEthernet|GigabitEthernet|Serialclear countersshow proc cpu hisshow proc cpu | ex 0.00%show proc memshow debugshow access-listsh loggingshow ip routeterminal length 451.3 CISCO 防火墙====================================================================== terminal pager 0show runnshow vershow clockshow nameifshow inventoryshow resource usageshow asp dropshow conn countshow xlate countshow firewallshow perfmon detailshow ip audit countdir all-show interfaceshow inter | i errors|FastEthernet|GigabitEthernet|Serialclear countersshow cpu usashow memshow debugshow access-listsh loggingshow routeshow local-hostterminal pager 241.4 CISCO网络设备巡检命令解释====================================================================== 1terminal length 0 ;设置终端显示行数不做限制(使所有show命令完全显示,不做暂停)2show running-config ;查看当前设备配置3show version ;查看IOS版本信息及设备正常运行时间4show clock ;查看设备时钟信息5show tcp brief all ;查看当前设备开发的TCP服务状态6show vtp status ;查看交换机vtp配置模式7show vtp password ;查看交换机vtp配置口令8show env all ;查看设备温度,电源和风扇运转参数及是否报警(注意:中高端设备不带参数all)9show inventory ;调取设备内部板卡出厂模块型号及序列号(可作为资产梳理和设备维保依据)10show spanning-tree root ;查看交换机生成树根位置11show spanning-tree block ;查看交换机block端口12show spanning-tree ;查看全部VLAN生成树信息13show cdp neighbors ;查看邻接cisco设备基本信息14show cdp neighbors detail ;查看邻接cisco设备详细信息15show mac-address-table ;通过查看MAC 地址表信息,确认目的MAC地址是否正确。
H3C设备常规巡检命令
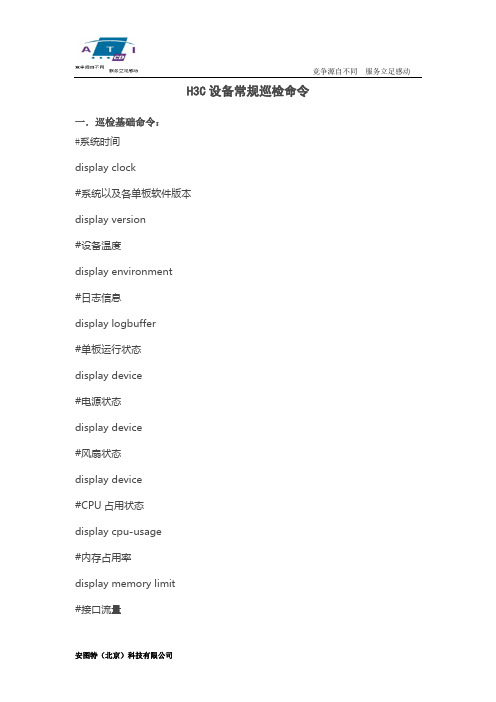
H3C设备常规巡检命令一.巡检基础命令:#系统时间display clock#系统以及各单板软件版本display version#设备温度display environment#日志信息display logbuffer#单板运行状态display device#电源状态display device#风扇状态display device#CPU占用状态display cpu-usage#内存占用率display memory limit#接口流量display interface#接口、链路状态display interface#地址分配display current-configuration interface##路由扩散display current-configuration | include ospf #OSPF(Open Shortest Path First)配置display router id#路由信息display ip routing-table#端口统计数据display ip interface#当前配置文件display current-configuration#保存配置文件display saved-configuration2、脚本—华为display versiondis patch-informationdisplay clockdis dustproofdis frame-typedis healthdisplay cpu-usage display memory display memory limit display devicedisplay device manuinfo display powerdisplay fandisplay voltagedir cfcard2:/dir cfcard:display device pic-status dis switchover state display environment display interface display logbufferdis alarmdis bootrom ethernetdisplay current-configurationdisplay current-configuration interface#display router iddisplay ip routing-tabledisplay ip interfacedisplay ip interface briefdisplay current-configurationdisplay saved-configurationdisplay diagnostic-information3、华为NE40edisplay version 查看VRP版本等信息dis patch-information 查看版本补丁display clock查看时钟dis dustproof防尘网信息Dis frame-type显示NE40E机框类型dis health显示系统资源的使用情况display cpu-usage 查看1分钟CPU利用率display memory查看内存使用情况display memory limitdisplay device查看母板信息。
网络设备巡检

网络设备巡检
网络设备巡检
交换机:
1:查看软件版本信息;
2:查看CPU占用率;
3:查看内存占用率;
4:查看日志缓存区的信息;
5:查看路由表的信息;
6:查看接口的状态(主要有:接口速率,接口工作模式(双工或者半双工),接口模式(trunk,access));
7:查看MAC地址表;
8:查看ARP映射表;
9:查看VLAN信息;
10:查看生成树的信息;
11:查看VRRP协议;
路由器:
1:查看软件版本信息
2:查看CPU占用率
3:查看内存占用率
4:查看日志缓存区的信息
5:查看路由表的信息
6:查看接口状态(接口速率,接口工作模式,CRC出错率,冲突比率,接收广播和组播的比率)
7:查看MAC地址表;
8:查看ARP映射表
9:查看HSRP,VRRP,GLBP协议
防火墙
1:查看软件版本信息;
2:查看CPU占用率;
3:查看内存占用率;
4:查看日志缓存区的信息;
5:查看路由表的信息;
6:查看接口状态(包括:子接口,channel-group,接口速率);7:查看ARP信息;
8:查看的地址的映射关系;
9:查看防火墙的主备切换;。
网络检测三个指令操作方法
网络检测三个指令操作方法
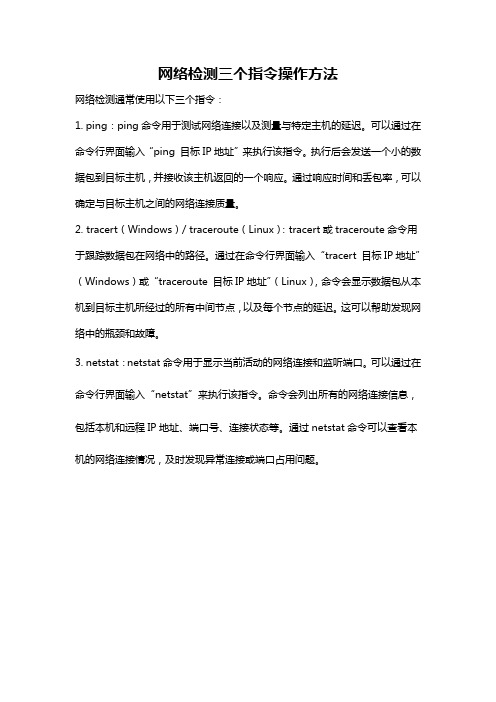
网络检测通常使用以下三个指令:
1. ping:ping命令用于测试网络连接以及测量与特定主机的延迟。
可以通过在命令行界面输入“ping 目标IP地址”来执行该指令。
执行后会发送一个小的数据包到目标主机,并接收该主机返回的一个响应。
通过响应时间和丢包率,可以确定与目标主机之间的网络连接质量。
2. tracert(Windows)/ traceroute(Linux):tracert或traceroute命令用于跟踪数据包在网络中的路径。
通过在命令行界面输入“tracert 目标IP地址”(Windows)或“traceroute 目标IP地址”(Linux),命令会显示数据包从本机到目标主机所经过的所有中间节点,以及每个节点的延迟。
这可以帮助发现网络中的瓶颈和故障。
3. netstat:netstat命令用于显示当前活动的网络连接和监听端口。
可以通过在命令行界面输入“netstat”来执行该指令。
命令会列出所有的网络连接信息,包括本机和远程IP地址、端口号、连接状态等。
通过netstat命令可以查看本机的网络连接情况,及时发现异常连接或端口占用问题。
网络设备巡检命令

----------------------------------------------值得拥有文档值得下载----------------------------精品wor路由器巡检命令terminal len 0 禁用当前会话终端的分页输出功能显示当前时钟show clock显示系统日志状态及本地缓存中的日志信息show logging显示当前运行的软件信息及相关硬件设备信息show version显示当前内存统计信息show memory statistics显示内存利用率历史统计表show memory statistics history显示当前所有进程的内存使用情况show processes memory显示当前所有进程的CPUshow processes cpu 使用情况显示CPUshow processes cpu history 利用率历史统计表显示接口IP地址及状态简表show ip interface brief显示接口统计信息汇总表show interfaces summary显示接口状态及统计信息show interface显示IP协议统计信息show ip traffic显示IP路由协议进程参数和相关统计信息show ip protocols显示活动网络路由协议show protocols显示当前路由表信息show ip route显示Flash空间及文件信息dir列出NVRAMdir nvram: 文件信息显示文件系统信息show file systems显示引导及相关环境变量信息show bootvar显示模块show diag/端口适配器诊断信息----------------------------精品word文档值得下载值得拥有-------------------------------------------------------------------------------------------------------------------------------------------------------------------------------------------------------------------------值得拥有值得下载文档----------------------------精品worshow inventory 显示硬件资产信息,包含槽位、型号和序列号等信息显示电源、风扇、温度等物理运行环境信息show environment显示电源、风扇、温度等物理运行环境信息show env all显示硬件平台信息show platform显示当前运行的配置信息show running-config显示ARP表信息show arp显示用于技术支持的所有系统信息show tech-support交换机巡检命令terminal len 0 禁用当前会话终端的分页输出功能显示当前时钟show clock显示系统日志状态及本地缓存中的日志信息show logging显示当前运行的软件信息及相关硬件设备信息show version显示当前内存统计信息show memory statistics显示内存利用率历史统计表show memory statistics history显示当前所有进程的内存使用情况show processes memory显示当前所有进程的CPUshow processes cpu 使用情况显示show processes cpu history CPU利用率历史统计表显示接口IP地址及状态简表show ip interface brief显示接口统计信息汇总表show interfaces summary显示接口状态及统计信息show interface显示接口缓存相关统计信息show buffers显示IPshow ip traffic协议统计信息----------------------------精品word文档值得下载值得拥有-------------------------------------------------------------------------------------------------------------------------------------------------------------------------------------------------------------------------值得拥有文档值得下载----------------------------精品worshow ip protocols 显示IP路由协议进程参数和相关统计信息显示活动网络路由协议show protocols显示当前路由表信息show ip route显示Flash空间及文件信息dir列出NVRAMdir nvram: 文件信息显示文件系统信息show file systems显示引导及相关环境变量信息show bootvar显示模块/show diag 端口适配器诊断信息显示模块信息show module显示硬件资产信息,show inventory 包含槽位、型号和序列号等信息显示电源、风扇、温度等物理运行环境信息show environment显示电源、风扇、温度等物理运行环境信息show env all显示硬件平台信息show platform显示当前运行的配置信息show running-config显示ARPshow arp表信息显示show mac-address-table MAC地址转发表信息显示VLANshow vlan brief 信息显示VTPshow vtp status状态信息显示生成树协议汇总信息show spanning-tree summary显示生成树协议根网桥信息show spanning-tree root显示生成树协议阻塞端口信息show spanning-tree blockedports显示用于技术支持的所有系统信息show tech-support----------------------------精品word文档值得下载值得拥有-------------------------------------------------------------------------------------------------------------------------------------------------------------------------------------------------------------------------值得拥有值得下载精品----------------------------word文防火墙巡检命令terminal page 0 禁用当前会话终端的分页输出功能显示当前时钟show clock显示系统日志状态及本地缓存中的日志信息show logging显示模块信息show module显示硬件资产信息,show inventory 包含槽位、型号和序列号等信息显示性能show perfmon显示系统资源使用情况汇总信息show resource usage summary显示MAC地址转发表信息show mac-address-table显示用于技术支持的所有系统信息show tech-support华为/H3C设备user-interface vty 0 4screen-length 0 禁用Telnet会话终端的分页输出功能quitdisplay clock 显示系统的日期、时间、时区和夏令时信息display logbuffer 显示日志信息CPUdisplay cpu 的使用状态显示显示内存使用状态display memorydisplay version 显示系统的版本信息display saved 显示已保存的配置信息display device manuinfo 显示设备的制造信息显示风扇工作状态display fan----------------------------精品word文档值得下载值得拥有-------------------------------------------------------------------------------------------------------------------------------------------------------------------------------------------------------------------------值得拥有值得下载----------------------------精品word文档display power显示电源工作状态显示可插拔模块的主要特征参数display transceiver interfacedisplay transceiver manuinfo定制防伪可插拔模块的部分电子标签信息显示H3Cinterfacedisplay brief interface 显示接口概况信息display interfaces 显示接口详细信息显示路由表display ip routing-tabledisplay ip routing-table protocol 显示路由协议信息display ip routing-table statistics 显示路由表统计信息流量统计信息显示IPdisplay ip statistics显示STPdisplay stp信息display diagnostic-information 显示或保存系统当前各个功能模块运行的统计信息user-interface vty 0 4恢复undo screen-length 0 Telnet会话终端的分页输出功能quit----------------------------精品word文档值得下载值得拥有---------------------------------------------------------------------------------------------------------------------------------------------------------------------------。
交换机设备网络巡检
一、检查设备 IOS 软件版本
三、设备 CPU利用率情况检查
四、设备 memory利用状况检查
五、设备系统模块运行状况检查
六、设备运行温度检查
七、设备系统 LOG日志检查
八、设备冗余协议检查
九、VLAN状态检查
十、链路聚合检查
十一、trunk 检查
十二、路由状况检查
十三、生成树 STP检查
十四、接口状态检查
十五、 NAT 检查
一、网络拓扑、拓扑分析、拓扑建议
二、网络带宽、链路类型、链路信息
三、网络设备信息、设备品牌、设备型号、设备放置、设备性能参数、设备内存大小、设备槽位、设备序列号、设备购买年限、设备保修状态、设备备件状况、设备标签完善程度
四、网络设备软件版本信息、当前 IOS 版本信息、最新 IOS 版本信息、设备持续运行时间、设备 IOS 备份情况、设备 CPU利用率、设备内存利用率、设备模块运行状态、设备风扇及电源状况、设备端口数量、设备端口类别、设备端口类型、设备运行机箱温度
五、设备连通性、冗余协议运行状态、 VLAN信息、以太通道信息、路由协议、邻居关系、交换协议、生成树 STP协议、 NAT连接数状态、 FLASH信息、设备配置信息分析、多余配置信息分析、配置精简建议、 IOS 安全建议、防火墙信息、防火墙策略、防火墙 DMZ区检查、防火墙 Xlate 状态、应用业务、 IP 地址使用状况
六、简单机房环境检查。
网络设备巡检常用命令-摘自星球成员马磊分享
⽹络设备巡检常⽤命令-摘⾃星球成员马磊分享H3C交换机:screen-length disabledisplay versiondisplay current-configurationdisplay cpudisplay memorydisplay clockdisplay devicedisplay device manuinfodisplay powerdisplay fandisplay environmentdisplay tcp statusdisplay tcp statisticsdisplay stp region-configurationdisplay irf configurationdisplay irf linkdisplay irf topologydisplay stp rootdisplay arpdisplay mac-adddisplay lldp neighbor-information listdisplay stp briefdisplay stp abnormaldisplay ndpdisplay ospf peerdisplay ospf interdisplay interfacedisplay logbufferdis boot-loaderdisplay ip routing-tabledisplay ip interfacedisplay ip interface briefdisplay startupdisplay boot-loaderdisplay link-aggregation verbose Bridge-Aggregation 901display link-aggregation summarydisplay logbuffer reversemore flash:/logfile/logfile.log进⼊probe模式关闭8号板卡电源probedebug sysm power-down slot 8display process cpu slot 9F5设备F5-console波特率19200bigpipe failover:检查是active还是standby状态bigpipe version:查看系统版本bigpipe list:显⽰设备基本清单bigpipe base :显⽰配置bigpipe interface show:检查端⼝状态bigpipe service show:检查服务状态bigpipe self show:检查⽹络设置bigpipe global show:全局变量bigpipe internal show:内部设置bigpipe trunk show:查看trunkbigpipe stp show:查看STP状态bigpipe summary:查看系统总体运⾏情况统计bigpipe ms:内存使⽤情况bigpipe virtual show:检查virtual server情况who -aH :查看登录信息b platform :显⽰设备平台信息显⽰设备⽇志信息:cat /var/log/messagescat /var/log/bigipcat /var/log/bigddate :显⽰系统时间收集/var/log下⽇志:root登录#tar cvzf/var/tmp/$HOSTNAME-log.tar.gz/var/log/*保存配置:b config save config20140708.ucs(默认保存在/var/local/ucs)恢复配置:b config install config20140708.ucsifconfig -a :接⼝地址查询netstat -rn :路由表查询top :查询系统CPU及内存使⽤率bigpipe node monitor show :查询各节点状态bigpipe pool show :查询Pool中的负载均衡情况watch b conn :查看当前建⽴的所有连接(退出请按Ctrl+C)bigstart status :检查BIG-IP服务状态bigstart list :检查BIG-IP服务状态b config check all :检查设备配置报告b failover show :检测各台BIG-IP设备的主备⼯作状态bigtop :检测当前BIG-IP上的连接数量,以及每个对外服务的虚拟服务器的⽤户连接数量b conn :实时监视BIG-IP的连接状态b standby show bigtop ;查看双机状态b failover standby ;强制备⽤华为交换机:screen-length 0 temporarydisplay versiondisplay current-configurationdir flash:display debugdisplay interfacedisplay ip interfacedisplay ip interface briefdisplay interface briefdisplay devicedisplay fandisplay powerdisplay reboot-infodisplay environmentdisplay alarm urgentdisplay vlan alldisplay cpu-usagedisplay memory-usagedisplay mac-addressdisplay logbufferdisplay clockdisplay trapbufferdisplay igmp-snooping port-infodisplay igmp-snooping statisticsdisplay dhcp snooping bind-table alldisplay mac-address stickydisplay startupdisplay boot-loaderdisplay memory-usagedisplay cpu-display acl resourcedisplay ip routedisplay ip vpn-intancedisplay ospf peer brifdisplay ospf peerdisplay bgp peerdisplay bgp vpnv4 all brifdisplay ldp peer alldisplay ldp adjacencydisplay lldp neidisplay lldp stadisplay diagnostic-informationMDS9000光纤交换机:show run 显⽰当前配置show zone 显⽰当前配置的ZONE的信息show zoneset 显⽰当前配置的ZONESET的信息show interface fc1/1 显⽰端⼝fc1/1信息show zone activate 显⽰当前活动的ZONE信息show zoneset activate 显⽰当前活动的ZONESET信息show flogi database detail 查看交换机端⼝连接的HBA卡的WWN号show license fcports.lic 显⽰指定Licenseshow license all 显⽰全部licenseshow license hostid 显⽰IDshow vsan 100 浏览VSAN100设置show vsan usage 浏览VSAN设置show zone 浏览Zone信息show zoneset vsan 2-3 浏览Zone vsan2-3信息show zoneset active 浏览zone的状态show zoneset active detail 端⼝速率checkshow inventory 查看设备序列号show environment 查看设备环境及硬件状态show tech-support 查看设备诊断信息show logging 查看设备⽇志show int brishow ip intshow hardwareshow module下载配置⽂件:switch# copy://system:running-configswitch# copy tftp://172.16.10.1/237.img bootflash: 237.img copy run start 保存当前配置Eudemon防⽕墙:terminal len 0display verdisplay current-configurationdirdisplay cpu-usagedisplay memory-usagedisplay histroydisplay local-userdisplay interfacedisplay devicedisplay fandisplay powerdisplay environmentdisplay zonedisplay interzonedisplay acl alldisplay trapbufferdisplay logbufferdisplay diagnostic-information:收集诊断信息display exception 10 verbose history:收集有异常信息display deadloop 10 histroy:收集死循环信息display startup-type:查看系统启动⽅式信息display startupdisplay boot-loaderdisplay devicedisplay fandisplay diagnostic-information---------------------------------------------------------------show tech-support的分析⼯具巡检命令GSR 12000:terminal len 0show runshow versionshow hardwareShow logShow log summaryshow logging | include Mar 10 show logging | include Mar 11 show processes cpushow process cpu historyshow processes memoryshow LEDShow context summaryshow hw-module subslot all oir show hw-module all sensorsshow hw-module all fpdshow environment allshow environment ledshow environment powershow environment fanshow environment temperature show standby brishow ip osp neishow ip osp int brishow ip bgp vpnv4 all summshow redundancy allShow redundancy stateDir allShow clockshow gsr chassis-infoshow diagshow diag detailshow inventoryshow monitor event-trace lcishow monitor event-trace fabshow monitor event-trace agent-ctrl show monitor event-trace board_mgrshow monitor event-trace slot –state X show controller errors fabricshow controller errors fabric counters show controller xbarshow controllers scashow controllers clockshow controllers fab-clkshow controllers fiashow controllers fia registershow context allshow fabricshow mbus countersshow mbus can-errorexecute-on all show controller fia show ip int brishow ip vrfshow ip bgp vpnv4 all summshow ip os neishow ip vrfshow ip route vrf BSS summary show ip route vrf BSS ospfshow ip vrf BSSshow ip arp vrf BSSshow process cpu HistoryASR 9Kshow mem summaryCISCO7200:terminal len 0show runshow vershow loggingshow logging | include Mar 10show logging | include Mar 11show clockshow processes cpushow processes memoryshow contextshow environment allshow ip int brishow ip vrfshow intdir allshow ip ospf neishow ip route summshow bgp vpnv4 unicast all summa show ip route allshow cdp neishow inventoryshow standby briefshow c7200show intershow diagshow tech-supportCISCO7600:terminal len 0show vershow runshow processes cpushow processes memoryshow contextshow environment alarmshow environment statusshow environment temperature show ip int brishow ip vrfshow intdir allshow ip ospf neishow ip ospf interfshow ip ospf interf briefshow ip bgp summshow ip bgp vpnv4 all summ show ip route allshow cdp neishow idprom allshow inventoryshow moduleshow standby briefshow arpshow arp summshow ip arp summshow mac-addressshow loggingshow logging | include Mar 7show clockshow intershow diagbusshow tech-support-----------------------------------------------------------------catos6509:terminal len 0show runshow config allshow versionshow logg buffShow logshow logging | include Mar 22show logging | include Mar 11show proc cpushow proc memShow environment allshow envi tempershow envir powerShow moduleshow portshow cam dynamicshow vlanDir allShow timedebug platform packek all countshow platform cpu packet statisticsshow int statu err-dis 查看err出发原因Show tech ————————————————————————————————CSICO6509:terminal len 0show runshow versionShow loggShow clockshow processes cpushow processes memory Show environment alarms Show environment stashow environment temperature Show contextShow moduleShow idprom allshow controllersshow idbDir allshow interfshow ip int brishow int summshow ip protocolsshow standby brishow ip ospf neishow ip ospf int brishow cdp neishow cdp nei deshow ip routeshow vlan brishow invshow arpshow ip arp summashow mac-address-table count show mac-addShow techCISCO 3750 、3550show versionshow inventoryshow processes cpushow processes memoryshow ip int bshow vlan brishow intshow arpshow mac-ashow runshow env allshow loggshow logging | include Mar 10 show logging | include Mar 11 show techCISCO PIX:terminal len 0show vershow runnshow cpu usageshow memory detailshow processes memory show moduleshow memoryshow conn coushow xlate countshow failovshow clockshow ntp stashow intershow loggingshow logging | include Mar 10 show logging | include Mar 11 show trafficshow ip addressshow nameifshow environment fans show environment powershow runnshow vershow clockshow nameifshow inventoryshow modeshow modushow resource usageshow asp dropshow conn countshow xlate countshow firewallshow perfmon detailshow ip audit countdir allshow arpshow interfaceshow cpu usashow processes cpu-usage show memshow debugshow access-listshow loggingshow logging | include Mar 10 show logging | include Mar 11 show failovershow trafficshow int ip briefshow ip addshow run natshow run globalshow environment drivershow environment fansshow environment power-supplies show environment temperatureclear access-list ACL_OUT contuear 中兴M6000路由器:terminal len 0show runningshow versionshow softwareshow hardwareshow fanshow powershow opticalinfoshow logfileshow logging alarmshow temperature detailshow processorshow ip interface briefshow interfaceshow sysnchronizationshow nvramshow clockshow running-config adm-mgr show running-config oamshow interface descriptionshow ftp-serverdirshow ip forwarding routeshow ip protocol routingshow ip interface briefshow ip vrfshow interfaceshow ip ospf neighborshow ip ospf neighbor detailshow ip bgp summaryshow bgp all summaryshow ip forwarding routeshow ip protocl routing summary show ip bgp vpnv4 all summary show ip bgp neighborsshow ip bgp vpnv4 all neighborsshow mpls ldp neighbor allshow mpls ldp discoveryshow ip arp vrf SC_scteloashow ip protocol routing vrf SC_sctelbilling 中兴T40Gterminal len 0Show runShow versionShow processorshow vlanshow monitor session allshow traffic-statistics 对端⼝流量进⾏统计show bootromshow logging alarmShow ip ospf neiShow ip bgp sumShow interfaceShow ip interface brshow interface briefShow macShow mac interfaceshow logging alarmshow logfile 查看操作记录show powershow fanshow flash-infoshow clockdirZXR10:show runshow vershow processorshow vlanshow ip protocol routingshow ip protocol routing summaryshow ip int brishow logging alarmshow logfileshow powershow fanshow flash-infoshow monitor session allshow clockdirjuniper巡检命令:terminal len 0show system uptime | noshow version | noshow chassis hardware detail | noshow chassis routing-engine | noshow chassis fpc pic-status | noshow chassis craft-interface | noshow pfe statistics error | noshow chassis alarms | noshow system storage | noshow log messages | no | last 200show configuration | display set | noshow interfaces extensive | nojuniper netscreen防⽕墙巡检命令:get chassis:查看设备序列号及其设备硬件(cpu,power,fan)的基本情况get tech:备份设备整体状态信息get memory:查看设备mem的使⽤情况get os cost:查看设备cup利⽤率get file :查看设备⽂件系统内容get system:查看系统基本情况(设备名称,版本信息,端⼝状态,⽤户名等)get nvram :查看NVRAM信息get route :查看路由表⽤于协助排错get mac-learn :查看学习到的mac地址get dns :查看dns server的基本情况以及dns缓存get arp:查看arp表get config :查看当前配置⽂件get performance:查看CPU的利⽤率get performance cpu:查看设备利⽤率get session:查看并发连接数get alarm:查看告警get nsrp:查看failver状态juniper SRX 巡检命令⾏show chassis routing-engine CPU利⽤率核查show chassis routing-engine MEM利⽤率核查show ospf neighbor OSPF邻居关系核查show ldp interface LDP端⼝状态检查show isis adjacency ISIS邻居关系检查show bgp neighbor BGP邻居关系检查show vrrp extensive HSRP信息检查⽣成树STP信息检查show chassis environment pem 电源状态核查show chassis environment 风扇状态核查show chassis alarms 单板告警核查show chassis fpc/show chassis fpc pic-status 单板状态核查show chassis fpc/show chassis fpc pic-status 单板温度核查show chassis fpc detail 单板固件版本信息检查show chassis hardwareshow configuration interfaces 接⼝配置核查show interface descriptions 接⼝描述规范性核查show configuration system AAA认证检查show configuration chassis redundancy 引擎板冗余状态检查show ntp associations NTP状态核查show configuration system syslog SYSLOG配置指向检查TRAP配置指向检查show configuration | display xmlshow configuration | display setshow configuration | display xmlshow configuration system login Telnet安全登录配置检查show configuration system name-server DNS配置检查show version 补丁版本核查Show log messages ⽇志查看show log dcdShow security flow traceoptions 正常运⾏时所有Debug开关应该全部关闭show security flow session summaryShow groups node0 system host-nameShow system uptime 时间Show configuration 配置Show chassic cluster interfaces 所有的接⼝都是up状态show chassic cluster status 双机是否正常Show interface terse 正在使⽤的接⼝应为UP或Active。
华为巡检常用命令
网络设备巡检现场操作规范适用范围:Huawei网络产品(路由器、交换机、防火墙)display version 查看IOS版本、板卡型号display (processes)memory 查看内存使用率display (processes)cpu 查看CPU使用率display interface 查看端口信息display power 查看电源状态display saved-configuration 查看保存的配置信息display ip route-table 查看路由表display logbuffer 查看日志信息display environment all 查看环境监控状态display mac-address 查看MAC地址表display clock 查看时钟dir 查看目录display controllers (物理信息)display current-configuration (相当于Cisco的show run)display diag 全部采集信息display device 查看设备信息---------------------Display Device---------------------NE80's Device status:Slot # T ype Online Register Status Primary NET Port- - - - - - - - - - - - - - - - - - - - - - - - - - - - - - - - - - - - - -1 LPUE Present Registered Normal NA Open (正常) 20 NET Present Unregistered Abnormal Slave NA (异常) 22 CLK Present Unregistered Abnormal Slave NA (异常)。
迈普路由交换巡检命令
迈普路由交换巡检命令检查的设备命令清单如下:路由器/交换机:(命令用telnet的方式可以一次粘贴完,但用console一次只能粘贴一小段,而网点交换机无法做,只能用console 手工输入,telnet方式收集的信息不全,命令在底下)!more offterminal monitor!show clockshow ntp status!spy cpumonitor cpushow cpu monitorshow memory!show run!show start!show interfaceshow interface gigaethernet0show interface gigaethernet1show interface gigaethernet2show interface gigaethernet3show interface gigaethernet0/0show interface gigaethernet0/1show interface gigaethernet0/2show interface gigaethernet1/0show interface gigaethernet1/1show interface gigaethernet1/2!show portshow port brieshow port statisticsshow ip interface briefshow ip interfaceshow storm-controlshow loopback-detectionshow link-aggregationshow link-aggregation group 1show link-aggregation portshow spanning-tree mst instance 0show spanning-tree mst instance 0 detail bridge 0 show spanning-tree mst instance 1show spanning-tree mst instance 1 detail bridge 1 show spanning-tree mst instance 2show spanning-tree mst detailshow spanning-tree mst detail bridge 0show spanning-tree mst configurationshow spanning-tree mst configuration bridge 0 show spanning-tree mstshow vlanshow ulfd allshow arp allshow arpshow mac-address allshow deviceshow errdisable recovershow errdisable detect!show aboutshow environmentshow env-listshow system powershow system chassisshow system fanshow system lpushow system mpushow system siushow system sfushow redundancy detailshow redundancy statusshow standbyshow ham mpushow ham geninfoshow mphsp statistic!!show vrrpshow vrrp timershow policy-map statistics !!show userswhoshow ip routeshow ip route statistic show ip irmp neishow ip irmp nei det show ip irmp topshow ip irmp top act show ip irmp top det show ip irmp trafficshow ip ospf core-info show ip ospf neishow ip ospf nei interface show ip ospf database show ip ospf request-list show ip ospf protocols show run router ospfshow ip route ospfshow ip route rip show ip rip databaseshow ip bgpshow ip bgp summary show ip bgp dampening show ip bgp neighborsshow bfd session all!show ip route statisticshow file location show flashshow filesystemdirshow boot-loaderdir /systemdir /flash!!show policy-map statistics interface show traffic-shape!!show frame-relay lmishow frame-relay pvcshow frame-relay pvc 100show frame-relay mapshow frame-relay traffic!show cpu!show loggshow logg buffershow tech!more onno spy cpu!。
- 1、下载文档前请自行甄别文档内容的完整性,平台不提供额外的编辑、内容补充、找答案等附加服务。
- 2、"仅部分预览"的文档,不可在线预览部分如存在完整性等问题,可反馈申请退款(可完整预览的文档不适用该条件!)。
- 3、如文档侵犯您的权益,请联系客服反馈,我们会尽快为您处理(人工客服工作时间:9:00-18:30)。
网络设备安全巡检命令参考为了提高安全巡检工作效率,快速完成对网络设备交换机、路由器和防火墙的例行巡检,建议利用SecureCRT终端登录管理工具及拷贝粘贴批处理命令脚本快速完成网络设备巡检数据采集工作。
客户设备本地或远程登录统一采用SecureCRT工具,对所有巡检客户网络设备预先编辑好登录脚本,方便后期巡检和维护快速登录客户设备。
对要巡检的客户采用以下批处理执行命令快速完成数据采集任务。
在执行以下批处理命令前先使用SecureCRT软件设置log session到一个新建txt文件,然后选取全部以下命令拷贝粘贴到设备特权模式"#"下,以下命令所显示的信息会自动发送到新建的txt 文件里。
目录1CISCO网络设备例行巡检数据采集任务 (3)1.1 CISCO交换机 (3)1.2 CISCO 路由器 (4)1.3 CISCO 防火墙 (4)1.4 CISCO网络设备巡检命令解释 (5)2华为网络设备例行巡检数据采集任务 (8)2.1 华为交换机 (8)2.2 华为路由器 (8)2.3 华为网络设备巡检命令解释 (10)3H3C网络设备例行巡检数据采集任务 (12)3.4 H3C交换机 (12)3.5 H3C 路由器 (12)3.6 H3C网络设备巡检命令解释 (13)4港湾网络设备例行巡检数据采集任务 (14)4.7 港湾交换机 (14)4.8 港湾路由器 (14)4.9 港湾网络设备巡检命令解释 (14)5HP网络设备例行巡检数据采集任务 (14)5.10 HP交换机 (14)5.11 HP 路由器 (15)5.12 HP网络设备巡检命令解释 (15)1CISCO网络设备例行巡检数据采集任务1.1 CISCO交换机================================================================== terminal length 0show runnshow vershow ip socketshow ip socket detailshow tcpshow clockshow vtp statusshow vtp passshow env allshow inventoryshow spanning rootshow spanning blockshow spanningshow cdp neishow cdp nei detshow arpshow mac-address-tabledir all-show inter statusshow inter summshow inter | i errors|FastEthernet|GigabitEthernetclear countersshow proc cpu | ex 0.00%show proc memshow debugsh loggingshow ip routeterminal length 451.2 CISCO 路由器===================================================================== terminal length 0show vershow runnshow clockshow tcp brief allshow tcpshow env allshow inventoryshow cdp neishow cdp nei detshow arpdir all-show interfaceshow inter summshow inter | i errors|FastEthernet|GigabitEthernet|Serialclear countersshow proc cpu hisshow proc cpu | ex 0.00%show proc memshow debugshow access-listsh loggingshow ip routeterminal length 451.3 CISCO 防火墙====================================================================== terminal pager 0show runnshow vershow clockshow nameifshow inventoryshow resource usageshow asp dropshow conn countshow xlate countshow firewallshow perfmon detailshow ip audit countdir all-show interfaceshow inter | i errors|FastEthernet|GigabitEthernet|Serialclear countersshow cpu usashow memshow debugshow access-listsh loggingshow routeshow local-hostterminal pager 241.4 CISCO网络设备巡检命令解释====================================================================== 1terminal length 0 ;设置终端显示行数不做限制(使所有show命令完全显示,不做暂停)2show running-config ;查看当前设备配置3show version ;查看IOS版本信息及设备正常运行时间4show clock ;查看设备时钟信息5show tcp brief all ;查看当前设备开发的TCP服务状态6show vtp status ;查看交换机vtp配置模式7show vtp password ;查看交换机vtp配置口令8show env all ;查看设备温度,电源和风扇运转参数及是否报警(注意:中高端设备不带参数all)9show inventory ;调取设备内部板卡出厂模块型号及序列号(可作为资产梳理和设备维保依据)10show spanning-tree root ;查看交换机生成树根位置11show spanning-tree block ;查看交换机block端口12show spanning-tree ;查看全部VLAN生成树信息13show cdp neighbors ;查看邻接cisco设备基本信息14show cdp neighbors detail ;查看邻接cisco设备详细信息15show mac-address-table ;通过查看MAC 地址表信息,确认目的MAC地址是否正确。
16dir all-filesystems ;查看交换机或路由器内部操作系统及其它文件系统(主要关注是否存在crash文件)17show interface status ;查看交换机接口状态是否存在errordisable接口或disable (shundown)接口18show interface summary ;查看交换机所有接口当前接口流量19show interface | i errors|FastEthernet|GigabitEthernet ;查看接口是否存在大量input或output errors包错误20clear counters ;使所有接口计数器归零(注意后面加两个回车符,因为存在提示确认信息)21show processes cpu ;查看设备cpu负载22show cpu usa ;查看CISCO 防火墙cpu负载23show processes mem ;查看设备mem占用率24show mem ;查看CISCO 防火墙内存占用率25show access-list ;查看访问控制列表配置及匹配数据包数量26show logging ;查看本机内部日志记录情况27show ip route ;查看路由表28show route ;查看cisco防火墙路由表29terminal length 45 ;设置终端显示每页45行(改回为默认值)30show conn count ;查看cisco防火墙连接数统计31show xlate count ;查看cisco防火墙地址转换条目统计32show firewall ;查看cisco防火墙配置模式(路由模式还是透明模式)33show perfmon ;查看cisco防火墙每秒各协议占用连接数34show ip audit count ;查看cisco防火墙自带IDS防攻击攻击签名库(自带153个签名库)匹配数量35show debug ;查看debug是否开启(如果有debug开启会消耗设备cpu资源)2华为网络设备例行巡检数据采集任务2.5 华为交换机display versiondisplay startupdisplay patchinformationdisplay clockdir flash:display current-configurationdisplay debugcompare configurationdisplay interfacedisplay current-configuration interfacedisplay interface briefdisplay poe power-state interfacedisplay devicedisplay reboot-infodisplay environmentdisplay alarmurgentdisplay cpu-usagedisplay memory-usagedisplay mac-addressdisplay logbufferdisplay trapbufferdisplay igmp-snooping port-infodisplay igmpsnooping statisticsdisplay dhcp snooping bind-table alldisplay macaddress stickydisplay acl resourcedisplay ip route2.6 华为路由器2.7 老的华为交换机命令命令解释基本和CISCO设备命令相同,注意之间的空行是有必要的。
enshow running-configshow versionshow clockshow mac-address-tableshow arp allshow interfaceshow cpushow memshow ip routeshow loggingshow access-lists allshow vlanclear inter2.8 华为网络设备巡检命令解释1display version ;查看单板和子卡PCB 版本号,软件版本号是否正确。