设备巡检常用的命令
巡检常用命令CISCO
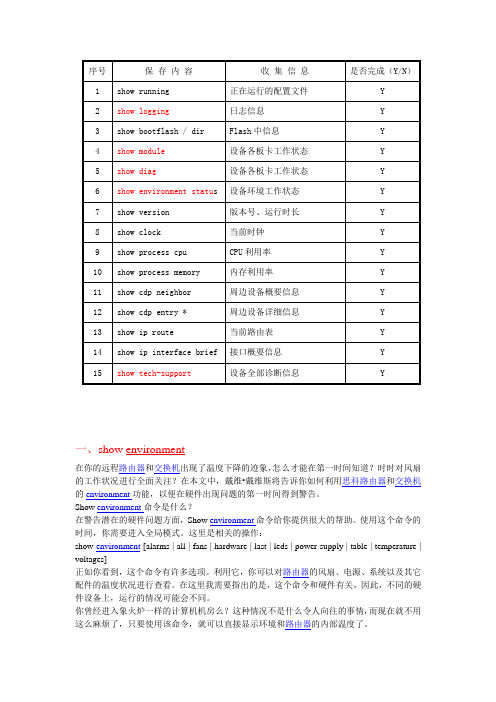
一、show environment在你的远程路由器和交换机出现了温度下降的迹象,怎么才能在第一时间知道?时时对风扇的工作状况进行全面关注?在本文中,戴维•戴维斯将告诉你如何利用思科路由器和交换机的environment功能,以便在硬件出现问题的第一时间得到警告。
Show environment命令是什么?在警告潜在的硬件问题方面,Show environment命令给你提供很大的帮助。
使用这个命令的时间,你需要进入全局模式。
这里是相关的操作:show environment [alarms | all | fans | hardware | last | leds | power-supply | table | temperature | voltages]正如你看到,这个命令有许多选项。
利用它,你可以对路由器的风扇、电源、系统以及其它配件的温度状况进行查看。
在这里我需要指出的是,这个命令和硬件有关,因此,不同的硬件设备上,运行的情况可能会不同。
你曾经进入象火炉一样的计算机机房么?这种情况不是什么令人向往的事情,而现在就不用这么麻烦了,只要使用该命令,就可以直接显示环境和路由器的内部温度了。
下面就让我们看看使用Show environment命令的三个例子。
它们分别基于不同的的路由器和交换机。
思科3845整合服务路由器显示的信息:Router# show environmentSYS PS1 is present.Fan status: NormalInput Voltage status: NormalDC Output V oltage status: NormalType: ACThermal status: NormalSYS PS2 is present.Fan status: NormalInput Voltage status: NormalDC Output V oltage status: NormalType: ACThermal status: NormalAUX(-48V) PS1 is absent.AUX(-48V) PS2 is absent.Fan 1 NormalFan 2 NormalFan 3 NormalFan Speed is NormalAlert settings:Intake temperature warning: Enabled, Threshold: 55Core temperature warning: Enabled, Threshold: 70 (CPU: 90)Board Temperature: NormalInternal-ambient temperature = 35, NormalCPU temperature = 46, NormalIntake temperature = 27, NormalBackplane temperature = 24, NormalV oltage 1(3300) is Normal, Current voltage = 3300 mVV oltage 2(5150) is Normal, Current voltage = 5153 mVV oltage 3(2500) is Normal, Current voltage = 2501 mVV oltage 4(1200) is Normal, Current voltage = 1203 mVNominal frequencyRouter#思科Catalyst 2960交换机显示的信息:switch# show environment ?all Show all environment statusfan Show fan statuspower Show power supply statusrps Show RPS statustemperature Show temperature statusswitch# show environment allFAN is OKTEMPERATURE is OKPOWER is OKRPS is NOT PRESENTswitch#你可以看到,在不同的硬件平台上,Show environment命令的功能是不相同的。
H3C设备常规巡检命令
H3C设备常规巡检命令一.巡检基础命令:#系统时间display clock#系统以及各单板软件版本display version#设备温度display environment#日志信息display logbuffer#单板运行状态display device#电源状态display device#风扇状态display device#CPU占用状态display cpu-usage#内存占用率display memory limit#接口流量display interface#接口、链路状态display interface#地址分配display current-configuration interface##路由扩散display current-configuration | include ospf #OSPF(Open Shortest Path First)配置display router id#路由信息display ip routing-table#端口统计数据display ip interface#当前配置文件display current-configuration#保存配置文件display saved-configuration2、脚本—华为display versiondis patch-informationdisplay clockdis dustproofdis frame-typedis healthdisplay cpu-usage display memory display memory limit display devicedisplay device manuinfo display powerdisplay fandisplay voltagedir cfcard2:/dir cfcard:display device pic-status dis switchover state display environment display interface display logbufferdis alarmdis bootrom ethernetdisplay current-configurationdisplay current-configuration interface#display router iddisplay ip routing-tabledisplay ip interfacedisplay ip interface briefdisplay current-configurationdisplay saved-configurationdisplay diagnostic-information3、华为NE40edisplay version 查看VRP版本等信息dis patch-information 查看版本补丁display clock查看时钟dis dustproof防尘网信息Dis frame-type显示NE40E机框类型dis health显示系统资源的使用情况display cpu-usage 查看1分钟CPU利用率display memory查看内存使用情况display memory limitdisplay device查看母板信息。
巡检常用命令

IBM AIX 小型机巡检常用命令及流程第一:首先是机房温度以及湿度的检查,当然这些一般情况都没问题。
参考值:温度(摄氏℃)10 ℃-40℃湿度8% -80%第二:就是关于电源的检测,这个只要不是新装机,一般没问题。
参考值:零-地电压小于1V火-地电压200-240V (补充:当然59系列的机器相间380V,相地240V)第三:关于报错。
主要查看硬件的永久性报错#errpt -dH | pg软件的永久性报错#errpt -dS | pg还有系统又没又报警灯第三:机器的序列号:#uname -Mu第四:操作系统版本:#oslevel -r 注:有时候不能使用是因为系统版本低的原因第五:其他检测执行sysdumpdev –l (检查dump是否设置为always allow sysdump)执行sysdumpdev –e (检查当前dump大小应该为主dump设备的大小的80%以下)执行lsvg -l rootvg (检查有否"stale"状态的逻辑卷)执行lsps -s (检查内存交换区占用情况)执行df –k (检查文件系统的分配状况,一般不要超过80%)执行lsdev –Cc disk (检查硬盘状态为available)执行lsdev –Cc adapter (检查PCI卡状态为available)执行lsdev –Cc tape (检查磁带机状态为available)执行lsdev – Cc processor (检查CPU状态为available)执行lsattr –El sys0|grep autorestart (检查系统crash后是否自动重新启动)执行lsattr –El sys0|grep cpuguard (检查CPU GUARD是否开启)执行lsattr –El mem0 (检查内存状态正常size=goodsize)执行vmstat 2iostat,topas观察us,sy,pi,po,(内存占用率,硬盘读写速度等检查是否有性能瓶颈)执行netstat –in和netstat –rn (观察网络状态)执行entstat –d enX (检测网卡运行速率与交换机速率是否匹配)(网卡速率由10M 半工改为自适应时,缺省网关会丢失。
巡检用到的命令
/var/spool/cron查看对时服务 crontab -l
查日志
var/adm
var/log
uptime 系统运行时间
vmstat 查看内存
prstat -a
swap -s
Solaris 10
bash
cat /etc/release 系统版本
1133 ls
ps -ef |grep java
ps -ef |grep web 查看pid文件 solaris操作系统
ps -ef |grep servername
/sbin/ifconfig -a查看网络配置
查看NFS文件共享cat /etc/exports
查看防火墙状态 service iptables status
程序必须以下面的行开始(必须方在文件的第一行):
#! /bin/sh
符号#!用来告诉系统它后面的参数是用来执行该文件的程序。在这个例子中我们使用/bin/sh来执行程序。
当编辑好脚本时,要想执行脚本,必须使脚本可以执行
下面的命令,可以使脚本可以执行
chmod +x filename 或 chmod 755 filename
一,
1,
Cmd 输入 netstat –ano
可以看到
2,
例如我查80端口被什么占用了 对应的进程id是 3600
再输入tasklist来查看 pid 3600是哪个进程什么程序在跑
3,
可以很快看到是tomcat6在用pid 3600 也即此占用了80端口
此时可以用 taskkill /pid 3600 /t /f 快速关闭此进程
H3C设备常规巡检命令

H3C设备常规巡检命令一.巡检基础命令:#系统时间display clock#系统以及各单板软件版本display version#设备温度display environment#日志信息display logbuffer#单板运行状态display device#电源状态display device#风扇状态display device#CPU占用状态display cpu-usage#内存占用率display memory limit#接口流量display interface#接口、链路状态display interface#地址分配display current-configuration interface##路由扩散display current-configuration | include ospf #OSPF(Open Shortest Path First)配置display router id#路由信息display ip routing-table#端口统计数据display ip interface#当前配置文件display current-configuration#保存配置文件display saved-configuration2、脚本—华为display versiondis patch-informationdisplay clockdis dustproofdis frame-typedis healthdisplay cpu-usagedisplay memorydisplay memory limitdisplay devicedisplay device manuinfodisplay powerdisplay fandisplay voltagedir cfcard2:/dir cfcard:display device pic-statusdis switchover statedisplay environmentdisplay interfacedisplay logbufferdis alarmdis bootrom ethernetdisplay current-configurationdisplay current-configuration interface# display router iddisplay ip routing-tabledisplay ip interfacedisplay ip interface briefdisplay current-configurationdisplay saved-configurationdisplay diagnostic-information3、华为NE40edisplay version 查看VRP版本等信息dis patch-information 查看版本补丁display clock查看时钟dis dustproof防尘网信息Dis frame-type显示NE40E机框类型dis health显示系统资源的使用情况display cpu-usage 查看1分钟CPU利用率display memory查看内存使用情况display memory limitdisplay device查看母板信息display device manuinfodisplay power查看电源状态display fan查看风扇状态display voltage 查看板卡电压dir cfcard2:/ 查看设备crash信息dir cfcard:查看设备cf卡信息display device pic-status查看子卡型号,序列号(NE40E NE80E) dis switchover state 查看引擎HA情况display environmentdisplay interface 查看接口状态display logbuffer 查看日志dis alarm查看设备告警dis bootrom ethernet 查看设备bootrom信息display current-configuration 查看当前配置display current-configuration interface# 查看设备当前接口配置display router id 查看设备路由IDdisplay ip routing-table 查看设备路由display ip interface 查看设备接口情况display ip interface brief 查看设备接口状态display current-configuration 查看设备当前配置display saved-configuration查看设备内存配置(相当show start)display diagnostic-information 抓取设备完整信息相对于show tech二、JUNIPER设备常用维护巡检命令1、脚本—JUNIPERshow version detailshow chassis hardware detail show chassis environment show chassis routing-engine show chassis firmwareshow configurationshow chassis fpc detailshow interfaceshow interfaces terseshow chassis alarmsshow system alarmsshow log messages|no-more show log chassisd|no-more show log logfile Displaysshow chassis sfm Reportsshow system boot-messages show system core-dumpsshow system processes extensive show pfe statistics errorshow chassis routing-engineshow system virtual-memoryshow system buffershow system queuesshow system statisticsshow configuration | except SECRET-DATA show interfaces extensiveshow chassis hardware extensive2、脚本—Juniper Firewallget systemget configget log eventget filiterget per cpu detailget session infoget per session detailget mac-learnget alarm eventget techget log system。
网络设备巡检命令

----------------------------------------------值得拥有文档值得下载----------------------------精品wor路由器巡检命令terminal len 0 禁用当前会话终端的分页输出功能显示当前时钟show clock显示系统日志状态及本地缓存中的日志信息show logging显示当前运行的软件信息及相关硬件设备信息show version显示当前内存统计信息show memory statistics显示内存利用率历史统计表show memory statistics history显示当前所有进程的内存使用情况show processes memory显示当前所有进程的CPUshow processes cpu 使用情况显示CPUshow processes cpu history 利用率历史统计表显示接口IP地址及状态简表show ip interface brief显示接口统计信息汇总表show interfaces summary显示接口状态及统计信息show interface显示IP协议统计信息show ip traffic显示IP路由协议进程参数和相关统计信息show ip protocols显示活动网络路由协议show protocols显示当前路由表信息show ip route显示Flash空间及文件信息dir列出NVRAMdir nvram: 文件信息显示文件系统信息show file systems显示引导及相关环境变量信息show bootvar显示模块show diag/端口适配器诊断信息----------------------------精品word文档值得下载值得拥有-------------------------------------------------------------------------------------------------------------------------------------------------------------------------------------------------------------------------值得拥有值得下载文档----------------------------精品worshow inventory 显示硬件资产信息,包含槽位、型号和序列号等信息显示电源、风扇、温度等物理运行环境信息show environment显示电源、风扇、温度等物理运行环境信息show env all显示硬件平台信息show platform显示当前运行的配置信息show running-config显示ARP表信息show arp显示用于技术支持的所有系统信息show tech-support交换机巡检命令terminal len 0 禁用当前会话终端的分页输出功能显示当前时钟show clock显示系统日志状态及本地缓存中的日志信息show logging显示当前运行的软件信息及相关硬件设备信息show version显示当前内存统计信息show memory statistics显示内存利用率历史统计表show memory statistics history显示当前所有进程的内存使用情况show processes memory显示当前所有进程的CPUshow processes cpu 使用情况显示show processes cpu history CPU利用率历史统计表显示接口IP地址及状态简表show ip interface brief显示接口统计信息汇总表show interfaces summary显示接口状态及统计信息show interface显示接口缓存相关统计信息show buffers显示IPshow ip traffic协议统计信息----------------------------精品word文档值得下载值得拥有-------------------------------------------------------------------------------------------------------------------------------------------------------------------------------------------------------------------------值得拥有文档值得下载----------------------------精品worshow ip protocols 显示IP路由协议进程参数和相关统计信息显示活动网络路由协议show protocols显示当前路由表信息show ip route显示Flash空间及文件信息dir列出NVRAMdir nvram: 文件信息显示文件系统信息show file systems显示引导及相关环境变量信息show bootvar显示模块/show diag 端口适配器诊断信息显示模块信息show module显示硬件资产信息,show inventory 包含槽位、型号和序列号等信息显示电源、风扇、温度等物理运行环境信息show environment显示电源、风扇、温度等物理运行环境信息show env all显示硬件平台信息show platform显示当前运行的配置信息show running-config显示ARPshow arp表信息显示show mac-address-table MAC地址转发表信息显示VLANshow vlan brief 信息显示VTPshow vtp status状态信息显示生成树协议汇总信息show spanning-tree summary显示生成树协议根网桥信息show spanning-tree root显示生成树协议阻塞端口信息show spanning-tree blockedports显示用于技术支持的所有系统信息show tech-support----------------------------精品word文档值得下载值得拥有-------------------------------------------------------------------------------------------------------------------------------------------------------------------------------------------------------------------------值得拥有值得下载精品----------------------------word文防火墙巡检命令terminal page 0 禁用当前会话终端的分页输出功能显示当前时钟show clock显示系统日志状态及本地缓存中的日志信息show logging显示模块信息show module显示硬件资产信息,show inventory 包含槽位、型号和序列号等信息显示性能show perfmon显示系统资源使用情况汇总信息show resource usage summary显示MAC地址转发表信息show mac-address-table显示用于技术支持的所有系统信息show tech-support华为/H3C设备user-interface vty 0 4screen-length 0 禁用Telnet会话终端的分页输出功能quitdisplay clock 显示系统的日期、时间、时区和夏令时信息display logbuffer 显示日志信息CPUdisplay cpu 的使用状态显示显示内存使用状态display memorydisplay version 显示系统的版本信息display saved 显示已保存的配置信息display device manuinfo 显示设备的制造信息显示风扇工作状态display fan----------------------------精品word文档值得下载值得拥有-------------------------------------------------------------------------------------------------------------------------------------------------------------------------------------------------------------------------值得拥有值得下载----------------------------精品word文档display power显示电源工作状态显示可插拔模块的主要特征参数display transceiver interfacedisplay transceiver manuinfo定制防伪可插拔模块的部分电子标签信息显示H3Cinterfacedisplay brief interface 显示接口概况信息display interfaces 显示接口详细信息显示路由表display ip routing-tabledisplay ip routing-table protocol 显示路由协议信息display ip routing-table statistics 显示路由表统计信息流量统计信息显示IPdisplay ip statistics显示STPdisplay stp信息display diagnostic-information 显示或保存系统当前各个功能模块运行的统计信息user-interface vty 0 4恢复undo screen-length 0 Telnet会话终端的分页输出功能quit----------------------------精品word文档值得下载值得拥有---------------------------------------------------------------------------------------------------------------------------------------------------------------------------。
常用网络设备巡检命令参考
网络设备安全巡检命令参考为了提高安全巡检工作效率,快速完成对网络设备交换机、路由器和防火墙的例行巡检,建议利用SecureCRT终端登录管理工具及拷贝粘贴批处理命令脚本快速完成网络设备巡检数据采集工作。
客户设备本地或远程登录统一采用SecureCRT工具,对所有巡检客户网络设备预先编辑好登录脚本,方便后期巡检和维护快速登录客户设备。
对要巡检的客户采用以下批处理执行命令快速完成数据采集任务。
在执行以下批处理命令前先使用SecureCRT软件设置log session到一个新建txt文件,然后选取全部以下命令拷贝粘贴到设备特权模式"#"下,以下命令所显示的信息会自动发送到新建的txt 文件里。
目录1CISCO网络设备例行巡检数据采集任务 (3)1.1 CISCO交换机 (3)1.2 CISCO 路由器 (4)1.3 CISCO 防火墙 (4)1.4 CISCO网络设备巡检命令解释 (5)2华为网络设备例行巡检数据采集任务 (8)2.1 华为交换机 (8)2.2 华为路由器 (8)2.3 华为网络设备巡检命令解释 (10)3H3C网络设备例行巡检数据采集任务 (12)3.4 H3C交换机 (12)3.5 H3C 路由器 (12)3.6 H3C网络设备巡检命令解释 (13)4港湾网络设备例行巡检数据采集任务 (14)4.7 港湾交换机 (14)4.8 港湾路由器 (14)4.9 港湾网络设备巡检命令解释 (14)5HP网络设备例行巡检数据采集任务 (14)5.10 HP交换机 (14)5.11 HP 路由器 (15)5.12 HP网络设备巡检命令解释 (15)1CISCO网络设备例行巡检数据采集任务1.1 CISCO交换机================================================================== terminal length 0show runnshow vershow ip socketshow ip socket detailshow tcpshow clockshow vtp statusshow vtp passshow env allshow inventoryshow spanning rootshow spanning blockshow spanningshow cdp neishow cdp nei detshow arpshow mac-address-tabledir all-show inter statusshow inter summshow inter | i errors|FastEthernet|GigabitEthernetclear countersshow proc cpu | ex 0.00%show proc memshow debugsh loggingshow ip routeterminal length 451.2 CISCO 路由器===================================================================== terminal length 0show vershow runnshow clockshow tcp brief allshow tcpshow env allshow inventoryshow cdp neishow cdp nei detshow arpdir all-show interfaceshow inter summshow inter | i errors|FastEthernet|GigabitEthernet|Serialclear countersshow proc cpu hisshow proc cpu | ex 0.00%show proc memshow debugshow access-listsh loggingshow ip routeterminal length 451.3 CISCO 防火墙====================================================================== terminal pager 0show runnshow vershow clockshow nameifshow inventoryshow resource usageshow asp dropshow conn countshow xlate countshow firewallshow perfmon detailshow ip audit countdir all-show interfaceshow inter | i errors|FastEthernet|GigabitEthernet|Serialclear countersshow cpu usashow memshow debugshow access-listsh loggingshow routeshow local-hostterminal pager 241.4 CISCO网络设备巡检命令解释====================================================================== 1terminal length 0 ;设置终端显示行数不做限制(使所有show命令完全显示,不做暂停)2show running-config ;查看当前设备配置3show version ;查看IOS版本信息及设备正常运行时间4show clock ;查看设备时钟信息5show tcp brief all ;查看当前设备开发的TCP服务状态6show vtp status ;查看交换机vtp配置模式7show vtp password ;查看交换机vtp配置口令8show env all ;查看设备温度,电源和风扇运转参数及是否报警(注意:中高端设备不带参数all)9show inventory ;调取设备内部板卡出厂模块型号及序列号(可作为资产梳理和设备维保依据)10show spanning-tree root ;查看交换机生成树根位置11show spanning-tree block ;查看交换机block端口12show spanning-tree ;查看全部VLAN生成树信息13show cdp neighbors ;查看邻接cisco设备基本信息14show cdp neighbors detail ;查看邻接cisco设备详细信息15show mac-address-table ;通过查看MAC 地址表信息,确认目的MAC地址是否正确。
C设备常规巡检命令
C设备常规巡检命令 Document serial number【LGGKGB-LGG98YT-LGGT8CB-LGUT-H3C设备常规巡检命令一.巡检基础命令:#系统时间display clock#系统以及各单板软件版本display version#设备温度display environment#日志信息display logbuffer#单板运行状态display device#电源状态display device#风扇状态display device#CPU占用状态display cpu-usage#内存占用率display memory limit#接口流量display interface#接口、链路状态display interface#地址分配display current-configuration interface##路由扩散display current-configuration | include ospf #OSPF(Open Shortest Path First)配置display router id#路由信息display ip routing-table#端口统计数据display ip interface#当前配置文件display current-configuration #保存配置文件display saved-configuration 2、脚本—华为display versiondis patch-information display clockdis dustproofdis frame-typedis healthdisplay cpu-usagedisplay memorydisplay memory limit display devicedisplay device manuinfo display powerdisplay fandisplay voltagedir cfcard2:/dir cfcard:?display device pic-statusdis switchover state display environment display interfacedisplay logbufferdis alarm?dis bootrom ethernet display current-configurationdisplay current-configuration interface# display router iddisplay ip routing-tabledisplay ip interfacedisplay ip interface briefdisplay current-configurationdisplay saved-configuration?display diagnostic-information3、华为NE40edisplay version 查看VRP版本等信息dis patch-information 查看版本补丁display clock 查看时钟dis dustproof 防尘网信息Dis frame-type 显示NE40E机框类型dis health显示系统资源的使用情况display cpu-usage 查看1分钟CPU利用率display memory 查看内存使用情况display memory limitdisplay device 查看母板信息display device manuinfodisplay power 查看电源状态display fan 查看风扇状态display voltage 查看板卡电压dir cfcard2:/ 查看设备crash信息dir cfcard: 查看设备cf卡信息display device pic-status 查看子卡型号,序列号 (NE40E NE80E) dis switchover state 查看引擎HA情况display environmentdisplay interface 查看接口状态display logbuffer 查看日志dis alarm 查看设备告警dis bootrom ethernet 查看设备bootrom信息display current-configuration 查看当前配置display current-configuration interface# 查看设备当前接口配置display router id 查看设备路由IDdisplay ip routing-table 查看设备路由display ip interface 查看设备接口情况display ip interface brief 查看设备接口状态display current-configuration 查看设备当前配置display saved-configuration 查看设备内存配置(相当show start)display diagnostic-information 抓取设备完整信息相对于show tech二、JUNIPER设备常用维护巡检命令1、脚本—JUNIPERshow system uptimeshow version detailshow chassis hardware detailshow chassis environmentshow chassis routing-engineshow chassis firmwareshow configurationshow chassis fpc detailshow interfaceshow interfaces terseshow chassis alarmsshow system alarmsshow log messages|no-more show log chassisd|no-more show log logfile Displaysshow chassis sfm Reportsshow system boot-messages show system core-dumpsshow system processes extensive show pfe statistics errorshow chassis routing-engineshow system storageshow system virtual-memoryshow system buffershow system queuesshow system statisticsshow configuration | except SECRET-DATA show interfaces extensiveshow chassis hardware extensive2、脚本—Juniper Firewallget systemget configget log eventget filiterget per cpu detailget session infoget per session detailget mac-learn get alarm event get techget log system。
华为巡检常用命令
网络设备巡检现场操作规范适用范围:Huawei网络产品(路由器、交换机、防火墙)display version 查看IOS版本、板卡型号display (processes)memory 查看内存使用率display (processes)cpu 查看CPU使用率display interface 查看端口信息display power 查看电源状态display saved-configuration 查看保存的配置信息display ip route-table 查看路由表display logbuffer 查看日志信息display environment all 查看环境监控状态display mac-address 查看MAC地址表display clock 查看时钟dir 查看目录display controllers (物理信息)display current-configuration (相当于Cisco的show run)display diag 全部采集信息display device 查看设备信息---------------------Display Device---------------------NE80's Device status:Slot # T ype Online Register Status Primary NET Port- - - - - - - - - - - - - - - - - - - - - - - - - - - - - - - - - - - - - -1 LPUE Present Registered Normal NA Open (正常) 20 NET Present Unregistered Abnormal Slave NA (异常) 22 CLK Present Unregistered Abnormal Slave NA (异常)。
巡检命令集
主机系统一般检查/usr/platform/sun4u/sbin/prtdiag –v uname –als –l /var/crash/* (cat /etc/shadow)more /var/adm/messagesgrep -i warn /var/adm/messages*grep -i panic /var/adm/messages* grep -i fata /var/adm/messages*grep -i erro /var/adm/messages*grep -i fai /var/adm/messagesifconfig –asneep (sn)hostid; hostnamedf –k ; swap –s ;(swap –l) format;luxadm probevxdisk listvxdg listvxprint -htiostat –xnDpz 3 (iostat –En)metastatmetadb -imore /.rhostsmore /etc/passwdsar (sar 3 5; sar –g)prstat 2 5;mpstat;cpustatvmstatps –eo pid,pcpu,args|sort +1nscstat ;scstat -ghastatus -sum (more /var/VRTSvcs/log/engine_A.log) fcinfo hba-portUptime4.2、存储设备一般检查1.vxdisk list2.vxprint -th3.metadb4.metastat5.iostat –xnDpz 5 (iostat –En)6.format7.df –k8.scclisc> show configurationshow media-checkshow ses-devicesshow disk-arrayshow battery-stat4.3、性能统计一般性检查1.sar2.sar –g3.prstat4.ps –eo pid,pcpu,args|sort +1n5.df –kcp /dev/null /var/adm/messages五、机房环境情况和硬件设备物理检查机房检查漏水,通风温度,接地,灰尘大小。
- 1、下载文档前请自行甄别文档内容的完整性,平台不提供额外的编辑、内容补充、找答案等附加服务。
- 2、"仅部分预览"的文档,不可在线预览部分如存在完整性等问题,可反馈申请退款(可完整预览的文档不适用该条件!)。
- 3、如文档侵犯您的权益,请联系客服反馈,我们会尽快为您处理(人工客服工作时间:9:00-18:30)。
设备常用巡检命令
硬件状态、IOS版本信息检查:
display clock 系统时间
display version 查看版本信息,最近一次重新启动的时间display enviroment 设备温度
display device 单板运行状态
display power 查看电源状况
display fan 查看风扇状况
display cpu-usage 查看cpu最近5S、1m、5m占用率display cpu history 查看cpu使用记录
display memory 查看内存大小和占用率
系统运行配置状态检查:
display interface 接口流量、链路状态
dis current-configuration inter 地址分配
dis current-configuration |include ospf 路由扩散
display ip routing-table 路由信息
display ip interface 显示vlan端口统计数据
display saved-configuration 保存配置文件
display logbuffer 日志信息
display port trunk 查看参与trunk的端口
STP信息检查:
display stp root 查看stp根情况
display stp brief 查看stp简单信息
display stp abnormal 查看是否有非正常端口
vrrp和端口聚合检查
display vrrp statistics 查看主备用状态
display link-aggregation summary 查看链路聚合组的情况。