stata初级入门描述性统计指标
零基础小白STATA数据分析实用常见命令整理

零基础⼩⽩STATA数据分析实⽤常见命令整理STATA基础⼊门零基础实⽤命令整理第⼀章数据的读⼊与熟悉1.读⼊⽂件中的部分变量. use[变量] using [⽂件名]Eg . use age sex height weight using [⽂件名]2.读⼊⽂件中的部分观察量. use[⽂件名] in X/Y. use "I:\stata\chapter3.dta" in 601/1000软件只读⼊从第601个观察到第1000个观察之间的400个观察量3.描述、管理数据的基本命令命令功能. describe描述数据的基本情况:样本总量、变量总数、变量的格式等. list. list [变量名]-列出数据中所有变量的分布,从第⼀个样本到最后⼀个样本-列出选定变量的分布. list [变量名] in X/Y 列出数据中被选定的变量分布。
in限定数据的观察值范围。
⽐如,若只想查看第100个-200个观察值的分布,则将X/Y替换成100/200. order [变量名]按选定变量排序。
⽐如,样本的编号、年龄、性别、教育程度,……,等. aorder 将所有变量从 a-z 排序. label variable给变量贴上标签命令功能. sort [变量名] -将某个变量的数值进⾏排序。
⼀般情况下,排序的⽅式是从⼩到⼤-可同时排序多个变量-Stata将缺失值描述为最⼤数值,故排列在最后. sort [变量名] [in] 对某些变量的某个取值范围进⾏排序;没有指定的取值范围保持在原地⽅. gsort [+|-][变量名] -可从⼩到⼤和从⼤到⼩-若变量名前没有任何符号或加上+号,则按升序排列;若在变量名前加上-号,则按降序排列-变量可以是数值型、也可以是字符型. gsort [+|-][变量名] ,mfirst -mfirst指定将缺失值置于所有有效数值之前. gsort -age第⼆章变量的⽣成与处理1.离散和连续测量离散⽅式(discrete measure):由定性测量和定序测量组成;适⽤于低层次数据连续⽅式(continuous measure):由定距测量和定⽐测量组成。
Stata软件基本操作:统计描述入门
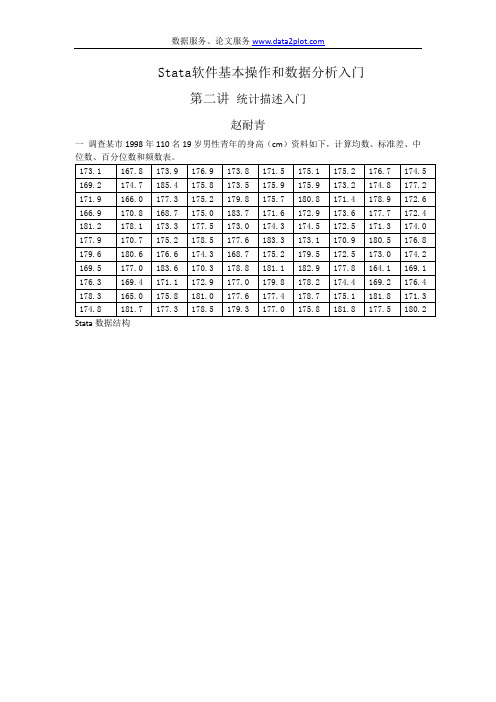
Stata软件基本操作和数据分析入门第二讲统计描述入门赵耐青一调查某市1998年110名19岁男性青年的身高(cm)资料如下,计算均数、标准差、中位数、百分位数和频数表。
Stata数据结构(读者可以把数据直接粘贴到Stata的Edit窗口)在介绍统计分析命令之前,先介绍打开一个保存统计分析结果的文件操作:计算样本的均数、标准差、最大值和最小值命令1:su 变量名 (可以多个变量:即:su 变量名1 变量名2 …变量名m)命令2:su 变量名,d (可以多个变量:即:su 变量名1 变量名2 …变量名m,d) 本例命令su x本例命令. su x,d计算百分位数还可以用专用命令centile。
centile 变量名(可以多个变量),centile(要计算的百分位数) 例如计算P2.5,P97.5等centile 变量名,centile(2.5 97.5)本例计算P2.5,P97.5,P50,P25,P75。
本例命令. centile x,centile(2.5 25 50 75 97.5)制作频数表,组距为2,从164开始,gen f=int((x-164)/2)*2+164 其中int( )表示取整数tab f 频数汇总和频率计算作频数图命令 graph 变量,bin(#) norm其中#表示频数图的组数;norm表示画一条相应的正态曲线(可以不要) 本例命令为graph x,bin(8) norm为了使坐标更清楚地在图上显示,可以输入下列命令graph x,bin(8) xlabel norm ylabel图形可以从Stata中复制到word中来,操作如下:计算几何均数可以用means 变量名(可以多个变量:即:means 变量1 …变量m) means x作Pie图描述构成比:每一类的频数用一个变量表示,命令:graph 各类频数变量名,pie第1地区血型构成比的Pie图的命令和图graph a b o ab if area==1,pie注意逻辑表达式中if area==1是两个等号。
第五章 statar软件教程-描述性统计分析

(2)接下来我们对wage变量分别进行W检验Swilk(Shapiro-Wilk W test for normality)和 W' 检验Sfrancia(Shapiro-Francia W' test for normality),
(3)最后演示D’ Agostino检验,使用的命令是sktestdc,这里我们 使用未经调整过的卡方检验,即添加noadjust选项:
Page 11
STATA从入门到精通
5.4.3改变数据的分布
Stata提供了一个非 常强大的工具“幂阶 梯”(ladder of powers)可以尝试 表5-11所列的九种转 换的可能,然后依次 进行偏度——峰度检 验。
表5-11 幂转换阶梯
转换(tansfermation)
公式
立方(cube)
graph box命令的选项:
over(varname[, over_subopts]):设定分组变量,变量可以是数值型或 者字符型变量,可以设置多达三个的分组变量。[, over_subopts]可以 指定用于排序的变量名称,也可以使用sort(1),则表明按照第一个分组 变量排序。默认排序方式为从小到大,在[, over_subopts]加入 descending则指定为按照中位数从大到小降序排列。
Page 14
STATA从入门到精通
5.5相关系数
常用的相关系数共有如下四种:Pearson相关系数、.Kendall τ相关系数、 Spearman秩相关系数以及偏相关系数。 Stata的相关系数命令不仅可以得到通常的相关系数,还可以计算协方差 矩阵,更为有用的是它还提供了对缺失值的不同处理方法。 Pearson相关系数
Stata—描述性统计

Stata—描述性统计1.资料的基本信息①summarizesummarize:汇总所有变量的名称,个案数⽬,均值,标准差等,缩写为sumformat age %6.2f:指定age变量的统计量输出时的保留2位⼩数sum age, format:结合上个命令,对年龄变量进⾏描述的汇总保留2位⼩数sum age,detail:汇总更加详细的信息②codebookcodebook没有sum详细codebook:汇总所有变量codebook var:汇总var变量③inspectinspect age:可以画出简单的直⽅图2.基本信息的统计①tabulate和table命令tabulate places:对places变量进⾏列表统计,此命令可缩写为tabtable places:只有频数统计,不可缩写为tabtab places price:统计不同地⽅的价格的列表tab places price:统计不同places的price的列表②tabstat命令tabstat price places:显⽰2个变量的平均值tabstat price places, stats(mean med min max):显⽰2个变量的平均值,中位数等统计量tabstat price places, stat(mean med min max p25) col(s) format(%6.2f):均值等统计量在表格的⾏中,并且将结果⼩数点保持在2位。
此命令也可以写为tabstat price places, s(mean med min max) c(s) f(%6.2f)。
tabstat price places, s(mean med min max) c(s) f(%6.2f) by (gender):根据性别分类来陈述上述的统计量。
③结果呈现(1)将Stata中的结果选中,右击⿏标选择Copy table,直接贴⼊Excel或者Word。
stata描述性统计分析报告

stata描述性统计分析报告describedescribe命令可以描述数据文件的整体,包括观测总数,变量总数,生成日期,每个变量的存储类型(storagetype),标签(label)等。
list[varlist][if exp][in range]summarize[varlist][weight][if exp][in range][,detail]summarize可以提供varlist指定变量(可以不止一个)的如下统计量:Percentiles(分位数),四大最大的数和四个最小的数,Variance(方差),Std.Dev.(标准差),Skewness(偏度),Kurtosis(斜度)tabstattabstat varlist[weight][if exp][in range][,stats(statname[...])]tabstat提供[,stats(statname[...])]指定的统计量,可供选择的有mean(均值),count(非缺失观测值个数),sum(总和),max(最大值),min(最小值),range(最大值-最小值),sd (标准差),var(方差),cv(变易系数=标准差/均值),skewness(偏度),kurtosis(斜度),median(中位数),p1(1%分位数,类似地有p5, p10,p25,p50,p75,p95,p99),iqr(interquantile range=p75–p25)。
比如,想知道变量pop在整个样本的均值和方差,可以使用如下命令:tabstat pop,stats(mean var)anova命令anova y x1 x2anova做方差分析(analysis of variance),研究y的平均值在分类变量x1和x2不同取值之间的差异。
signrank命令signrank y1=y2signrank做Wilcoxon秩检验。
stata初级入门3-描述性统计指标课件

• 菜单:Statistics > Summaries, tables, and tests > Tables > One/two-way table of summary statistics
stata初级入门3-描述性统计指标
五、经验分布函数
• 对变量累积分布函数的估计
指标。 • 范例:summarize price mpg
stata初级入门3-描述性统计指标
• 菜单:Statistics > Summaries, tables, and tests > Summary and descriptive statistics > Summary statistics
• 列联表给出从属于两个分类变量不同类别的观测值的 频数
• 如果两个分类变量各有r,c个类别,则列联表共有r×c 个单元格
C a r t y p e
D o m e s t i c F o r e i g n
T o t a l
i d 1
7 4
1 1
2
3 7 1 6
5 3
T o t a l
4 4 2 0
stata初级入门3-描述性统计指标
六、正态性检验
• sktest varname • swilk varname
stata初级入门3-描述性统计指标
本讲练习
stata初级入门3-描述性统计指标
stata入门3 ——统计指标篇
stata初级入门3-描述性统计指标
一、基本描述统计量
• summarize命令
• 可概括观测值个数、平均值、标准差、最大值和最小值 五个指标。
stata描述性统计代码
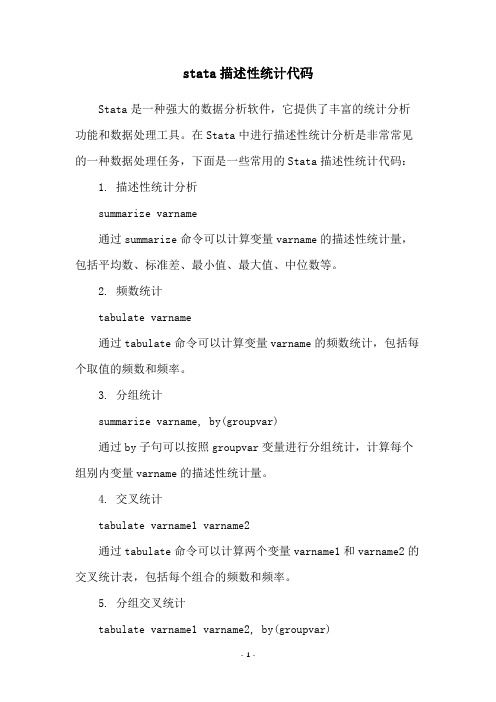
stata描述性统计代码Stata是一种强大的数据分析软件,它提供了丰富的统计分析功能和数据处理工具。
在Stata中进行描述性统计分析是非常常见的一种数据处理任务,下面是一些常用的Stata描述性统计代码: 1. 描述性统计分析summarize varname通过summarize命令可以计算变量varname的描述性统计量,包括平均数、标准差、最小值、最大值、中位数等。
2. 频数统计tabulate varname通过tabulate命令可以计算变量varname的频数统计,包括每个取值的频数和频率。
3. 分组统计summarize varname, by(groupvar)通过by子句可以按照groupvar变量进行分组统计,计算每个组别内变量varname的描述性统计量。
4. 交叉统计tabulate varname1 varname2通过tabulate命令可以计算两个变量varname1和varname2的交叉统计表,包括每个组合的频数和频率。
5. 分组交叉统计tabulate varname1 varname2, by(groupvar)通过by子句可以按照groupvar变量进行分组交叉统计,计算每个组别内两个变量varname1和varname2的交叉统计表。
6. 相关分析correlate varname1 varname2通过correlate命令可以计算两个变量varname1和varname2之间的相关系数和协方差。
7. 回归分析regress depvar indepvar1 indepvar2...通过regress命令可以进行回归分析,其中depvar为因变量,indepvar1、indepvar2等为自变量。
以上是一些常用的Stata描述性统计代码,可以帮助你快速地完成数据分析任务。
stata描述性统计命令

stata描述性统计命令
Stata的描述性统计命令有多种,它们可以帮助研究者更好地了解数
据集的总体特征。
summarize命令用于描述变量的汇总统计。
它可以提供数据的总体基
本统计信息,包括变量的极值,求和和平均值,标准偏差,偏度和峰度等。
tabstat命令可以提供许多汇总统计,如平均数,极差,中位数,众数,标准偏差,偏度和峰度等。
means命令用于计算一般变量的平均值,可以指定组分的变量(空格
分隔),以计算某个变量对应不同组分的平均值。
summarize, tabstat和means命令都可以设置if和in选项,以按
某个条件或某组约束变量汇总统计。
假设检验命令可以用于检验某个假设是否为真。
t-test可以用来检
验均值之间是否存在显著差异;ranksum可以用来检验两个样本是否具有
相同或不同的数据分布;correlate可以用来检验两个变量之间是否存在
线性关系。
graph box可以创建箱线图,以显示一组数据的总体分布。
histogram可以创建一种特定的直方图,可以清楚地显示数据的分布
状况。
Stata还提供了其他描述性统计命令,比如contrast,prtest,correlate等,用于更深入地了解数据集的总体特征。
- 1、下载文档前请自行甄别文档内容的完整性,平台不提供额外的编辑、内容补充、找答案等附加服务。
- 2、"仅部分预览"的文档,不可在线预览部分如存在完整性等问题,可反馈申请退款(可完整预览的文档不适用该条件!)。
- 3、如文档侵犯您的权益,请联系客服反馈,我们会尽快为您处理(人工客服工作时间:9:00-18:30)。
2020年10月13日星期二《计量经济学Fra bibliotek件应用》8
菜单1: Statistics > Summaries, tables, and
tests > Tables > One-way tables
《计量经济学软件应用》
4
菜单:Statistics>Summaries, tables, and tests >Tables>Table of summary statistics (tabstat)
2020年10月13日星期二
《计量经济学软件应用》
5
ameans命令
估计算术、几何和调和平均数 语法:ameans [varlist] [if] [in] [weight]
stata入门3 ——统计指标篇
江金启 沈阳农业大学经济管理学院
一、基本描述统计量
summarize命令
可概括观测值个数、平均值、标准差、最大值和最 小值五个指标。
语法:summarize varlist [in] [if] [weight] [,options] 选项:detail可统计方差、偏度、峰度和各个分位
列联表给出从属于两个分类变量不同类别的观测 值的频数
如果两个分类变量各有r,c个类别,则列联表共有 r×c个单元格
Car type
id
1
2
Total
Domestic Foreign
7
37
44
4
16
20
Total
11
53
64
2020年10月13日星期二
《计量经济学软件应用》
11
tabulate命令: 语法1——指定两个变量的列联表
2020年10月13日星期二
《计量经济学软件应用》
7
二、单个分类变量的汇总统计
tabulate/tab1命令
对分类变量的描述统计是观察其不同类别的频 数或百分数。
语法1:tabulate varname [if] [in] [weight] [, options]
语法2: tab1 varlist [if] [in] [weight] [, options]
标值。 nototal不报告总体统计值,通常是与by()配合使用 missing用by()选项时,显示by()变量的缺失值也作
一类的结果。
范例:tabstat price mpg, by(id) statistics(mean ma mi sd n) missing
2020年10月13日星期二
2020年10月13日星期二
《计量经济学软件应用》
9
菜单2:Statistics > Summaries, tables, and tests > Tables > Multiple one-way tables
2020年10月13日星期二
《计量经济学软件应用》
10
三、两个分类变量的列联表
列联表是考察两个分类变量相关关系的方法
数等指标。 范例:summarize price mpg
2020年10月13日星期二
《计量经济学软件应用》
2
菜单:Statistics > Summaries, tables, and tests > Summary and descriptive statistics > Summary statistics
[,options] 范例:ameans price
2020年10月13日星期二
《计量经济学软件应用》
6
菜单:Statistics > Summaries, tables, and tests > Summary and descriptive statistics > Arith./geometric/harmonic means
2020年10月13日星期二
《计量经济学软件应用》
16
菜单:Statistics > Summaries, tables, and tests > Tables > One/two-way table of summary statistics
2020年10月13日星期二
《计量经济学软件应用》
15
四、列联表描述统计量
tabulate, summarize() :单个或两个分类变量 的描述性统计
格式:tabulate varname1 [varname2] [if] [in] [weight] [, options]
选项:[no] means(不)包含均值,[no] standard(不)包含标准差,[no] freq(不) 包含频数,[no] obs(不)包含观测值个数, missing将缺失值作为一类
tabulate varname1 varname2 [if] [in] [weight] [, options]
范例:tabulate foreign id
2020年10月13日星期二
《计量经济学软件应用》
12
菜单:Statistics > Summaries, tables, and tests > Tables > Two-way tables with measures of association
2020年10月13日星期二
《计量经济学软件应用》
13
语法2——多个变量内存在的所有可能列联分 析结果
tab2 varlist [if] [in] [weight] [, options]
范例:tab2 foreign id rep78
2020年10月13日星期二
《计量经济学软件应用》
14
菜单:Statistics > Summaries, tables, and tests > Tables > All possible two-way tabulations
2020年10月13日星期二
《计量经济学软件应用》
3
tabstat命令
语法: tabstat varlist [if] [in] [weight] [, options] 选项:默认结果是均值。
by(varname) 按变量varname进行分组描述性统计; statistics(statname [...]) 报告指定的描述性统计指