GIS项目详细说明书
(产品管理)GIS产品说明书最全版

(产品管理)GIS产品说明书南方卫星导航手持机GIStar产品说明书GPS手持数据采集系统广州南方卫星导航仪器有限公司二○一一年七月目录一、产品介绍41.1产品简介41.2版本说明41.3软件的安装、卸载41.4软件的注册5二、软件界面概述62.1快捷工具栏62.2信息显示窗口72.3状态栏72.4菜单栏8三、软件设置说明(“管理”菜单操作说明)93.1“工程”设置93.1.1新建工程93.1.2工程设置更改113.2“GPS”设置133.2.1信息查看133.2.2GPS基本设置153.2.3SBAS差分设置153.2.4外部源连接(外部源差分)163.3“坐标系统”设置183.4“图层”设置183.5“地图”设置193.6“工具栏”设置203.7“帮助”说明203.8“退出”20四、软件操作说明(“作业”菜单操作说明)214.1“测量”操作214.1.1动态测量214.1.2静态测量254.1.3放样操作264.1.4NEMA输出(运行第三方软件操作流程)314.2“采集”操作334.3“数据”查看334.4“设置”操作334.5“工具”操作334.6“输入”与“输出”334.6.1数据输出334.6.2数据输入36五、配套软件说明415.1数据导出软件415.1.1导出数据文件415.1.2导出轨迹文件435.1.3附表445.2数据字典软件445.2.1新建数据字典445.2.2新建点要素455.2.3新建点要素属性465.2.4新建线要素485.2.5新建线要素属性495.2.6新建面要素535.2.7新建面要素属性535.2.8附加属性545.2.9保存数据字典565.3图像处理软件565.3.1软件基本功能介绍565.3.2软件操作步骤575.3.3输入图像边界坐标校正方式595.3.4文件导出595.3.5影像数据的加载与显示605.3.6特别说明61 5.3.7附件61GIStar产品说明书一、产品介绍1.1产品简介GIStar是一套利用GIS技术(地理信息系统技术)来采集、管理、导入、导出地理信息数据的软件系统。
Esri ArcGIS常用模式详细说明说明书

Essential Patterns of Use Jim VanOstenbridgeSolution Architect, Esri************************ArcGIS Common Patterns of UseWhat makes these patterns essential?•Esri has revealed common types of activities for customers across all industries•Patterns enable relevant business-focused requirements conversations for both business and technical stakeholdersPattern: Mapping & Visualization•Definition: Mapping & Visualization is how peopleunderstand locations and relationships through visualrepresentations. 2D and 3D maps and charts bring data to life and provide context, so people can easily communicate and understand information.•Solution Design Consideration-How are users expected to access and interact with maps?-What applications, skills, and infrastructure do people need todesign and consume great maps?Pattern: Data Management•Definition: Data Management is how people collect,organize, and maintain accurate locations and details about assets and resources. Optimal data management involves the persistence of spatial data within a set of storagemodels, each optimized for unique characteristics. Storage models include the geodatabase, spatiotemporal big data store, relational data store, and tile cache.•Solution Design Consideration-Who will be responsible for managing enterprise and domain-focused content?-What skills, applications and infrastructure are needed tomanage enterprise geospatial content?Pattern: Field Mobility•Definition: Field Mobility includes managing and enabling a mobile workforce to collect and access information in thefield. Improve visibility into the operational aspects of anorganization, enhance workforce scheduling, reduce issues caused from stale data, and empower personnel withinformation needed to perform tasks while on the move.•Solution Design Consideration-Who needs to collect or edit field observations?-Who needs to manage work assignments?-Are place finding and wayfinding important?-What skills, applications and infrastructure are needed?Pattern: Monitoring•Definition: Monitoring allows people to track, manage, and monitor fixed and mobile assets and resources in real time.Organizations can simultaneously tap into, analyze, anddisplay streaming data from many sensors, devices, andsocial media feeds.•Solution Design Consideration-What spatiotemporal activity needs to be managed (fixed ormobile assets)?-Does this involve telemetry, imagery or both?-What applications, skills, and infrastructure do people need towork with monitoring content?Pattern: Analytics•Definition: Analytics involves applying analytical techniques to transform data into actionable information. Discover,quantify, and predict trends and patterns to empowerdecision making and improve business outcomes.•Solution Design Consideration-What manner of organizational activity needs to be analyzed?-How are people intended to access and apply analytics?-What applications, skills, and infrastructure do people need tobuild and effectively apply analytical capabilities?Pattern: Planning & Design•Definition: Design & Planning enables people to evaluate alternative solutions and create optimal designs. Thissupports the design workflow by enabling users acrossorganizations and communities to collaborate on design decisions.•Solution Design Consideration-How do planners and designers need to work with executivesand domain stakeholders, both formally and informally?-What applications, skills, and infrastructure do people need toenable a planning and design practice?Pattern: Decision Support•Definition: Decision Support involves visualizing data on a map or dashboard to better understand activities, projects, and operations. Combine data, metrics, and operational and analytical layers in a way that produces information valued by decision makers.•Solution Design Consideration-Who needs access to timely mapping and analytics to guidedecisions?-What actions will users want to take at decision points?-What applications, skills, and infrastructure do people need toenable sustainable decision support capabilities?Pattern: Constituent Engagement•Definition: Constituent Engagement includes two‐waysharing of information with the public, partner agencies, or other external stakeholders. Improve engagement andcollaboration with communities of interest for more informed decision making.•Solution Design Consideration-How do organizational practices need to be extended topartners, contractors, the public?-What mapping, analytics, presentation, and collaborationcapabilities are needed?-What applications, skills, and infrastructure do people need todeliver and sustain this capability?Pattern: Sharing & Collaboration•Definition: Sharing & Collaboration provides self‐service capabilities, so people can discover, use, make, and share maps. Extend the value of location information to the entire organization or community.•Solution Design Consideration-One of the most valuable patterns-Who in your organization needs to find, create, and apply maps to…-Visualize structured and unstructured content-Build and deliver presentations-Mark up a map together with colleagues-What applications, skills, and infrastructure do people need todeliver and sustain these capabilities?Applying the Patterns | Executive DashboardApplying the Essential Patterns to a Portfolio of SolutionsApplying the Essential Patterns to a Portfolio of SolutionsArcGIS PlatformConceptual Reference Architecture•ArcGIS is a Platform Solution•Supports a range of workflows•Portfolios of applications•Integrated identity management•A variety of workloads and content •Integration with external systems•Built to enable the collaborative work of anenterprise•The Essential Patterns of Use categorizecapabilities for applications, maps, and content that lead to well-design solutions.ArcGIS Platform Best Practices Guidance•Application Implementation Strategy•Apply IT Governance •Automation•Capability Delivery •Distributed GIS •Enterprise Integration: Application Patterns •Environment Isolation •High Availability •Infrastructure•Load Balancing •Managing Identities •Patterns of Use •Prioritization Approach •Publication Strategy: Geospatial Content Delivery•Real-time GIS Strategy •Security•Workforce Development •Workload SeparationPlease Take Our Survey on the AppDownload the Esri Events app and find your event Select the sessionyou attendedSelect the Feedback tabComplete answersand select “Submit”Essential Patterns of Use Jim VanOstenbridgeSolution Architect, Esri************************。
gis项目计划书

gis项目计划书一、项目背景近年来,地理信息系统(GIS)在各行各业中的应用逐渐增多。
本项目旨在开发一个用于城市规划与管理的GIS应用,以提供高效、准确的地理信息处理和分析能力,帮助决策者更好地了解和解决城市发展中的问题。
二、项目目标1. 开发一个集数据采集、存储、处理和分析于一体的GIS系统;2. 提供直观、易用的界面,使用户可以方便地查询和展示地理数据;3. 支持多种地理数据格式的导入和导出;4. 实现基于地理数据的空间分析、模拟和预测功能;5. 开发相应的数据管理和维护工具,保证数据的完整性和准确性。
三、项目计划1. 前期准备(1个月)a. 调研市场需求和用户需求,明确项目的范围和目标;b. 筹备项目团队,明确各成员的职责和任务;c. 分析可行性和风险,制定项目计划和预算。
2. 系统设计(2个月)a. 进行需求分析,明确系统功能和界面设计;b. 架构系统框架,确定数据库结构和数据模型;c. 编写详细设计文档,确保系统设计的完备性。
3. 系统开发(6个月)a. 根据设计文档,开发系统各功能模块;b. 实现数据采集、存储和处理的核心功能;c. 进行系统测试和优化,确保系统的稳定性和性能。
4. 数据管理与维护工具开发(3个月)a. 开发数据导入和导出工具,支持多种数据格式;b. 实现数据的清洗、更新和维护功能;c. 设计用户权限管理和数据安全策略。
5. 系统集成与部署(1个月)a. 集成各功能模块,进行系统整体测试;b. 部署系统到生产环境,确保系统的稳定运行;c. 提供培训和技术支持,确保用户能够正确使用系统。
四、项目预算本项目的预算为x万元,包括人员费用、硬件设备、软件开发工具、数据采集设备等各方面的开支。
详细预算表将在项目启动阶段进行编制和确认。
五、项目风险与控制措施1. 技术风险:由于GIS技术更新迅速,存在技术难题和依赖供应商的风险。
为了降低技术风险,我们将进行充分的技术调研和风险评估,选择成熟和可靠的技术方案。
gis项目建设方案

gis项目建设方案一、项目背景随着信息技术的发展和地理信息系统(GIS)在各个行业的广泛应用,越来越多的组织和企业开始意识到GIS在决策和资源管理中的重要性。
本项目旨在建设一套完善的GIS系统,以提高组织的决策效率和资源利用率。
二、项目目标1.建立高效的数据管理系统:通过采集、整理和更新地理信息数据,建立一套完整、准确的GIS数据管理系统,包括基础地图数据、空间分析数据和业务数据。
2.提供专业的地图制作和分析功能:通过GIS系统,为用户提供多种地图制作和分析功能,包括空间分析、地理编码、缓冲区分析等,满足用户对地理信息的各种需求。
3.支持多平台和多终端的应用:GIS系统应具备多平台和多终端的应用能力,包括PC端、移动端和Web端,以满足用户在不同场景下的使用需求。
4.建立应急响应和决策支持平台:通过GIS系统,实现对重大事件和灾害的应急响应能力,提供实时的地理信息和决策支持,为领导决策提供有力支持。
三、项目内容1.需求调研和分析:对组织内部各部门和用户的需求进行调研和分析,包括数据需求、功能需求和应用场景需求。
2.系统设计和架构:根据需求分析结果,设计GIS系统的整体架构和模块划分,确定数据存储、数据交互和功能实现等方面的技术方案。
3.数据采集和整理:通过现场调查、遥感技术和业务数据整合,采集并整理基础地图数据、业务数据和空间分析数据。
4.系统开发和测试:根据系统设计方案,进行GIS系统的开发和测试,包括数据库搭建、功能模块开发和界面设计等。
5.系统部署和运维:将开发完成的GIS系统部署到服务器和用户终端上,并进行系统运维和问题排查,确保系统的稳定运行。
四、项目计划1.需求调研和分析阶段(2周):收集和分析用户需求,编制需求规格说明书。
2.系统设计和架构阶段(2周):完成系统设计和架构方案,编制技术方案文档。
3.数据采集和整理阶段(4周):采集和整理基础地图数据、业务数据和空间分析数据。
4.系统开发和测试阶段(6周):进行GIS系统的开发和测试,编写开发文档和测试文档。
arcgis pro 实施指南说明书
ArcGIS Pro 实施指南组织开始使用 ArcGIS Pro 的基本任务。
发布日期: 2021 年 6 月任务一览表任务完成1.了解 ArcGIS Pro2.获取 ArcGIS Pro3.设置 ArcGIS Online4.分配 ArcGIS Pro5.下载并安装6.探索实践学习7.了解详细信息1. 了解 ArcGIS Pro很高兴您决定在组织中开始使用 ArcGIS Pro。
即使您只有少许或完全没有 GIS 经验也没关系 - 现在正是您开始使用 Esri 新一代桌面 GIS 的好时机。
随着技术的快速发展,曾经令人生畏的空间问题变得易于解决,通过 ArcGIS Pro 的直观设计,GIS 可供更多不同行业的人群使用。
为了组织成员能够使用 ArcGIS Pro 创建引人注目的地图和可视化效果、解决数据驱动的问题以及与同事协作,您需要进行设置。
本指南将简化该过程并帮助您避免混淆。
现实问题解决方案从艺术制图到数据驱动的分析再到 3D 模型,ArcGIS Pro 具有适用于各行业的广泛功能。
下文将介绍这些方案的少部分示例。
每个示例均随附实践学习练习,您或您的同事可以在完成本指南中的其他任务后返回到练习。
•制图:在 ArcGIS Pro 中,您可以制作精美的地图和可视化来唤起地方感,同时以引人注目的方式传达数据。
例如,您可以可视化公共卫生趋势(如疟疾发病率下降),但可能性几乎是无限的。
ArcGIS Pro 用于制作Maps We Love 库中的大部分最新条目,这是 Esri 最佳制图的精选集合。
•空间分析:从零售到自然资源再到国家安全等行业,ArcGIS Pro 可帮助专业人员使用数据解决复杂的空间问题。
了解保护科学家如何使用机器学习来预测重要的海草栖息地。
•3D GIS:您可以在同一个 ArcGIS Pro 工程中分析 2D 和 3D 数据。
高级 3D 模型提供了制定重要决策所需的可视化,例如使用此提议的城市发展模型。
gis项目计划书
gis项目计划书一、项目背景和目标近年来,GIS(地理信息系统)在各个领域的应用越来越广泛。
本计划书旨在提出一个GIS项目的详细规划和实施方案,以满足相关部门对地理信息的管理和利用的需求。
该项目的目标是建立一个高效、准确的GIS系统,提供优质的地理信息服务,以支持决策和规划工作。
二、项目计划1. 项目概述本项目将采用先进的GIS技术,结合大量的地理数据,构建一个综合性的地理信息管理平台。
该平台将包括数据采集、存储和处理的功能,以及地理信息展示和分析的功能。
同时,为了提高数据的准确性和可靠性,我们还将建立一套完善的数据质量控制体系。
2. 项目任务(1)需求分析:调研相关部门的GIS需求,明确项目的具体功能和特点。
(2)数据采集和处理:收集各类地理数据,包括地形、气候、交通等,经过处理和整理后,建立地理数据库。
(3)系统开发和测试:根据需求分析的结果,进行系统开发和功能测试。
确保系统的稳定性和可靠性。
(4)平台建设与运维:搭建GIS平台,包括硬件设备和软件环境的部署。
同时,建立定期的数据更新和系统维护机制。
3. 项目进度安排(1)需求分析阶段:预计耗时1个月。
包括与相关部门的沟通和需求调研。
(2)数据采集和处理阶段:预计耗时3个月。
包括数据采集、整理和入库。
(3)系统开发和测试阶段:预计耗时6个月。
包括系统功能的开发和测试。
(4)平台建设与运维阶段:预计耗时1个月。
包括硬件设备的搭建和系统的部署。
4. 项目资源需求(1)人力资源:需要一支专业的团队,包括GIS工程师、数据采集员和项目经理等。
(2)硬件资源:需要一台高性能的服务器和专用的GIS终端设备。
(3)软件资源:需要购买和安装GIS系统软件和相关的数据库管理软件。
5. 风险评估与控制措施(1)数据质量风险:采用严格的质量控制流程和标准,确保数据的准确性和可靠性。
(2)系统可用性风险:采用高可靠性的硬件设备和备份机制,保证系统的稳定运行。
(3)项目进度风险:建立有效的项目管理机制,及时发现和解决项目进度延迟的问题。
gis项目计划书1

gis项目计划书1GIS项目计划书一、项目背景随着信息技术的快速发展,地理信息系统(GIS)被广泛应用于各个领域。
我们公司决定开展一项针对城市规划的GIS项目,旨在提供全面、准确的地理空间数据,帮助决策者进行科学规划和决策。
二、项目目标1. 构建完善的城市地理信息数据库,包括地貌、交通、环境、设施等各个方面的数据。
2. 开发一套功能强大、易于使用和可定制的GIS软件平台,以满足各个部门的具体需求。
3. 提供高质量的数据分析和可视化功能,辅助决策者进行城市规划和资源管理。
4. 建立GIS数据共享机制,促进信息共享和协同工作,为决策提供更加准确的参考依据。
三、项目内容1. 数据收集与整理a) 收集相关的地理空间数据,包括卫星影像、地图数据、传感器数据等。
b) 对收集到的数据进行清洗和整理,确保数据的准确性和一致性。
2. 数据库构建与管理a) 建立适应项目需求的地理信息数据库,包括数据库结构设计和数据字典编制。
b) 开发数据库管理系统,实现数据的录入、查询、更新和删除等功能。
3. GIS软件平台开发a) 确定功能模块和用户需求,进行软件平台的架构设计。
b) 开发GIS软件平台,包括界面设计、算法实现和用户交互功能。
4. 数据分析与可视化a) 开发数据分析算法,实现对地理数据的统计、分析和挖掘。
b) 提供数据可视化功能,将数据以地图、图表等形式直观展现,便于决策者理解。
5. 数据共享与协同a) 设计并实现GIS数据共享平台,方便各个部门之间的数据交流和共享。
b) 开发协同工作平台,支持多人实时协同编辑和决策。
四、项目实施计划1. 项目启动阶段(一个月)a) 确定项目组成员和角色分工,明确各项任务和目标。
b) 进行项目沟通和资源准备,确保项目顺利启动。
2. 数据收集和整理阶段(三个月)a) 制定数据收集计划,收集和整理相关数据。
b) 进行数据质量检查和清洗,确保数据的准确性和可用性。
3. 数据库构建与管理阶段(六个月)a) 进行数据库结构设计和数据字典编制。
GIS软件使用教程:创建和操作地图说明书
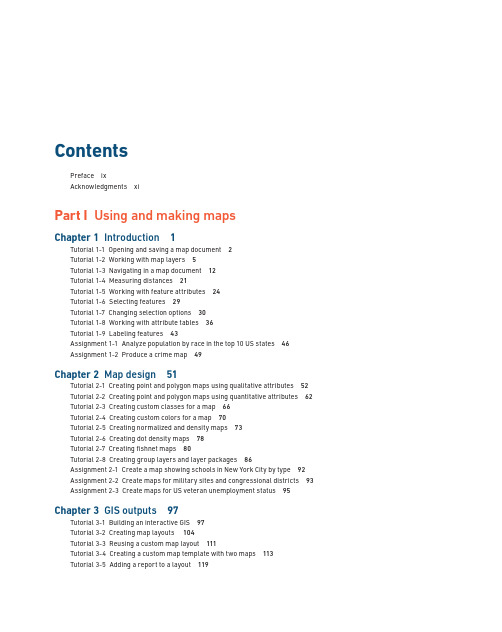
ContentsPreface ixAcknowledgments xiPart I Using and making mapsChapter 1 Introduction 1Tutorial 1-1 Opening and saving a map document 2Tutorial 1-2 Working with map layers 5Tutorial 1-3 Navigating in a map document 12Tutorial 1-4 Measuring distances 21Tutorial 1-5 Working with feature attributes 24Tutorial 1-6 Selecting features 29Tutorial 1-7 Changing selection options 30Tutorial 1-8 Working with attribute tables 36Tutorial 1-9 Labeling features 43Assignment 1-1 Analyze population by race in the top 10 US states 46Assignment 1-2 Produce a crime map 49Chapter 2 Map design 51Tutorial 2-1 Creating point and polygon maps using qualitative attributes 52 Tutorial 2-2 Creating point and polygon maps using quantitative attributes 62 Tutorial 2-3 Creating custom classes for a map 66Tutorial 2-4 Creating custom colors for a map 70Tutorial 2-5 Creating normalized and density maps 73Tutorial 2-6 Creating dot density maps 78Tutorial 2-7 Creating fishnet maps 80Tutorial 2-8 Creating group layers and layer packages 86Assignment 2-1 Create a map showing schools in New York City by type 92 Assignment 2-2 Create maps for military sites and congressional districts 93 Assignment 2-3 Create maps for US veteran unemployment status 95Chapter 3 GIS outputs 97Tutorial 3-1 Building an interactive GIS 97Tutorial 3-2 Creating map layouts 104Tutorial 3-3 Reusing a custom map layout 111Tutorial 3-4 Creating a custom map template with two maps 113Tutorial 3-5 Adding a report to a layout 119viGIS TUTORIAL FOR ARCGIS DESKTOP 10.8Tutorial 3-6 Adding a graph to a layout 121Tutorial 3-7 Building a map animation 123Tutorial 3-8 Using ArcGIS Online 128Assignment 3-1 Create a dynamic map of historic buildings in downtown Pittsburgh 128Assignment 3-2 Create a layout comparing 2010 elderly and youth population compositions in Orange County, California 130Assignment 3-3 Create an animation for an auto theft crime time series 131Part II Working with spatial dataChapter 4 File geodatabases 133Tutorial 4-1 Building a file geodatabase 133Tutorial 4-2 Using ArcCatalog utilities 136Tutorial 4-3 Modifying an attribute table 139Tutorial 4-4 Joining tables 142Tutorial 4-5 Creating centroid coordinates in a table 144Tutorial 4-6 Aggregating data 148Assignment 4-1 Investigate educational attainment 153Assignment 4-2 Compare serious crime with poverty in Pittsburgh 155Chapter 5 Spatial data 159Tutorial 5-1 Examining metadata 160Tutorial 5-2 Working with world map projections 162Tutorial 5-3 Working with US map projections 165Tutorial 5-4 Working with rectangular coordinate systems 167Tutorial 5-5 Learning about vector data formats 172Tutorial 5-6 Exploring raster basemaps from Esri web services 178Tutorial 5-7 Downloading raster maps from the USGS 181Chapter 6 Geoprocessing 185Tutorial 6-1 Extracting features for a study area 185Tutorial 6-2 Clipping features 190Tutorial 6-3 Dissolving features 192Tutorial 6-4 Merging features 195Tutorial 6-5 Intersecting layers 199Tutorial 6-6 Unioning layers 202Tutorial 6-7 Automating geoprocessing using ModelBuilder 208Assignment 6-1 Build a study region for Colorado counties 220Assignment 6-2 Dissolve property parcels to create a zoning map 222Assignment 6-3 Build a model to create a fishnet map layer for a study area 223Chapter 7 Digitizing 227Tutorial 7-1 Digitizing polygon features 228Tutorial 7-2 Digitizing line features 239Tutorial 7-3 Digitizing point features 245Tutorial 7-4 Using advanced editing tools 248Tutorial 7-5 Spatially adjusting features 255Assignment 7-1 Digitize police beats 259COnTEnTS viiAssignment 7-2 Use GIS to track campus information 261Chapter 8 Geocoding 263Tutorial 8-1 Geocoding data by ZIP Code 263Tutorial 8-2 Geocoding data by street address 268Tutorial 8-3 Correcting source addresses using interactive rematch 274Tutorial 8-4 Correcting street reference layer addresses 276Tutorial 8-5 Using an alias table 281Assignment 8-1 Geocode household hazardous waste participants to ZIP Codes 282Assignment 8-2 Geocode immigrant-run businesses to Pittsburgh streets 284Assignment 8-3 Examine match option parameters for geocoding 285Part III Analyzing spatial dataChapter 9 Spatial analysis 289Tutorial 9-1 Buffering points for proximity analysis 290Tutorial 9-2 Conducting a site suitability analysis 295Tutorial 9-3 Using multiple ring buffers for calibrating a gravity model 299Assignment 9-1 Analyze population in California cities at risk for earthquakes 308Assignment 9-2 Analyze visits to the Jack Stack public pool in Pittsburgh 310Chapter 10 ArcGIS 3D Analyst for Desktop 313Tutorial 10-1 Creating a 3D scene 314Tutorial 10-2 Creating a TIN from contours 315Tutorial 10-3 Draping features onto a TIN 320Tutorial 10-4 Navigating scenes 326Tutorial 10-5 Creating an animation 330Tutorial 10-6 Using 3D effects 332Tutorial 10-7 Using 3D symbols 335Tutorial 10-8 Editing 3D objects 339Tutorial 10-9 Using 3D Analyst for landform analysis 342Tutorial 10-10 Exploring ArcGlobe 348Assignment 10-1 Develop a 3D presentation for downtown historic sites 352Assignment 10-2 Topographic site analysis 354Assignment 10-3 3D animation of a conservatory study area 355Chapter 11 ArcGIS Spatial Analyst for Desktop 357Tutorial 11-1 Processing raster map layers 358Tutorial 11-2 Creating a hillshade raster layer 363Tutorial 11-3 Making a kernel density map 365Tutorial 11-4 Extracting raster value points 371Tutorial 11-5 Conducting a raster-based site suitability study 374Assignment 11-1 Create a mask and hillshade for suburbs 381Assignment 11-2 Estimate heart attack fatalities outside hospitals by gender 383Chapter 12 ArcGIS Network Analyst for Desktop 385Tutorial 12-1 Solving the “traveling salesperson” problem 386Tutorial 12-2 Building a TIGER-based network dataset 394viiiGIS TUTORIAL FOR ARCGIS DESKTOP 10.8Tutorial 12-3 Creating travel polygons 402Tutorial 12-4 Locating facilities 409Tutorial 12-5 Routing vehicles from depots to demand points 414Assignment 12-1 Geographic access to federally qualified health centers 421Assignment 12-2 Analyze visits to the Phillips public pool in Pittsburgh 423Assignment 12-3 Locate new farmers’ markets in Washington, DC 424Appendix Data source credits 427。
- 1、下载文档前请自行甄别文档内容的完整性,平台不提供额外的编辑、内容补充、找答案等附加服务。
- 2、"仅部分预览"的文档,不可在线预览部分如存在完整性等问题,可反馈申请退款(可完整预览的文档不适用该条件!)。
- 3、如文档侵犯您的权益,请联系客服反馈,我们会尽快为您处理(人工客服工作时间:9:00-18:30)。
《旅游管理系统项目详细说明书》2016年1月15日目录一、引言 (3)1.背景 (3)2.参考资料 (3)二、程序系统的结构 (3)三、模块设计 (4)1、模块(子程序)描述 (4)2、功能 (4)3、输入项(主要代码) (4)四、测试计划 (7)1.测试目的 (8)2.测试内容 (8)3.结果输出 (8)编写详细说明书的目的是向大家详细描述该软件系统各层次中的每一个模块(或子程序)的设计细节。
一、引言1、背景项目名称:旅游管理查询系统设计目的:为游客和旅行社之间提供一个友好的、直接的交流平台,便于管理者更好地管理信息,为游客提供查询某地旅游地图,以便更好地为用户服务。
开发者人员:高放;蓝歆玫;金建伟;安萌;李君;朱明远;邓健。
用户:面向于旅行社,后台可以实现数据管理员增删改信息,前台可以实现游客浏览、查看、预定。
安装环境:visual studio2010。
2、参考资料:Arc GIS Engine—地理信息开发教程二、程序系统的结构分为前台客户和后台管理员管理两大模块。
第一部分:前台客户浏览包括:查询、地图导航,如图所示:第二部分:后台管理员模块,如图:三、模块设计:1、模块(子程序)描述简要描述安装此模块(或子程序)的目的意义、程序特点。
2、功能详细描述次模块(或子模块)要完成的主要功能3、输入项(主要代码)主要代码:(1)窗体设计器生成的代码:private System.Windows.Forms.ToolStripMenuItem文?件tToolStripMenuItem;private System.Windows.Forms.ToolStripMenuItem地Ì?图ª?导Ì?航?ToolStripMenuItem;private System.Windows.Forms.ToolStripMenuItem查¨¦询¡¥ToolStripMenuItem;private System.Windows.Forms.MenuStrip menuStrip1;private ESRI.ArcGIS.Controls.AxToolbarControl axToolbarControl1;private ESRI.ArcGIS.Controls.AxLicenseControl axLicenseControl1;private ESRI.ArcGIS.Controls.AxTOCControl axTOCControl1;private System.Windows.Forms.Splitter splitter1;private ESRI.ArcGIS.Controls.AxMapControl axMapControl1;private System.Windows.Forms.ToolStripMenuItem用®?户¡ì管¨¹理¤¨ªToolStripMenuItem;private System.Windows.Forms.ToolStripMenuItem添¬¨ª加¨®用®?户¡ìToolStripMenuItem;private System.Windows.Forms.ToolStripMenuItem删¦?除y用®?户¡ìToolStripMenuItem;private System.Windows.Forms.ToolStripMenuItem修T改?用®?户¡ìToolStripMenuItem;private System.Windows.Forms.ToolStripMenuItem打䨰开aToolStripMenuItem;private System.Windows.Forms.ToolStripMenuItem退ª?出?ToolStripMenuItem;private System.Windows.Forms.ToolStripMenuItem保À¡ê存ä?ToolStripMenuItem;private System.Windows.Forms.ToolStripMenuItem另¢¨ª存ä?为aToolStripMenuItem;private System.Windows.Forms.ToolStripMenuItem拉¤-框¨°放¤?大䨮ToolStripMenuItem;private System.Windows.Forms.ToolStripMenuItem拉¤-框¨°缩?小?ToolStripMenuItem;private System.Windows.Forms.ToolStripMenuItem放¤?大䨮ToolStripMenuItem;private System.Windows.Forms.ToolStripMenuItem缩?小?ToolStripMenuItem;private System.Windows.Forms.ToolStripMenuItem漫t游®?ToolStripMenuItem;private System.Windows.Forms.ToolStripMenuItem全¨?图ª?显?示º?ToolStripMenuItem;private System.Windows.Forms.ToolStripMenuItem btnForWardView;private System.Windows.Forms.ToolStripMenuItem btnFrontView;private System.Windows.Forms.ToolStripMenuItem sQL查¨¦询¡¥ToolStripMenuItem;private System.Windows.Forms.ToolStripMenuItem空?间?查¨¦询¡¥ToolStripMenuItem;private System.Windows.Forms.ToolStripMenuItem toolStripMenuItem2;(2)用户管理主程序代码:private void添加用户ToolStripMenuItem_Click(object sender, EventArgs e){frmAddUser myfrm = new frmAddUser();myfrm.ShowDialog();}private void删除用户¡ìToolStripMenuItem_Click(object sender, EventArgs e){frmDelUser myfrm = new frmDelUser();myfrm.ShowDialog();}private void修改用户ToolStripMenuItem_Click(object sender, EventArgs e){frmModifyUser myfrm = new frmModifyUser();myfrm.ShowDialog();}(3)用户登录代码:string password = "";#region用户登录检测if (!String.IsNullOrEmpty(txtUsername.Text.Trim())){strUserName = txtUsername.Text.Trim();}else{MessageBox.Show("请输入登录用户名", "登录提示", MessageBoxButtons.OK, rmation);return;}if (!String.IsNullOrEmpty(txtPassword.Text.Trim())){password = txtPassword.Text.Trim();}else{MessageBox.Show("请输入登录密码", "登录提示", MessageBoxButtons.OK, rmation);return;}OleDbConnection conn;string strSQL = "";conn = new OleDbConnection("Provider=Microsoft.Jet.OLEDB.4.0;Data Source=" + Application.StartupPath + @"/添加用户表À¨ª.mdb");conn.Open();strSQL = string.Format("select count(*) from USERS where USERNAME='{0}' and UserPassword='{1}'", txtUsername.Text.Trim(), txtPassword.Text.Trim());OleDbCommand cmd = new OleDbCommand(strSQL, conn);int count = (int)cmd.ExecuteScalar();if (count > 0){strUserName = txtUsername.Text.Trim();strUserPassword = txtPassword.Text.Trim();FrmMain myFrm = new FrmMain();myFrm.Show();this.Hide();}else{MessageBox.Show("用户名或密码错误", "登录提示", MessageBoxButtons.OK, rmation);return;}输出项:(4)拉框放大主程序代码为:axMapControl1.CurrentTool = null;pMouseOperate = "ZoomIn";axMapControl1.MousePointer = esriControlsMousePointer.esriPointerZoomIn;以实现地图的放大功能。