PerfView- A Tool for Source-Level Performance Analysis on the Itanium Processor Family
【性能监控-Perfmon工具】Perfmon工具使用教程
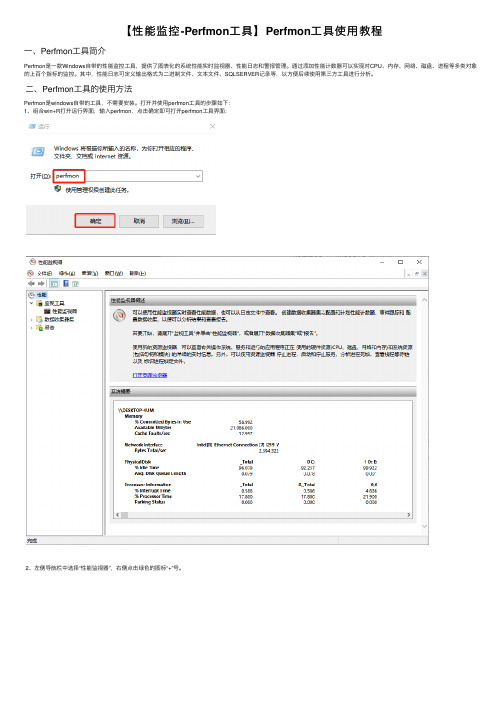
【性能监控-Perfmon⼯具】Perfmon⼯具使⽤教程⼀、Perfmon⼯具简介Perfmon是⼀款Windows⾃带的性能监控⼯具,提供了图表化的系统性能实时监视器、性能⽇志和警报管理。
通过添加性能计数器可以实现对CPU、内存、⽹络、磁盘、进程等多类对象的上百个指标的监控。
其中,性能⽇志可定义输出格式为⼆进制⽂件、⽂本⽂件、SQLSERVER记录等,以⽅便后续使⽤第三⽅⼯具进⾏分析。
⼆、Perfmon⼯具的使⽤⽅法Perfmon是windows⾃带的⼯具,不需要安装。
打开并使⽤perfmon⼯具的步骤如下:1、组合win+R打开运⾏界⾯,输⼊perfmon,点击确定即可打开perfmon⼯具界⾯:2、左侧导航栏中选择“性能监视器”,右侧点击绿⾊的图标“+”号。
3、弹出“添加计数器”界⾯。
4、下⾯以项⽬A(进程名称为SRE.exe)为例,添加计数器,实时监控该项⽬的内存、cpu、磁盘指标。
5、查看实时监控数据。
2.2、使⽤计数器⽇志监控⽅法上述实时监控⽅法只能查看当前所配置的“持续时间”内的数据,不能把监控的数据保存下来。
如果需要持续对SRE项⽬或系统的指定的性能指标进⾏监控,就需要使⽤Perfmon⼯具的计数器⽇志功能。
计数器⽇志可以把监控数据以指定的⽅式保存到本地,也能⽅便后续使⽤第三⽅⼯具对监控的数据进⾏分析。
下⾯仍然以项⽬A(进程名称SRE.exe)为例,监控该项⽬的内存、cpu、磁盘指标,并将监控数据以“逗号分隔”的格式保存到本地,选择“逗号分隔”时,保存到本地的⽂件将为csv格式。
具体步骤如下:1、与2.1中同样的⽅法打开Perfmon⼯具,在左侧导航栏中选择“数据收集器集-⽤户定义”,然后⿏标右键-新建-数据收集器集,弹出界⾯如下,⾃定义名称如此处命名“ETK”。
选择“⼿动创建(⾼级)”,点击“下⼀步”:2、继续点击“下⼀步”:3、选择性能数据⽇志保存的位置,点击“下⼀步”:4、点击“完成”:5、在perfmon⼯具界⾯,左侧选择刚创建的“ETK”,⿏标右键-新建-数据收集器,弹出界⾯如下,⾃定义名称如此处命名为“ETK性能监控数据”,点击“下⼀步”:6、点击“添加”,在弹出的界⾯中安装2.1中介绍过的⽅法添加需要监控的性能指标,然后点击“确定”:7、设置⽰例间隔为“5秒”,数据收集器程序将每隔5秒获取⼀次监控的性能指标数据,点击“下⼀步”:8、点击“完成”:9、在Perfmon⼯具界⾯,导航栏选中创建的“ETK”,右侧上⽅点击绿⾊的“启动”按钮,启动性能监控,启动后可查看到右侧“输出”显⽰前⾯第3步中设置的保存位置路径:10、前往输出路径⽂件夹查看⽣的⽇志,默认格式为.blg:11、为了⽣成.csv格式的数据,⽅便我们查看并分析,需要按下图步骤修改保存的⽇志格式为“逗号分隔”:12、重新查看⽣成的⽇志⽂件为.csv了,双击查看⽂件,可看到监控的数据,通过选中列并插⼊图表来查看监控时间段内性能指标的⼀个趋势:13、以上是Perfmon⼯具使⽤计数器⽇志监控的使⽤⽅法,在第⼀步中,还可以选择“从模板创建(推荐)”,模板的来源为第⼀次⼿动创建了⼀个数据收集器如ETK后,可以在Perfmon界⾯,左侧导航栏选择“ETK”,右键-保存模板,如下图:保存的模板为.xml格式,选择位置路径后点击“保存”:这样下次需要监控其他项⽬的性能指标(监控的指标也是ETK监控的那些指标,如内存、cpu、磁盘等)时,就不需要重新⼿动添加数据指标了,只需要选择“从模板创建”,选择本地模板即可。
HP-UX华为基础培训&
文件系统-扩大文件系统(2)
例如,想要扩大“/usr”到500M ,就键入命令: # umount /usr # lvextend -L 500 /dev/vg00/lvol4 假定 /usr 对应 /dev/vg00/lvol4 # extendfs /dev/vg00/lvol4 扩大文件系统。 (注:如果是vxfs文件系统,则用 # extendfs -F vxfs /dev/vg00/lvol4 ) # mount /dev/vg00/lvol4 /usr # init 3 进入原来多用户运行级。 删除逻辑卷 /dev/vg01/data # lvremove /dev/vg01/data
HuaWei HP-UX Training
CHP SSD SZ Wilson Bie 2000.3
HP-UX Trouble-shooting fundamental
基本命令 文件系统 网络配置 日志文件 常用系统文件 性能监控 备份与恢复
HP-UX
HP-UX 基本命令
# find find命令是功能最强的命令之一,但同时也是命 令行结构最难以掌握的命令之一。 # find / -print | wc -l 显示系统中所有文 件和目录的数目 # find / -user $LOGNAME -print 显示系统中该用户所有文件和目录。 # find / -size 100 -print 显示文件大小为100 blocks # find / -size -100 -print 显示文件大小小于100 blocks # find / -size +100 -print 显示文件大小大于100 blocks # find / -name core -exec rm {} \;查 找并删除core文件 # find . -exec chown $LOGNAME {} \; 修改当前目录下的所有文件的用户所属。 # find . -type d -exec
HP-OPENVIEW简介
HP OPENVIEW网络管理中心网管系统解决方案的特点我们推荐的网管系统解决方案体现以下特点网管工具支持领域广泛目前HP网络和系统管理工具可以涉及到:系统资源和资产管理,数据库管理,故障和事件管理,Internet业务管理,应用管理,PC机桌面管理,性能管理,网络结构管理,存储管理,用户帐号管理,安全管理,软件分发管理等多方面。
支持目前业界开放标准协议。
支持标准网络传输和网管协议,如TCP/IP,SNA,SNMP,RPC,CMIP等。
采用开放的、模块化体系结构,扩充性能好,异种网络管理能力强。
HPOpenView网管工具采用开放式网络管理标准,不仅OpenView内部各个产品可以相互集成共同操作,而且目前有近几百家网络和软件系统厂商提供在HP OpenView上的集成产品。
提供丰富的图形操作界面,能动态反映网络的拓扑结构,包括网络各种资源变化的自动监测,方便操作人员的网络运行状况监控。
HPOpenView网管系统中的各个产品都采用一致操作方式的图形界面,并且可以自动或根据用户设置动态反映网络拓扑结构和监测系统资源。
提供用户灵活的设置功能,如阀值设定,以监测网络故障的发生。
无论是故障和事件管理产品,数据库管理产品,资源和性能管理产品都能提供用户对希望监测系统参数的灵活阀值设置,以监测其运行状态。
提供丰富的应用程序接口,方便用户开发自己的网络管理程序。
H P OpenView提供多种用户二次开发根据,可以根据用户实际需要开发出符合自己需求的网管软件。
具有分发软件和数据的功能,数据能分发至各种机器上。
网络管理功能实现对网络管理功能实现,我们主要推荐采用HP OpenView Node Manager来实现。
HP OpenView最初为网络管理设计的,其最基础的产品是OpenViewNetworkNodeManager(NNM),NNM是网络和系统管理的基础和平台,NNM与第三方的管理应用集成在一起,可以形成强大的综合的管理环境。
使用PerfView监测.NET程序性能(二):Perfview的使用

使⽤PerfView监测.NET程序性能(⼆):Perfview的使⽤在中,我们了解了对Windows及应⽤程序进⾏性能分析的基础:Event Trace for Windows (ETW)。
现在来看看基于ETW的性能分析⼯具——Perfview.exePerfview简介Perfview是⼀个开源的CPU和内存性能分析⼯具,也包括⼀些针对.NET的分析功能,例如GC分析,JIT分析,甚⾄中的请求统计等等。
Perfview是⼀个Windows应⽤程序,但也能对在Linux系统上采集的数据进⾏分析()。
Perfview免安装,⽽且只是⼀个14M的.exe⽂件,⾮常容易部署到需要进⾏性能分析的机器上,例如⽣产环境的服务器。
⽽且在性能数据收集的过程中不需要重启应⽤程序或者服务器,⽽且收集的性能数据⽇志(.etl⽂件)可以被拷贝到其他Windows机器上,再进⾏分析⼯作,对业务的影响⾮常少。
Perfview已迁移到GitHub上,可以在上⾯下载Perfview.exe,clone库或者查看相关资料。
Perfview GitHub:Perfview视频教程:Vance Morrison关于Perfview的博客:Perfview使⽤在简单介绍Perfview后,我们来使⽤Perfview进⾏⼀个⼩⼩的性能分析,来熟悉⼀下Perfivew的基本操作。
这个实验使⽤的代码,就是Vance Morrison在视频教程中⽤到的Console程序。
代码可以在Perfivew⾃带的帮助⽂件中找到。
using System;// using System.Collections.Generic;class Program{public static int aStatic = 0;// Spin is a simple compute bound program that lasts for 5 seconds// It is a useful test program for CPU profilers.static int Main(string[] args){int numSec = 5;if (args.Length == 1)numSec = int.Parse(args[0]);Console.WriteLine("Spinning for {0} seconds", numSec);RecSpin(numSec);return0;}// Spin for 'timeSec' seconds. We do only 1 second in this// method, doing the rest in the helper.static void RecSpin(int timeSec){if (timeSec <= 0)return;--timeSec;SpinForASecond();RecSpinHelper(timeSec);}// RecSpinHelper is a clone of RecSpin. It is repeated// to simulate mutual recursion (more interesting example)static void RecSpinHelper(int timeSec){if (timeSec <= 0)return;--timeSec;SpinForASecond();RecSpin(timeSec);}// SpingForASecond repeatedly calls DateTime.Now until for// 1 second. It also does some work of its own in this// methods so we get some exclusive time to look at.static void SpinForASecond(){DateTime start = DateTime.Now;for (; ; ){if ((DateTime.Now - start).TotalSeconds > 1)break;// Do some work in this routine as well.for (int i = 0; i < 10; i++)aStatic += i;}}}以上代码很简单,SpinForASecond()在⼀秒内不断调⽤DateTIme.Now,⽽RecSpin()和RecSpinHelper()则不断地相互调⽤对⽅。
萨福铝焊机说明书
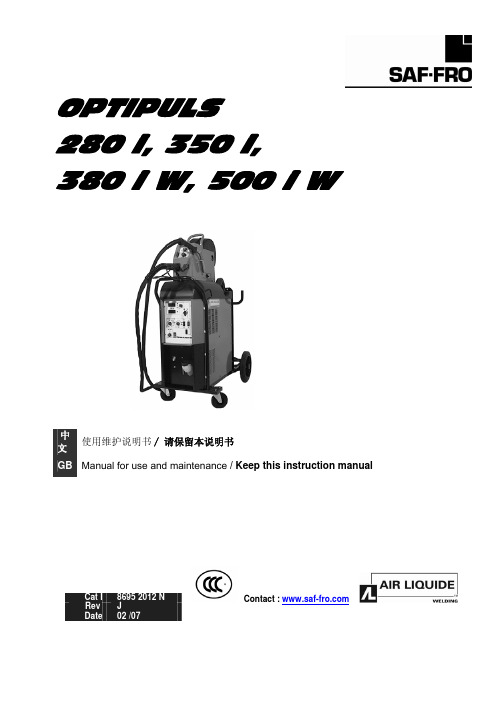
B - 安装调试 ............................................................................................................10 1. 拆除包装 .......................................................................................................10 2. 送丝机连接...................................................................................................10 3. 主电源的电路连接 .....................................................................................10 4. 焊枪的连接...................................................................................................10
中文
目录
安全说明 .....................................................................................................................2
A - 总体介绍 ...............................................................................................................7 1. 装置简介 .........................................................................................................7 2. 焊接设备组成 ................................................................................................7 3. 前面板描述.....................................................................................................8 4. 选配件..............................................................................................................8 5. OPTIPULS i / i W技术规格 .............................................................................8 6. 尺寸和重量.....................................................................................................9 7. 冷却装置的技术规格......................................................................................9
perforce使用教程(zz)
perforce使用教程(zz)Perforce是一款强大的版本控制系统,用于协调团队软件开发工作。
它的主要功能包括文件版本管理、并发开发支持、文件差异比较和合并、用户权限管理等。
在本篇文章中,我将为您介绍Perforce的基本使用方法和常见命令。
一、安装和配置2. 打开命令行工具,运行"P4V"命令,启动Perforce可视化界面。
3. 在Perforce界面中,选择"File" -> "New Connection"来创建一个新的连接。
4. 在弹出的窗口中,填写服务器IP地址、端口号和账号等信息,点击"Connect"按钮连接到服务器。
二、创建和提交工作空间1. 在Perforce界面中,选择"Edit" -> "Workspace"来创建一个新的工作空间。
2.在弹出的窗口中,填写工作空间的名称、属主和本地路径等信息。
3. 选择需要同步的文件夹或文件,点击"Submit"按钮来同步代码到本地工作空间。
4. 在本地工作空间中进行修改后,选择"Submit"按钮来提交修改到服务器。
三、获取最新代码1. 在Perforce界面中,选择"File" -> "Get Latest Revision"来获取服务器上最新的代码。
2. Perforce将会自动更新您的本地工作空间,使之与服务器上的代码保持同步。
四、文件差异比较和合并1. 在Perforce界面中,选择要比较的文件,点击右键,选择"Diff Against" -> "Latest Revision",来比较文件与最新版本之间的差异。
2. Perforce将会展示文件的变动,并将差异以不同的颜色标记出来。
MICROCHIP MPLAB IDE 说明书
MPLAB®IDE用户指南© 2005 Microchip Technology Inc.DS51519A_CNDS51519A_CN 第ii 页© 2005 Microchip Technology Inc.提供本文档的中文版本仅为了便于理解。
MicrochipTechnology Inc.及其分公司和相关公司、各级主管与员工及事务代理机构对译文中可能存在的任何差错不承担任何责任。
建议参考Microchip Technology Inc.的英文原版文档。
本出版物中所述的器件应用信息及其他类似内容仅为您提供便利,它们可能由更新之信息所替代。
确保应用符合技术规范,是您自身应负的责任。
Microchip 对这些信息不作任何明示或暗示、书面或口头、法定或其他形式的声明或担保,包括但不限于针对其使用情况、质量、性能、适销性或特定用途的适用性的声明或担保。
Microchip 对因这些信息及使用这些信息而引起的后果不承担任何责任。
未经Microchip 书面批准,不得将Microchip 的产品用作生命维持系统中的关键组件。
在Microchip 知识产权保护下,不得暗中或以其他方式转让任何许可证。
商标Microchip 的名称和徽标组合、Microchip 徽标、Accuron 、dsPIC 、K EE L OQ 、micro ID 、MPLAB 、PIC 、PICmicro 、PICSTART 、PRO MATE 、PowerSmart 、rfPIC 和SmartShunt 均为Microchip Technology Inc .在美国和其他国家或地区的注册商标。
AmpLab 、FilterLab 、Migratable Memory 、MXDEV 、MXLAB 、PICMASTER 、SEEVAL 、SmartSensor 和The Embedded Control Solutions Company 均为Microchip Technology Inc .在美国的注册商标。
嵌入式环境perf工具编译使用指南
嵌入式环境perf工具编译使用指南1. 什么是perf?嘿,朋友们!今天咱们来聊聊一个在嵌入式环境中挺有用的工具——perf。
要说这个perf,它可不是啥高大上的东西,其实就是一个性能分析工具,专门用来帮我们看看程序在运行的时候,究竟发生了什么。
简单点说,就是给我们提供一面“照妖镜”,能让那些隐藏的性能瓶颈无处遁形!当你写代码的时候,难免会有点“卡”,这时候perf就像你的小助手,帮你找出问题所在,真是帮大忙啊。
2. 为什么要使用perf?2.1 性能优化的“秘密武器”首先,你可能会想,性能分析工具到底有啥用呢?简单来说,它能让你看到程序运行时的CPU占用情况、内存使用情况等等,让你在优化代码时有的放矢,不至于瞎折腾。
你知道的,很多时候咱们在开发的时候,感觉某个地方慢得像蜗牛,结果一看,发现问题根本不在这儿,perf帮你指引方向,真是“明察秋毫”!2.2 容易上手,简单粗暴另外,perf的使用也相对简单,不用担心它复杂得像解谜游戏。
很多新手刚接触时会觉得有点畏惧,其实完全不必!就像学骑自行车,开始可能有点摇摇晃晃,但掌握了技巧后,嘿,简直是风驰电掣。
perf的命令行界面让你很快上手,只要掌握几个基本的命令,就能开始你的性能分析之旅了。
3. 如何编译和使用perf?3.1 编译perf的准备工作好啦,既然我们知道perf有多牛了,接下来就要看看怎么把它变成你的“私人教练”了。
首先,你得确保你的嵌入式环境里有一些基本的编译工具,比如gcc,make等等。
这些工具就像是你厨房里的锅碗瓢盆,缺了可不行。
然后,咱们从内核源码里获取perf 的源代码,别担心,这个步骤就像网上买衣服,一会儿就能搞定。
把源代码下载下来,解压缩,就可以开始编译了。
3.2 编译和安装好了,接下来进入正题——编译!打开终端,进入到perf的源码目录,输入几个简单的命令,像是:```bashmakesudo make install```等这两条命令一执行,你就等着喝茶,稍等片刻,perf就安装好了!这时候,你可能会想,“这么简单,真是天上掉下来的馅饼!”当然啦,编译过程中的各种依赖关系可能会让你小头疼,但只要按照提示来,一般都能顺利解决。
perf的用法
perf的用法一、perf的介绍与背景性能分析工具是开发过程中不可或缺的重要工具之一,其帮助开发者检测和优化程序在运行时的性能表现。
而在Linux操作系统中,perf则是一个广泛使用的性能分析工具。
它提供了各种功能强大的命令和选项,用以收集系统层面、内核层面以及用户空间程序的性能数据,使得开发人员可以深入了解和改善软件的性能瓶颈。
二、perf的基本用法1. 安装perf首先,确保你使用的Linux操作系统版本已经安装了perf。
如果没有安装,可以通过以下命令进行安装:```sudo apt-get install linux-tools-common```2. 收集CPU性能数据为了便于后续分析和优化,我们需要先收集程序执行期间CPU相关的性能数据。
以下命令将启动perf,并开始记录指定进程(PID)或程序(Command)执行过程中产生的CPU事件(cycles):```sudo perf record -e cycles -p <PID>```3. 分析性能数据收集完CPU性能数据后,我们可以使用perf进行分析和报告生成。
以下命令将读取刚才记录下来的数据文件,并生成一个报告:```sudo perf report```报告会包含有关程序执行期间各个函数的调用次数、执行时间、缓存命中率等重要信息。
通过分析报告,我们可以识别性能瓶颈所在,并进行进一步的优化。
三、perf高级用法1. 事件选择器除了收集CPU周期外,perf还支持收集多种系统事件,例如Cache命中、缺页异常等。
使用以下命令可以查看所有可用的事件:```sudo perf list```然后,你可以根据自己的需求选择适当的事件来收集数据。
2. 调用图为了更好地理解程序运行期间函数之间的调用关系,我们可以使用perf的调用图功能。
以下命令会生成一个被称为火焰图(Flame Graph)的可视化结果:```sudo perf record -g -p <PID>sudo perf script > out.perf./stackcollapse-perf.pl out.perf | ./flamegraph.pl > graph.svg```生成的graph.svg文件可以在浏览器中打开,展示了每个函数在运行过程中消耗CPU时间的比例。
perf probe用法
perf probe用法perf probe是一个在Linux内核中进行性能跟踪的工具,它允许开发人员在不修改内核源代码的情况下,通过在运行时动态插入探测点来收集性能数据。
本文将详细介绍perf probe的用法,并通过一系列步骤来解释这个功能的实际操作。
# 第一步:安装perf工具要使用perf probe,首先要确保已经安装了perf工具。
可以通过在终端中运行以下命令来检查是否已安装perf工具:perf version如果你还没有安装perf工具,可以使用以下命令在Ubuntu上安装:sudo apt-get install linux-tools-common linux-tools-(uname -r)# 第二步:确认目标内核版本perf probe要求目标系统上运行的内核版本为2.6.32及以上。
你可以使用以下命令来检查目标系统的内核版本:uname -r如果你的内核版本低于2.6.32,你需要更新你的内核。
# 第三步:选择要探测的函数在使用perf probe之前,你需要确定要对哪个函数进行性能分析。
你可以选择一个已知的函数,或者如果你有自己的代码,可以选择其中的一个函数。
# 第四步:使用perf probe添加探测点现在,我们可以利用perf probe在目标函数中插入探测点来收集性能数据。
在终端中运行以下命令:sudo perf probe -x /path/to/vmlinux [function_name]- `/path/to/vmlinux`是目标系统的vmlinux文件的路径。
这个文件通常存储在`/usr/lib/debug/boot/`目录下。
你可以使用以下命令找到路径:find /usr/lib/debug/boot/ -name "vmlinux-*"- `[function_name]`是你要探测的函数的名称。
# 第五步:确认探测点是否成功运行命令后,perf probe会尝试在目标函数中插入探测点。
- 1、下载文档前请自行甄别文档内容的完整性,平台不提供额外的编辑、内容补充、找答案等附加服务。
- 2、"仅部分预览"的文档,不可在线预览部分如存在完整性等问题,可反馈申请退款(可完整预览的文档不适用该条件!)。
- 3、如文档侵犯您的权益,请联系客服反馈,我们会尽快为您处理(人工客服工作时间:9:00-18:30)。
PerfView - A Tool for Source-Level Performance Analysis on the Itanium Processor FamilyAnanth LingamneniMaster of Science, Computer & Information SciencePlan B ProjectUniversity of MinnesotaAdvisor : Prof. Wei-Chung HsuAbstractApplication performance analysis in modern microprocessors has become extremely complex due to substantial instruction level parallelism, complex processor pipelines and deep memory hierarchies. Performance analysts need to have a thorough understanding of the dynamic behavior of programs in order to identify and fix performance bottlenecks. In order to help in the performance analysis process, modern day processors are providing hardware support in the form of performance registers that help to capture microarchitectural events that occur during the running of a program. However, the data provided by the hardware registers is at a very low level and an extensive effort has to be made by performance analysts to make sense of the data. Therefore, it is extremely beneficial to make use of performance analysis tools that can assemble various types of complex performance related data available from the performance registers and provide a high level summary of the data. In this paper, I discuss PerfView, a performance analysis tool for the Itanium Processor family, that can be used to correlate low level program profile data with corresponding source code, and provide an execution trace of the statements leading to the regions of performance bottlenecks.1IntroductionMicroprocessor speeds have been increasing at a dramatic rate leading to very high peak performances. However, other components of the computer system such as the memory system have not been able to keep up with these enormous speed improvements, and have consequently proved to be a bottleneck in achieving processor peak performance. The complex memory systems with deep hierarchies result in high latency cache misses, and this significantly affects the performance of the processor. With complex pipelines, branch mispredictions too have a significant effect on the performance of the processor. It is therefore becoming increasingly necessary to analyze the dynamic behavior of applications to identify and fix performance bottlenecks such as cache misses and branch mispredictions in order to achieve a major fraction of the processor peak performance. However, the performance analysis of applications has also become extremely difficult due to the substantial instruction level parallelism, complex processor pipelines and deep memory hierarchies.In order to help in performance analysis, modern microprocessors are providing special hardware support in the form of performance registers that capture data related to events affecting performance. Specifically, the IA-64 architecture specifies a single hardware component called the Performance Monitoring Unit(PMU) which provides detailed low-level profiling information, and captures information related to microarchitectural events that occur during the running of a program. The PMU can be programmed to capture information about specific events at specific sampling periods. Though the information provided by the hardware registers is very useful, it requires a substantial effort on the part of the performance analyst to analyze the low-level data, to identify the key bottlenecks and the causes for these bottlenecks. In light of this, I propose PerfView - a tool to provide a high-level view of the performance data obtained from the PMU of the Itanium Processor family. PerfView processes the data captured by the performance registers and identifies the regions of the source program that are responsible for a high number of performance related events. The information is provided at the source code and assembly code level. After highlighting lines in the source codehaving high event activity, PerfView also provides for a sorted set of execution traces leading to the specific source line. This helps to identify the cause for specific events.2PerfView Architectural Framework2.1 Itanium-2 Performance Monitor Unit(PMU)The IA-64 architecture specifies special hardware support in the form of the PMU to help in characterizing application performance. The interface to the PMU consists of a set of dedicated registers that can be programmed to count occurrences of certain micro-architecture events such as number of cycles elapsed or the number of cache misses in the L1 cache. The register file is composed of the performance monitor data(pmd) registers which collect the data, and the performance monitor configuration(pmc) registers which are used to configure the events to be monitored.The Itanium-2 PMU provides four 48-bit performance counters that help in counting up to 4 micro-architectural events simultaneously. The 4 counting monitors use 4 pairs of registers(pmc4-pmc7 and pmd4-pmd7). The configuration registers pmc4-pmc7 are used to configure the events that are to be counted by the data registers pmd4-pmd7. Each of these 4 data registers contain a counter that is incremented each time an event specified by the configuration register occurs. When a counter eventually overflows and wraps around to 0, this condition is detected and stored in the pmc0-pmc3 registers, the overflow status registers. The PMU can be programmed to generate an interrupt whenever a pmd register overflows. This interrupt facility can be used by the operating system to maintain a 64 bit software counter for every hardware counter. The pmd register that overflowed can be determined by inspecting the overflow status registers, pmc0-pmc3.The PMU also provides filters such as opcode matchers and address range matchers that help to provide a finer control over the events being monitored. With the help of these counters and filters, the PMU can be used for cycle accounting to help in breaking down the number of cycles that are lost due to various kinds of micro-architectural events. By classifying the stall cycles, it is possible to identify performanceproblems and possible solutions. For instance, if there a large number of stalls due to instruction accesses, prefetching the instructions may help in improving performance.Cycle accounting is very helpful in characterizing the overall behavior of applications, but does not help in identifying the specific locations in the program that are responsible for performance related events. In order to address this problem, the Itanium-2 processor provides a set of Event Address Registers(EARs) that can be programmed to capture micro-architectural event information along with the instruction pointer(IP) related to that event. In the absence of Event Address Registers, the IP address captured on the occurrence of an event can be many instructions beyond the instruction that actually triggered the event. When such a “skid” occurs, programmers and performance tools must perform additional analysis to "guess" the possible IP location associated with the performance event. The provision of EARs greatly simplifies the use of the reported IP locations. Some limitations with the use of EARs will be discussed in section 5.The EARs can be used for data, instruction and branch events, and can capture information such as the latency of a cache miss or the level of the TLB in which a miss is resolved, in addition to the instruction pointer. The cache miss events can be captured at programmable frequencies. For example, we can program the PMU to generate an interrupt for every 500 data cache misses having a miss latency greater than 8 clock cycles.In addition to the EARs, the PMU provides an eight entry Branch Trace Buffer(BTB) that can record a trace of the branch instructions executed. It is possible to configure the BTB to capture only a specific subset of branches such as taken branches, not taken branches, correctly predicted and incorrectly predicted branches. The BTB can record up to four branches in the buffer and for each, the source and target addresses are captured.2.2 Kernel support for configuration of the PMUThe Linux kernel includes a subsystem called perfmon to provide access to the IA-64 PMU. The perfmon interface consists of a single system call, perfmonctl() which supports a set of requests to configure, measure, and collect performance monitoring information by providing read and write access to the pmd and pmc registers.Setting up the PMU for monitoring involves programming the pmc registers with information such as the events to be monitored, the privilege level at which monitoring is to occur and interrupts to be generated on counter overflow. For event-based sampling, at least one counter has to be programmed to generate interrupts at the end of each sampling period. The sampling period defines the distance between two samples as an event count.At the end of each sampling period, the perfmon overflow interrupt handler records the contents of a set of specified pmd registers in a sampling buffer, the size of which can be configured by the monitoring task. When the sampling buffer becomes full, the perfmon overflow handler sends a signal to the monitoring task. The monitoring task can now process the contents of the filled sampling buffer through its signal handler. In order to avoid copying of large amounts of data from the kernel area to the application, perfmon automatically maps the buffer read-only into the user address space of the monitoring task.2.3 Pfmon - A user level tool for performance data collectionTo simplify the task of setting up the PMU for monitoring applications, a user level tool called pfmon can be used. The tasks performed by Pfmon for monitoring a single application are as follows :1.Pfmon takes in parameters such as the events to be monitored, the samplingperiods and the file in which the collected data is to be stored, and then uses the perfmon kernel interface to set up the PMU accordingly. This sets up a performance context for the pfmon process which is inherited by any child process, and the performance registers are saved on context switches.2.Pfmon registers a signal handler to process the contents of the sampling bufferwhen it receives a signal from the perfmon subsystem. The contents of the sampling buffer are generally stored in a file on secondary storage for further analysis.3.Pfmon then forks the application to be monitored. The forked process inherits theperformance context from pfmon and is monitored as it runs.The overhead of gathering the performance samples is not very high. The table below shows the overhead of collecting samples when using the SPEC CPU2000 integer benchmarks as the workload and measuring at different sampling rates.Monitored Events SamplingPeriod = 1KSamplingPeriod = 5KSamplingPeriod = 50KSamplingPeriod = 100KSamplingPeriod = 500KICache ~ 4.6% ~ 0.7 % < 0.1%Icache + BTB ~ 10% ~ 2% <0.1%CPUCycles ~1.4%<0.1%As can be seen from the above table, the overhead when sampling 1 in 50K I-Cachemisses is negligible, and this sampling period seemed as successful in identifying the topmisses as a higher sampling frequency.2.4 Perfview - Performance data processingThe data collected by pfmon consists of all the samples taken during a monitoringsession. In order to understand the performance behavior of the monitored application, itis necessary to extract the relevant information from the collected data, and summarize itto provide a high level view of the data.Perfview has been designed to sort out and group the samples according to IP addresses collected from the Event Address registers, in order to help in identification ofthe most frequently occurring IP addresses. This enables identification of hot spots in theprogram with respect to performance bottlenecks. For instance, if the monitoring wasbased on Instruction cache miss sampling, the IP addresses occurring most often in theEvent Address registers correspond to instructions that missed most frequently in thecache. Identification of hot spots in an application is an important step when trying totune for performance since 80 percent of the execution time falls in 20 percent of thecode.Perfview also associates the collected samples with corresponding entries from the Branch Trace Buffer, enabling the construction of an execution trace leading to theevent of interest.Finally, Perfview maps the IP addresses back to the source code using the debugging symbol table information present in the executable. This helps in identifying the code and data structures that are the causes for various bottlenecks, and possible reasons for the bottleneck.Fig 1. Architectural framework for PerfView3Using PerfViewPerfview provides a graphical user interface for setting up a performance monitoring session and correlating data from the Performance Monitoring Unit with program source code. A performance monitoring session consists of programming the pmc and pmd registers of the PMU to set up a performance context for the process to be monitored.Fig 2. Dialog box for setting up a monitoring sessionIn order to help the user in setting up a monitoring session, Perfview provides a dialog box as shown in figure 2, for setting up values for each of the following parameters :Sampling Event : This specifies the event on which the counting monitors of the PMU will be activated. i.e. Whenever the specified sampling event is detected by the processor, the performance counter is incremented by 1. For instance, if the sampling event is set to be all Taken Branches, the PMU is configured such that a performance counter is incremented by one for each branch that is taken.Sampling Period : The sampling period specifies the number of occurrences of an event that needs to occur before a sample is recorded in the sampling buffer. For instance, if a sampling period of 50000 was selected with Taken Branches as the sampling event, then a single sample of the performance registers from the PMUwould be recorded in the sampling buffer for every 50000 taken branches that occur.Other events to be captured : This is used to specify the event information that is to be captured by the PMU and stored in the sampling buffer. By default, the PMU only stores information about the event specified as the sampling event. To make the PMU store information about other events, the user selects the required events from the list of options provided by Perfview. Each sample recorded in the sampling buffer consists of the contents of the performance data registers that contain information relevant to the events selected by the user. For instance, if the user has opted to collect information on Data Cache misses and Instruction cache misses, each sampling buffer entry on an Itanium machine will contain the contents of performance registers pmd2(memory address responsible for the data cache miss), pmd3(latency of the cache miss), pmd17(IP address of instruction causing the data cache miss), pmd0(IP address of instruction causing the Instruction cache miss) and pmd1(latency of Icache miss).Latency of misses to be captured : In the case of capturing cache miss events, it is possible to filter out events which are responsible for latencies that are lower thana selected value. This enables a finer control over the type of cache miss eventsthat are captured. By specifying that all cache misses causing latencies greater than 4 cycles are to be captured, the PMU can be programmed to capture all L1 cache misses.Based on the above description, if the user wishes to capture branch traces for every 5000 instruction cache misses with a latency greater than 4, the following options have to be selected :Sampling event : Instruction Cache MissSampling Period : 5000Other events to be captured : Taken BranchesMiss Latency : >=4Once the configuration for the PMU has been performed as specified above, PerfView is ready to monitor an application. The application which is to be analyzed has to be compiled with debug information, so as to include the debugging symbol table with the object file. The addition of debugging information to the executables does not affect compiler optimizations and there is no notable difference in the execution time of the executable. In the case of the gcc compiler, the –g flag is specified to include debugging information in the object file. PerfView makes use of the debugging symbol table to map IP addresses obtained from the PMU to the source code statements. This makes it necessary that the source files be present in the same location that they were at the time of compilation.To start running an application with performance monitoring turned on, the user needs to specify the command used to start the application along with any necessary command line arguments in the text box present at the top right corner of the PerfView application window. This is similar to typing in the command to start the application at the shell prompt. It is necessary that any filenames specified in the command should have a pathname relative to the directory from which the PerfView tool is being run, or the pathname should be absolute. Once the command has been typed, the run button is clicked to start running an instance of the application.When the run button is clicked, an instance of the pfmon process is started which in turn initiates the application to be analyzed with a performance context attached to it. As the application runs, information about the required events is captured by the PMU. At the end of each sampling period, the contents of the performance registers are copied into the sampling buffer. When the sampling buffer overflows, the signal handler registered by pfmon is used to copy the samples in the buffer to a file. This process continues till the monitored application terminates.Once all the performance samples about the behavior of the application are stored in a file, PerfView goes about analyzing the data, and finally presents a high level view of the collected performance data by highlighting regions of performance bottlenecks in the source code.The PerfView interface consists of a single application window with multiple frames. A screenshot of the interface displaying some data from the gcc benchmark program is shown in figure 3.The top right frame of the application window displays a single file at a time. The source lines that were responsible for a significant fraction of the monitored events are highlighted. The source lines are augmented with line numbers, and a count of the number of events that occurred at each highlighted line is displayed in the top left frame.Fig 3. User Interface provided by PerfViewThe top left frame consists of links to source files for which there is performance information. Clicking on a file name in the left frame causes the file to be displayed in the source file frame on the right. In addition to filenames, there is also a listing of line numbers and the event counts associated with each of these line numbers. Clicking on a line number displays the corresponding line of the file to which the line number belongs, in the source file frame.The bottom frame displays any errors that may have occurred during the running of the application, and any output that is generated by pfmon.A single source line statement may be performing a large number of machine level operations, and this may make it difficult for a performance analyst to exactlyidentify the reason for a performance bottleneck at a particular line. For this purpose, it was felt that the performance information should also be provided at a finer granularity, namely the assembly code level. Clicking on any highlighted line with the left mouse button will open up a new window displaying the assembly code corresponding to the clicked source line and a few immediately surrounding lines. The exact assembly code statement whose IP address was initially captured as the source of the event by the performance registers is highlighted as shown in figure 4. If multiple assembly statements contributed to the high amount of event activity at the selected source line, then each assembly statement is augmented with a number indicating the percentage contribution of that statement to the total events occurring at the source line. This information at the assembly level should give the user a clearer picture about the nature and cause of the bottleneck in a piece of code.Fig 4. Assembly Code WindowIf the monitoring session included capturing the contents of the Branch Trace Buffer, then there is a provision to display a set of execution traces sorted on the number of occurrences of the trace. The execution traces are associated with captured events sothat it enables the user to view the top execution traces leading to an event of interest. This would help in identifying the reason for the occurrence of the event.The execution traces can be viewed by clicking on any the highlighted source lines with the right mouse button. When the line is clicked, the bottom frame of the application window displays a list of hyperlinks linked to the top execution traces leading to the clicked line. Clicking on each hyperlink opens up a new execution trace window as shown in figure 5, which consists of three blocks of code, that were executed before the selected source line was executed. The three blocks of code can be displayed either in source code or assembly code. The assembly code view is provided since compiler optimizations rearrange statements such that the execution sequence does not match the sequence of source code statements.Fig 5. Execution Trace Window4Case Study4.1 Cycle AccountingIn general, the first step in the performance tuning of an application is to identify the nature of performance bottlenecks affecting the application. This could be accomplished by looking at basic cycle accounting to understand the efficiency with which the processor is executing the instructions. Cycle accounting involves accounting for each cycle as either an inherent execution cycle or a stall cycle and this helps in giving a high level view of how the processor is spending its time. Studying the stall cycles is useful for identifying performance problems and possible solutions.By performing cycle accounting, it is possible to narrow down the performance bottlenecks that need to be studied. If a particular bottleneck is responsible for a majority of the stall cycles, then it is most beneficial to study the program with respect to that particular bottleneck. For instance, by performing cycle accounting it can be found that the gcc SPEC 2000 benchmark program has an L1 I-Cache hit ratio of just about 60%. Consequently, maximum benefit can be gained by studying the I-Cache behavior while running the gcc program. Similarly, the mcf benchmark program can be seen to have an L1 D-cache hit ratio of less than 10%.4.2 Using PerfViewThe use of PerfView for the analysis of the GCC SPEC 2000 benchmark program is now discussed.The gcc program is first compiled with debug information. Next, the PMU is configured for a monitoring session by using the ‘Setting’ menubar option at the top of the PerfView application window. The sampling event is set to Instruction cache misses because it has been determined through cycle accounting that gcc suffers from a large number of I-cache misses. In order to help in identifying the reason for the I-cache misses, the taken branches are also captured. This helps in constructing an execution trace leading to the I-cache miss. The sampling period is set to 5000 and the miss latency is set to >=4 to capture all L1 I-cache misses.The gcc program is now started by typing in the command in the text box in the upper right corner and then clicking on the Run button. At this time, PerfView forks a pfmon process which in turn forks the gcc process with a performance context attached to it. The PMU now captures information about the I-cache misses and taken branches as the gcc process continues to run. When the gcc process terminates, all the performance samples are placed in a file. PerfView now processes this performance data and presents it by highlighting source lines responsible for high event activity.From figure 6, it can be seen that the source line number 7290 in the file cse.c was attributed with the occurrence of 926 I-cache miss events. The source statement on this line corresponds to a For statement in the C language. In this case, the I-cache miss events could have occurred either at the beginning of the For loop(test for i<10) or at the end of the loop(i++). In order to identify the exact location of the occurrence of the event in the source statement, it is necessary to look at the assembly code statements corresponding to the source line statement. This is done by clicking on the highlighted line with the left mouse button. This opens up a new window displaying the assembly code corresponding to the clicked line(7290) and immediately surrounding lines, as shown in figure 7.Fig 6. Source Line highlighting windowFig 7. Assembly code windowIn the assembly code window, each assembly statement that contributes to the event count of the source statement is highlighted and its percentage contribution is augmented at the end of the assembly statement. In figure 7, it can be seen that the assembly statement at IP address 0x4000000000183940 was responsible for all the event activity occurring at the source line 7290. From this, it can be inferred that the I-cache miss events actually occurred at the end of the For loop.In order to identify the cause for the I-cache miss events, it is useful to look at the execution traces leading to the events. To do this, right click on the highlighted line. This immediately opens up a set of links in the bottom frame of the window. These are links to execution traces sorted according to the number of occurrences. When any of the linksare clicked, an execution trace window is displayed as shown in figure 8.Fig 8. Execution Trace WindowFigure 8 shows the top execution trace leading to the I-cache misses at line 7290. To get a more detailed view of the execution trace, there is a link provided to view the traces in assembly code as shown in figure 9. From the execution traces, it can be inferred that the I-cache miss event occurs most frequently when the value of the variable n_sets is 1, and the for loop statement at line 7283 exits after just one iteration without gettinginto the body of the If statement at line 7284.Fig 9. Execution Trace in Assembly WindowOnce the regions of performance bottlenecks and the possible reasons are analyzed as just described, it is possible to apply optimization techniques such as instruction prefetching, and evaluate their effect on performance. In the same way, the other highlighted lines are evaluated.The effect of D-cache miss events on the program can be analyzed by programming the PMU to sample on those events, and then carrying out the detailed analysis as explained above.5Implementation issuesThere are some limitations in providing a high level view of the performance datacollected by the PMU. Some of the information that is present at the IP address level maynot be apparent to the user when given a source code level view. Listed below are a few of the limitations and design decisions taken during the implementation of PerfView :The Instruction Event Address registers which capture the IP address responsible for cache misses triggered by instruction fetches, record the instruction cache line that triggered the miss, and not the address of the exact bundle responsible for the miss. On Itanium-2, an L1 cache line is 64 bytes long(4 bundles), and this means that in cases when execution jumps directly to the middle of a cache line, the miss address does not correspond to the bundle that was about to be executed. This could cause the wrong source statement to be attributed for the miss.Due to compiler optimizations, the attributed statement may actually be more than a few source statements away from the actual statement responsible for the miss. For this reason, we provide for the identification of instructions attributed to performance events at the assembly code level too. At the assembly level, the attributed bundle can be at most three bundles away from the actual bundle responsible for the event, and in most cases, the user can clearly identify the assembly instruction most likely to have been responsible for the event.In the case of C macro statements which are expanded by the preprocessor, all events associated with any of the expanded statements will be attributed to the single macro source statement. This makes it impossible to identify the actual cause for the performance bottleneck. As above, in this case too, the information provided at the assembly code level can be useful to identify the individual instruction responsible for the concerned event.Source code statements will not always give a clear idea about the location or cause for a performance bottleneck. For instance, in the case of a For loop statement in the C language, an event could occur either at the beginning of the loop or at the end of the loop. The exact location cannot be determined by just looking at the source code statement as described below :。