对比度拉伸实验(遥感导论)
遥感图像增强实验报告
遥感图像增强实验报告1. 实验目的和内容实验目的:(1)遥感图像的空间域增强:通过直接改变图像中的单个像元及相邻像元的灰度值来增强图像,是图像增强技术的基本组成部分,包括点运算和邻域运算。
(2)遥感图像的频率域增强:通过对频率域的调整对遥感图像进行平滑和锐化,平滑主要是保留图像的低频部分抑制高频部分,锐化则保留图像的高频部分而削弱低频部分。
(3)遥感图像的彩色增强:将黑白图像转换成彩色图像,使地物的差别易于分辨,突出图像的有用信息,从而提高对图像的解译和分析能力。
实验内容:(1)遥感图像的空间域增强:点运算—直方图均衡化、灰度拉伸、任意拉伸,邻域运算—图像平滑、图像锐化。
(2)遥感图像的频率域增强:定义FFT,反向FFT,再进行对比。
(3)遥感图像的彩色增强:多波段影像—彩色合成、单波段影像—伪彩色增强、色彩空间变换、遥感数据融合。
2. 图像处理方法和流程A.遥感图像的空间域增强1.直方图均衡化(1)在主窗口中打开can_tmr.img文件。
(2)以gray形式显示一个波段。
(3)Display窗口>enhance>equalization2.灰度拉伸(1)Display窗口>enhance>interactive stretching(2)弹出的对话框>stretch_type>linear(3)在STRETCH对应的两个文本框中输入需要拉伸的范围,然后单击对话框上的APPLY按钮,图像显示为线性拉伸后的效果。
3.任意拉伸(1)弹出的对话框>stretch_type>Arbitary,在output histogram中单击绘制直方图,右键结束(2)点击apply,结果如图所示4.图像平滑(1)均值平滑,在主窗口中打开can_tmr.img文件。
主窗口>enhance>filter>smooth[3*3]。
结果如图所示(2)中值平滑,在主窗口中打开can_tmr.img文件。
实验三:遥感图像拉伸处理

辐射增强处理(Radiometric Enhancement)
①直方图均衡化(Histogram Equalization):点击Interpreter 图标 一Radiometric Enhancement一Histogram Equalization,打开Histogram Equalization对话框。
直方图均衡化实质 上是对图像进行非线性 拉伸,重新分配图像像 元值,使一定灰度范围 内像元的数量大致相等; 这样,原来直方图中间 的峰顶部分对比度得到 增强,而两侧的谷底部 分对比度降低,输出图 像的直方图是一较平的 分段直方图,如果输出 数据分段值较小的话, 会产生粗略分类的视觉 效果。
②直方图匹配(Histogram Match) 点击Interpreter图标一Radiometric Enhancement 一 Histogram Match,打开Histogram Matching对话框。
直方图匹配是对图像查找表进行数学变换,使一幅图像的直方图与另一 幅图像类似。直方图匹配经常作为相邻图像拼接或应用多时相遥感图像进行 动态变化研究的预处理工作,通过直方图匹配可以部分消除由于太阳高度角 或大气影响造成的相邻图像的效果差异。
实习三 遥感图像增强
ห้องสมุดไป่ตู้
滁州学院国土信息工程系
(1)背景知识
在获取图像的过程中,由于多种因素的影响,导致图像质量 多少会有所退化。图像增强的目的在于:(1)采用一系列技术改 善图像的视觉效果,提高图像的清晰度;(2)将图像转换成一种 更适合于人或机器进行分析处理的形式。通过处理设法有选择地 突出便于人或机器分析某些感兴趣的信息,抑制一些无用的信息, 以提高图像的使用价值。 增强的方法往往具有针对性,增强的结果只是靠人的主观感 觉加以评价。因此,图像增强方法只能有选择地使用。 图像增强方法从增强的作用域出发,可分为空间域增强和频 率域增强两种。空间域增强是直接对图像像素灰度进行操作;频 率域增强是对图像经傅立叶变换后的频谱成分进行操作,然后经 傅立叶逆变换获得所需结果。
7遥感原理与应用-图像拉伸(1)

注意: 1)直方图均衡化,不改变灰度出现的次数(因为 那样会改变图像的信息结构),所改变的是出现 次数所对应的灰度级。
T rK
k ni n i0
/*矫正后非零像素数同矫正前
2)直方图均衡化,力图使等长区间内出现的像素 数接近相等。
2.3 图像均衡化
原始图像及直方图
2.3 图像均衡化
遥 感 图 像 增 强
图像增强
定义:用于改善图像的对比度,突出感兴趣的地物信息,提高 图像目视解译效果的图像处理方法。
目的:提高图像质量和突出所需信息,有利于分析判读或作进 一步处理。
特点: 图像的信息没有增加或减少 改善了视觉效果 产生了更容易处理的图像 具有探索性
分类:
改善图像对比度 增加可视化信息
第一节 图像的彩色合成
1.1 彩色图像与彩色合成
彩色图像
真彩色图像:图像的色调与人眼视觉所看到的颜色基本一 致的图像 假彩色图像:图像的色调与实际地物色调不一致的图像
彩色合成
伪彩色合成:将单波段图像转变成为彩色图像 彩色合成:包括真彩色和假彩色合成 模拟真彩色合成:通过模拟产生近似真彩色图像
1.1 彩色图像与彩色合成
2.4 图像规定化-直方图匹配
匹配参考图像及直方图
2.4 图像规定化-直方图匹配
规定化处理后图像及直方图
2.4 图像规定化-直方图匹配
规定化处理前后直方图对比
1.彩色图像有哪几类? 2.图像合成有哪些方法?各
有什么特点? 3.假定有一幅64*64的8灰度
级层次的图象,其灰度分布 如图所示,给出均衡化过程
变换前亮度值
b-a
2.2 灰度拉伸
线性拉伸: 全域线性拉伸:
环境遥感-遥感图像处理之图像增强
一、 K-L、K-T变换
1、K-L变换
➢ 解决数据冗余
一、 K-L、K-T变换
1、K-L变换
K-L变换:离散(Karhunen-loeve)变换的简 称,又被称作主成分变换。它可以将n个波段的大 部分信息压缩到几个新波段或所谓的主成分上。
一、 K-L、K-T变换
1、K-L变换
➢ 主成分之间相关性很小且信息量集中于主成分分量。
一、 K-L、Biblioteka -T变换2、K-T变换亮度分量
绿度分量
湿度分量
一、 K-L、K-T变换
2、K-T变换
如果将三个坐标分量立体化可以更清楚地反映出 农作物生长过程中的三维形态的规律。因三维形 态看起来像一顶带穗的帽子,所以有人形象地称 K-T变换为“缨帽变换”。
一、 K-L、K-T变换
2、K-T变换
0.06 0.03
0.02
累计频率
0.19 0.44 0.65 0.81 0.89
0.95 0.98
1.00
新灰度xb
1.33 3.08 4.55 5.67 6.23
新灰度 xb
1 3 5 6 6
6.65
7
6.86
7
7
7
二、直方图变换
1、直方图均衡化:
原灰度xa
r0=0 r1=1 r2=2 r3=3 r4=4
一、对比度拉伸
2、非线性变换 ①指数变换:
xb
xb beaxa c
增强图像中亮的部分
xa
一、对比度拉伸
2、非线性变换
②对数变换:
xb
xbblga(ax1)c
xa
增强图像中暗的部分
平方根拉伸 前后
二、直方图变换
《遥感导论》实验报告
合肥工业大学资源与环境工程学院《遥感导论》实验报告姓名学号专业地理信息系统班级任课教师实验1 航空相片的立体观测和高程测量一、实验目的:1.掌握使用立体镜进行航空相片的立体观测的方法;二、实验步骤:1.航空相片的立体观察(1)准备工具:立体透视镜。
(2)器材架设:将立体镜的主架部分从箱子中取出,倒过来平放在桌子上,安装好各个支撑脚组件,注意将可调的支脚安在左上方。
然后将装好的主架倒过来平放在桌子上,从箱子中取出目镜部分,安装在主架上,完成安装。
(3)相片的调整。
调整目镜的间距,取出两张立体相对,用手指分别按住2张相片,隔开立体镜之间观察,使两个手指在视线中重合,然后加上立体镜微调相片使2张相片完全重合。
(4)持续观察相片5秒以上,可以得到立体效果。
(5)实验完成后,将器材装回箱内放好。
三、心得体会:初次接触图像,在按照实验原理完成实验后,看到了十分清晰的立体图像,很兴奋。
以前虽也看到过一些立体图像,但是这么近距离的亲身感受还是第一次,而且是在自己的努力下做出了这个效果。
通过这个实验,我们也温习了遥感原理中有关立体相对的知识,立体相对就是两个相机从相距一定距离的两个点对同一目标进行摄影产生重叠图像。
双眼在观察同一事物时,由于两眼所见的角度不同而在大脑中产生影像的重合产生立体效果。
立体观察时,能获得与实物相似的立体模型,称为正立体效应;若将左像片与右像片对调,则获得与实际相反的立体,称为反立体效应。
通过立体观测及阴影可知山的海拔不高都为小山丘,且成片分布,判断为西南或东南地区。
实验2 遥感图像的光学合成一、实验目的:1.了解彩色的基本特征和相互关系;2.掌握3原色及其补色,掌握加色法;3.了解和认识色彩图;二、实验步骤:1.了解彩色的基本特征和相互关系;(1)进入CAI软件主界面,打开“遥感光学合成原理”子目录(2)进入“彩色与非彩色”,对比彩色与非彩色图像对地物特征的表现;(3)进入“彩色的特性”分别进入“明度”,“色调”,“饱和度”界面,观察枫叶色彩的变化,分析对比彩色的三大特征在色彩中的影响。
实验三 遥感图像的辐射增强
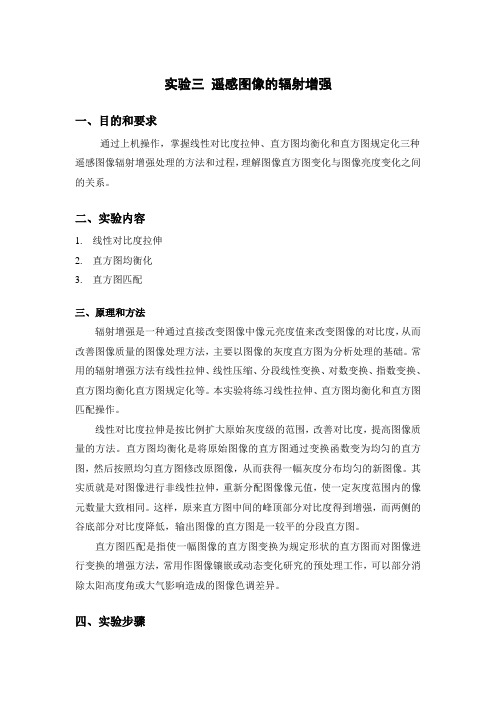
实验三遥感图像的辐射增强一、目的和要求通过上机操作,掌握线性对比度拉伸、直方图均衡化和直方图规定化三种遥感图像辐射增强处理的方法和过程,理解图像直方图变化与图像亮度变化之间的关系。
二、实验内容1.线性对比度拉伸2.直方图均衡化3.直方图匹配三、原理和方法辐射增强是一种通过直接改变图像中像元亮度值来改变图像的对比度,从而改善图像质量的图像处理方法,主要以图像的灰度直方图为分析处理的基础。
常用的辐射增强方法有线性拉伸、线性压缩、分段线性变换、对数变换、指数变换、直方图均衡化直方图规定化等。
本实验将练习线性拉伸、直方图均衡化和直方图匹配操作。
线性对比度拉伸是按比例扩大原始灰度级的范围,改善对比度,提高图像质量的方法。
直方图均衡化是将原始图像的直方图通过变换函数变为均匀的直方图,然后按照均匀直方图修改原图像,从而获得一幅灰度分布均匀的新图像。
其实质就是对图像进行非线性拉伸,重新分配图像像元值,使一定灰度范围内的像元数量大致相同。
这样,原来直方图中间的峰顶部分对比度得到增强,而两侧的谷底部分对比度降低,输出图像的直方图是一较平的分段直方图。
直方图匹配是指使一幅图像的直方图变换为规定形状的直方图而对图像进行变换的增强方法,常用作图像镶嵌或动态变化研究的预处理工作,可以部分消除太阳高度角或大气影响造成的图像色调差异。
四、实验步骤•线性对比度拉伸1.显示图像启动ERDAS,在Viewer1视窗中打开待处理影像:mobby.img2.Viewer1菜单条:Raster→Contrast→General Contrast→打开ContrastAdjust对话框(图3-1),设置相关参数:→method:Linear→斜率:→截距:或者→Breakpts→打开Breakpoint Editor,然后左键选择断点,通过拖动调整变换直线图3-1 对比度调整图3-2 断点编辑器•直方图均衡化(Histogram Equalization)在ERDAS图标面板中选择Interpreter→Radiometric Enhancement→Histogram Equalization→打开Hitogram Equalization对话框(图3-3)→定义待处理影像文件mobby.img→定义输出文件图3-3直方图均衡化直方图匹配(Histogram Match)在ERDAS图标面板中选择Interpreter→Radiometric Enhancement→Histogram Match→打开Hitogram Match对话框(图3-4)→定义待处理影像文件mosaic_1.img→定义匹配对象文件mosaic_2.img→定义输出文件图3-4直方图匹配五、结果分析和讨论1.认真对比处理前后图像的差别,谈谈三种增强方法的处理效果和直方图的变化情况。
实验五 遥感图像处理
实验五遥感图像处理实验目的:通过上机操作,了解空间增强、辐射增强、频率域增强等几种遥感图象增强处理的过程和方法,加深对遥感图象增强处理的理解。
通过上机操作,初步掌握遥感信息融合的方法,深入理解遥感信息融合在信息解译中的意义。
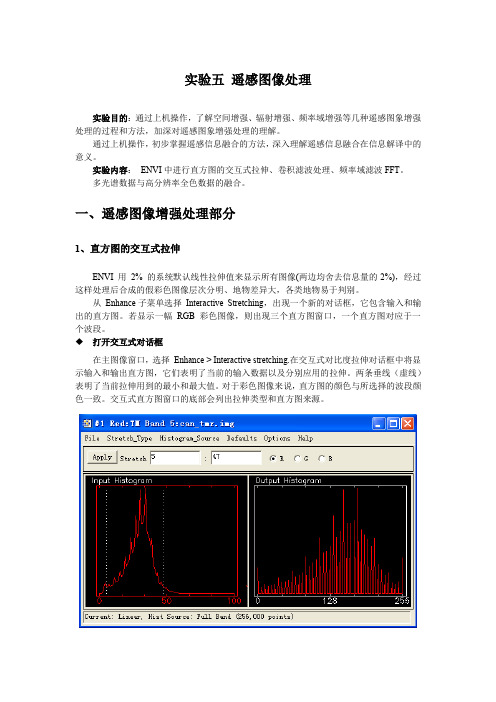
实验内容:ENVI中进行直方图的交互式拉伸、卷积滤波处理、频率域滤波FFT。
多光谱数据与高分辨率全色数据的融合。
一、遥感图像增强处理部分1、直方图的交互式拉伸ENVI 用2% 的系统默认线性拉伸值来显示所有图像(两边均舍去信息量的2%),经过这样处理后合成的假彩色图像层次分明、地物差异大,各类地物易于判别。
从Enhance子菜单选择Interactive Stretching,出现一个新的对话框,它包含输入和输出的直方图。
若显示一幅RGB 彩色图像,则出现三个直方图窗口,一个直方图对应于一个波段。
打开交互式对话框在主图像窗口,选择Enhance > Interactive stretching.在交互式对比度拉伸对话框中将显示输入和输出直方图,它们表明了当前的输入数据以及分别应用的拉伸。
两条垂线(虚线)表明了当前拉伸用到的最小和最大值。
对于彩色图像来说,直方图的颜色与所选择的波段颜色一致。
交互式直方图窗口的底部会列出拉伸类型和直方图来源。
注意:要把任何拉伸或直方图变化自动地应用于你的图像,选择Options > Auto Apply: On.◆浏览数据细节要浏览当前的DN值和指定DN值的像元数、直方图以及累积直方图,可以在直方图内按住鼠标左键并拖放随之产生的白色十字交叉指针。
◆设置拉伸参数要更改最小和最大拉伸值,在任意一条垂直虚线上点击鼠标左键,然后拖曳到一个新位置。
或在对话框顶部的文本框中输入所需值。
当选择任意一条线时,当前的DN、像元数、该单位DN 的像元百分比以及累积百分比,显示在输入的直方图上。
当指定最小和最大值时,输入所需要的实际值(例如,最小值37,最大值68 )或数据的百分比(例如,最小值“2%”,最大值“98%”)。
《遥感导论》实验分析
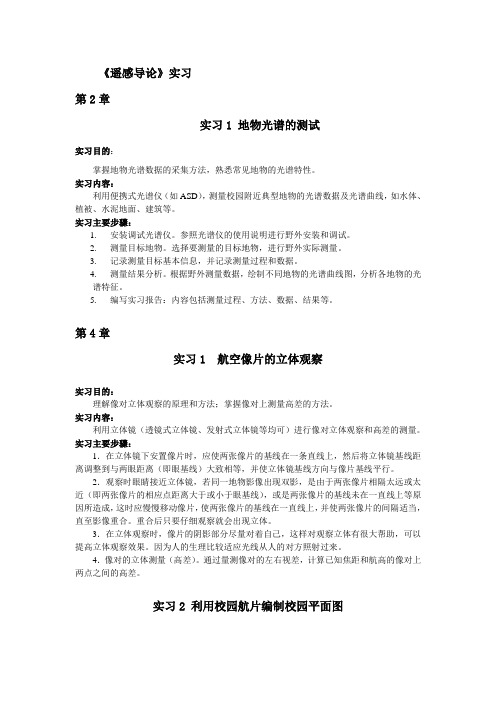
《遥感导论》实习第2章实习1 地物光谱的测试实习目的:掌握地物光谱数据的采集方法,熟悉常见地物的光谱特性。
实习内容:利用便携式光谱仪(如ASD),测量校园附近典型地物的光谱数据及光谱曲线,如水体、植被、水泥地面、建筑等。
实习主要步骤:1.安装调试光谱仪。
参照光谱仪的使用说明进行野外安装和调试。
2.测量目标地物。
选择要测量的目标地物,进行野外实际测量。
3.记录测量目标基本信息,并记录测量过程和数据。
4.测量结果分析。
根据野外测量数据,绘制不同地物的光谱曲线图,分析各地物的光谱特征。
5.编写实习报告:内容包括测量过程、方法、数据、结果等。
第4章实习1 航空像片的立体观察实习目的:理解像对立体观察的原理和方法;掌握像对上测量高差的方法。
实习内容:利用立体镜(透镜式立体镜、发射式立体镜等均可)进行像对立体观察和高差的测量。
实习主要步骤:1.在立体镜下安置像片时,应使两张像片的基线在一条直线上,然后将立体镜基线距离调整到与两眼距离(即眼基线)大致相等,并使立体镜基线方向与像片基线平行。
2.观察时眼睛接近立体镜,若同一地物影像出现双影,是由于两张像片相隔太远或太近(即两张像片的相应点距离大于或小于眼基线),或是两张像片的基线未在一直线上等原因所造成,这时应慢慢移动像片,使两张像片的基线在一直线上,并使两张像片的间隔适当,直至影像重合。
重合后只要仔细观察就会出现立体。
3.在立体观察时,像片的阴影部分尽量对着自己,这样对观察立体有很大帮助,可以提高立体观察效果。
因为人的生理比较适应光线从人的对方照射过来。
4.像对的立体测量(高差)。
通过量测像对的左右视差,计算已知焦距和航高的像对上两点之间的高差。
实习2 利用校园航片编制校园平面图实习目的:掌握遥感图像目视解译的基本原理、过程、方法与技巧;掌握计算机遥感制图的基本过程。
实习内容:判读校区附近彩红外像片,使用GIS(如Mapinfo)软件进行影像的屏幕数字化判读结果与成图。
- 1、下载文档前请自行甄别文档内容的完整性,平台不提供额外的编辑、内容补充、找答案等附加服务。
- 2、"仅部分预览"的文档,不可在线预览部分如存在完整性等问题,可反馈申请退款(可完整预览的文档不适用该条件!)。
- 3、如文档侵犯您的权益,请联系客服反馈,我们会尽快为您处理(人工客服工作时间:9:00-18:30)。
对比度拉伸实验通常直接获得的遥感影像,其数字矩阵的数值分布范围过小;对应的遥感影像显示出的对比度不大,使得影像整体偏暗或者偏亮,势必会影响有用信息的提取。
因此需要一种数学方法,来合理的扩大信息差异,即改变像元的数值大小。
方法有多种:–使大数值更大,小数值更小,扩大差异。
–使过小的数值变大,过大的数值变小,缩小没有必要的距离。
–……这些方法均对应了不同的对比度拉伸功能。
改变方法:–线性变换(全局线性变换、分段线性变换)–非线性变换简单线性变换是按比例拉伸原始图像灰度等级范围,一般为了充分利用显示设备的显示范围,使输出直方图的两端达到饱和。
变换前后图像每一个像元呈一对一关系,因此像元总数不变,亦即直方图包含面积不变。
线性变换是通过一个线性函数实现变换的。
在实际计算时,一般先建立一个查找表(Lookup Table,即LUT表),即建立原始图像灰度和变换后图像灰度之间的对应值,在变换时只需使用查找表进行变换即可,这样计算速度将极大提高。
由于遥感图像的复杂性,线性变换往往难以满足要求,因此在实际应用中更多地采用分段线性变换,可以拉伸感兴趣目标与其他目标之间的反差。
ERDAS软件提供了一个默认设置,即Raster Option中的No stretch。
打开遥感影像时,–对Raster Option中的No stretch,•选中代表打开影像时,不对影像进行默认拉伸•不选中代表打开影像时,对影像进行默认拉伸。
ERDAS默认的拉伸方法是2倍标准差的拉伸,目的使得影像数字矩阵分布直方图符合高斯分布。
1.打开影像时,不对影像进行默认拉伸。
在视窗(Viewer)中打开实验影像,并且对Raster Option中的No Stretch打勾。
2.以默认的拉伸方式打开影像。
ERDAS 默认的拉伸方法是2倍标准差的拉伸,目的使得影像数字矩阵分布直方图符合高斯分布。
打开实验影像,并且对Raster Option 中的No Stretch 不打勾。
在视窗中打开遥感影像数据后,菜单条上会增加栅格菜单(Raster)。
视窗下Raster/contrast3.直方图均衡化处理(Histogram Equalize)4.标准差拉伸处理(Standard Deviation Stretch)5.通用对比度调整(General Contrast)弹出如下所示对比度调整对话框,这里提供了更多的数学拉伸方法,如Histogram Equalization直方图均衡化、Standard Deviations标准差拉伸、Gaussian高斯拉伸、Linear线性拉伸、Gamma非线性拉伸、Invert亮度反转等。
重点是Linear线性拉伸,根据图像信息提供的最小值和最大值,计算线性变换方程的斜率(slope)与截距(shift)。
6.亮度/对比度调整(Brightness/Contrast)7.分段对比度调整(Piecewise Contrast)(分段线性拉伸)分段线性拉伸用于对图像局部区域通过分割LUT表进行增强,通常将LUT表分为低、中、高三段,然后分段调整其亮度和对比度,可增强阴影区等。
在Contrast Tool对话框中:Range Specification栏目下的Low、Middle、High分别对应于低中高三段不同的亮度值范围,而Select Color 栏目下的Red、Green、Blue则分别对应于图像的红绿蓝三个波段。
通过波段与亮度范围的选择组合,达到调整图像亮度与对比度的目的。
该命令常常与查询光标(Inquire Cursor)一同使用,首先查询特定区域各波段的灰度值,然后设置Range Specification分段值。
The brightness value for each range represents the midpoint of the total range of brightnessvalues occupied by that range.The contrast value for each range represents the percent of the available output range thatparticular range occupies.As one slider bar is moved, the other is automatically adjusted, so that there is no gap in thelookup table. This tool is set up so that there are always pixels in each data file value from 0to 255. You can manipulate the percentage of pixels in a particular range, but you cannoteliminate a range of data file values.2. With your pointer over the image in the Viewer, right-hold Quick View | Inquire Cursor. The Inquire Cursor dialog opens and an Inquire Cursor is placed in the Viewer.3. In the Viewer, drag the intersection of the Inquire Cursor to the lake. Move the Inquire Cursor over the water while keeping an eye on the lookup table values in the blue color gun, as reported in the Inquire Cursor dialog.This gives you an idea of the range of data file values in the water. You can stretch this rangeto bring out more detail in the water.4. In the Contrast Tool dialog, click Blue under Select Color.5. Under Range Specifications, set the Low range From 34 To 55 and press Return on your keyboard.6. Drag the Brightness slider bar (the top slider bar) to 50.7. Click Apply in the Contrast Tool dialog.The water now has more contrast and shows more detail.If your image is at a magnification of 1, this new detail may be difficult to see. You can zoomin to a magnification of 2 using the Quick View menu in the Viewer.8. In the Contrast Tool dialog, click Reset and then Apply to return the image to the original lookup table values.9. Click Close in the Contrast Tool dialog.10. Click Close in the Inquire Cursor dialog.8.直方图断点操作(Breakpoints)Manipulate Histogram1. In the Viewer menu bar, select Raster | Contrast | Breakpoints.The Breakpoint Editor opens.2. Click on the popup list at the top of the Breakpoint Editor and select Red.Each of the three histogram graphics in the Breakpoint Editor can be expanded up to full sizeby selecting the appropriate histogram from the popup menu at the top of the Break Point Editor. The parts of the histogram graphic are described in the following illustration.3. Click on the popup list at the top of the Breakpoint Editor and select RGB.All three histograms redisplay in the Breakpoint Editor.4. Experiment by dragging the breakpoints of the lookup table graphs in the different color guns (Red, Green, and Blue).5. Click Apply All in the Breakpoint Editor to view the results of your changes in the image.6. To undo the edits you just made, select Raster | Undo from the Viewer menu bar.Adjust Shift/Bias1. In the Breakpoint Editor, click the Shift/Bias icon on the tool bar.The Shift/Bias Adjustment dialog opens.对一幅影像完成对比度拉伸后,关闭视窗时均会弹出以下类似对话框选择“是”,则当前采取的变换结果会直接保存在对应的查找表中了,以便下次直接按查找表拉伸表示。