
高考英语作文之图表作文的写作
图表作文的写作
根据所给图表,简要描述某城市试题近年每百人手机用户的增长情况,并试分析
其增长的原因.(2002年上海春考)The chart above indicates that the number of mobile phones has increased in the city in recent years.
Between 1995 and 1999 the number of mobile phone users increased by 10 percent each year. In 2001, the number almost doubled. It is predicated that the number will skyrocket in the years to come.
The reason for the increase can be various. First a mobile phone is convenient for people especially business people. Because of its small size, light weight and
portability, you needn’t go to a phone booth to make a telephone call. One user says, “With a mobile phone, I can make a phone call to do business without worrying about time and space. This saves me time and trouble.”
Besides, mobile phones are finding their way into ordinary families. Mobile phone lovers talk with their friends, family members whenever they like. Of course, there are some other people buying mobile phones merely to follow the fashion or show their position in society.
Whatever reason it may be, I think the increase will continue into the future because they can make our life convenient and the world smaller. 189’
1. One chart shows us that from…to…increase by the average of/the changing rate of…
2. We can see an increasing trend in the
first…
3. At the beginning of …this year, the rate comes to a peak point of, but in… it fell to…In the next two months, it was rising again and in… it dropped to the lowest point of…at the end of this year.
4. Recently a survey has been done to find out the reading interests of …. In this survey, …
The survey shows that …
5. There are many reasons for this phenomenon.
6. From the facts mentioned above, we know that great changes have taken place…
Test 8范文
Recently, a survey has been done to find out the health problem among Senior Three students. According to the chart which was based on the statistics from the survey, the students’main health problems are a follows.
About 70% of the students feel worried about their study. They are afraid of taking exams and always want to escape them. Two-fifths of the students think they lack communication with their parents, and 60% of them don’t have enough physical exercise in their daily life. They only have two hours for physical exercise in a whole week. Also seven out of ten students nowadays wear a pair of glasses. Their eyesight has already become a serious problem.
I’d like to propose some suggestions to help students keep fit both physically and mentally in their busy senior three study life. First of all, you can listen to some music to relieve your stress and relax yourself. Listening to some light music before you go to bed, you’ll feel more relaxed and have a sound sleep. Moreover, if you have some spare time, go outdoors and do more physical exercise like playing badminton
and jogging. Breathing the fresh air will refresh your mind and enable you to do better in your study. Last but not least, it’s a period of time when we live under great pressure. It’s advisable to turn to your teachers for when you are in trouble because they are rich in experience and they will give you some useful advice.
All in all, we should not only focus on our study during the senior three year, but also pay attention to our physical and mental development. 277’。
图表型英语作文模板
图表型英语作文模板篇一:英语作文图表类提纲类作文写作模板第一部分、写作模板——图表式作文It is obvious in the graphic/table that the rate/number/amount of Y has undergone dramatic changes. It has gone up/grown/fallen/dropped considerably in recent years (as X varies). At the point of X1, Y reaches its peak of …(多少).What is the reason for this change? Mainly there are …(多少) reasons behind the situation reflected in the graphic/table. First of all, …(第一个原因). More importantly, …(第二个原因). Most important of all, …(第三个原因).From the above discussions, we have enough reason to predict what will happen in the near future. The trend described in the graphic/table will continue for quite a long time (if necessary measures are not taken括号里的使用于那些不太好的变化趋势).第二部分、写作模板——提纲式作文一、说明原因型模块(一)Nowadays , there are more and more XX in some big cities . It is estimated that ( 1 ). Why have there been so many XX ? Maybe thereasons can be listed as follows.The first one is that ( 2 ) .Besides, ( 3 ) . The third reason is ( 4 ). To sum up , the main cause of XX is due to ( 5 ) .It is high time that something were done upon it. For one thing , ( 6 ). On the other hand , ( 7 ). All these measures will certainly reduce the number of XX .注释:(1)用具体数据说明XX现象;(2)原因一;(3)原因二;(4)原因三(5)指出主要原因;(6)解决建议一;(7)解决建议二。
高考英语作文图表分析类经典范文
图表分析类受某英文报的委托,你最近对高中生的英语阅读兴趣做了一次调查。
请根据以下信息,用英语为该报写一篇100词左右的短文。
短文的标题及首句已为你写好。
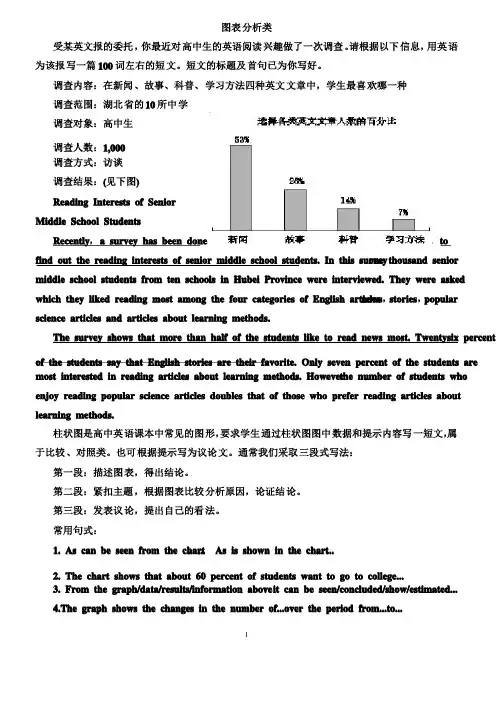
调查内容:在新闻、故事、科普、学习方法四种英文文章中,学生最喜欢哪一种调查范围:湖北省的10所中学调查对象:高中生调查人数:1,000调查方式:访谈调查结果:(见下图)Reading Interests of SeniorMiddle School StudentsRecently,a survey has been done tofind out the reading interests of senior middle school students. In this survey,one thousand senior middle school students from ten schools in Hubei Province were interviewed. They were asked which they liked reading most among the four categories of English articles,news,stories,popular science articles and articles about learning methods.The survey shows that more than half of the students like to read news most. Twentysix percent of the students say that English stories are their favorite. Only seven percent of the students are most interested in reading articles about learning methods. However,the number of students who enjoy reading popular science articles doubles that of those who prefer reading articles about learning methods.柱状图是高中英语课本中常见的图形,要求学生通过柱状图图中数据和提示内容写一短文,属于比较、对照类。
图表类关于学习的英语作文
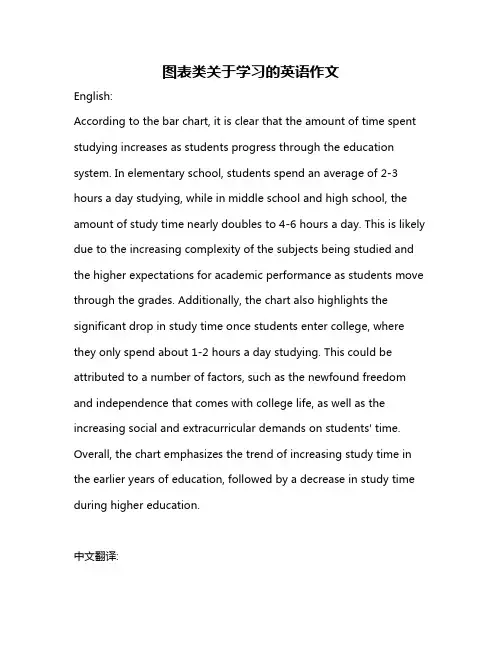
图表类关于学习的英语作文English:According to the bar chart, it is clear that the amount of time spent studying increases as students progress through the education system. In elementary school, students spend an average of 2-3 hours a day studying, while in middle school and high school, the amount of study time nearly doubles to 4-6 hours a day. This is likely due to the increasing complexity of the subjects being studied and the higher expectations for academic performance as students move through the grades. Additionally, the chart also highlights the significant drop in study time once students enter college, where they only spend about 1-2 hours a day studying. This could be attributed to a number of factors, such as the newfound freedom and independence that comes with college life, as well as the increasing social and extracurricular demands on students' time. Overall, the chart emphasizes the trend of increasing study time in the earlier years of education, followed by a decrease in study time during higher education.中文翻译:根据这个柱状图,清楚地显示出随着学生在教育体系中的进展,学习时间的增加。
高中英语作文之图表类作文写法

.
第一段(描述图表,得出结论 )
A number of facts might contribute to this phenomenon. One of the most important reasons can be the development of national economy and the rise of people's living standard, which made it possible for Americans to buy their personal computers.
The number of colour TV sets produced by the factory increased (rose , grew , climbed) from 5000 in 1986 to 21000 in 1990.
.
从表中所给的统计数字可以看出,从1985年到1990年中 国的人均收入迅速提高。 From the statistics given in the table it can be seen that the of average personal income the Chinese people increased (grew 、rose) rapidly from 1985 to 1990.
.
从曲线图可以得出结论,最近5年来中国人口的出生率已 经大大下降。
英语高考图表作文

英语高考图表作文In the first chart, we can see the percentage of students who choose different majors in college. It's interesting to note that the majority of students prefer to major in business, while the least popular major is engineering. This reflects the current trend of students leaning towards more practical and marketable majors.The second chart shows the average monthly income of people with different levels of education. Surprisingly, those with a high school diploma actually earn more on average than those with a bachelor's degree. This challenges the common belief that higher education always leads to higher income.Moving on to the third chart, it illustrates the distribution of household chores among family members. It's quite striking to see that women still bear the majority of the housework, despite the progress in gender equality. This indicates that traditional gender roles are stilldeeply ingrained in our society.Next, the fourth chart presents the percentage of people who are satisfied with their work-life balance. It's alarming to see that only a small fraction of people feel satisfied, while the majority feel overwhelmed by work. This highlights the pressing issue of work-related stress and the need for better work-life balance.Finally, the fifth chart depicts the usage of social media among different age groups. Unsurprisingly, the younger generations spend the most time on social media, while the older generations are less engaged. This reflects the digital divide between age groups and the increasing influence of social media on younger generations.In conclusion, these charts offer valuable insightsinto various aspects of modern society, from education and gender roles to work-life balance and technology usage.It's clear that there are still many challenges and disparities that need to be addressed in order to create a more equitable and balanced society.。
【写作指导】高中英语图表型作文写作步骤+写作模板+优秀范文!
高中英语图表型作文写作步骤+写作模板+优秀范文!图表型作文通常用图片、表格的方式反映出某一问题、现象或观点,该类作文要求考生首先对图表进行简单表述,然后点题并加以论证说明。
这几年高考英语作文通常以书信类应用文为载体,而不常考的图表型作文反而容易被大家忽略,一旦考到,措手不及,今天小编就为大家分享高中英语图表型作文的写作步骤和写作模板,希望大家仔细阅读记忆。
写作步骤:1.点明图表所反映的主题。
常用词汇:table, chart, figure, graph, describe, tell,show, represent等2.分析数据差异及趋势或者描写数据代表内容。
注意层次。
常用词汇:rise,increase, drop, reduce, decrease, fall, but, on the contrary, however, the same as, be similar to, be different from 等3.归纳总结或发表自己看法。
常用词汇:in a word, in short, to sum up, We candraw the conclusion that ...等。
重点句子:一、引入话题1.It can be seen from the table that….2.As is indicated in the chart,….3.From the sharp rise (上升n.) / decline (下降n.) in the chart, it goes without sayingthat….(不用说……)4.It has gone up(上升) / fallen / dropped(下降) considerably in recent years.二、描述变化或原因1.表示递进what’s more, besides, in addition, furthermore, to make matters worse,what’s worse (更糟糕的是)2.表示解释account for , that is to say, mean, in other words3.表示变化---快速上升rise (increase / go up ) sharply (quickly, rapidly)eg: The number sharply went up.—缓慢下降decrease (reduce/ come down/ decline/ drop/ fall) slowly—表示对比compare with , contrary to, on the contrary4.描述多重原因—There are several reasons behind the situation reflected in the above table.First of all, ……; More importantly,…….; Most importantly,……..;—There are at least two good reasons accounting for this phenomenon. On one hand,…….; On the other hand,………; In addition,…. is responsible for….三、总结或评论1.Personally speaking, in a word, in conclusion,2.It can be concluded that….(可以得出结论)3.From the above discussion, we have enough reasons to predict what will happenin the near future.4.The trend described in the table will continue for quite a long time if necessarymeasures are not taken.5.As far as I’m concerned, I hold the view that…6.I’m sure my opinion is both sound and well-grounded. (既合理又理由充分)写作模版:1.分析图表数字代表内容Ascan be seen from the chart, _____________________(话题).Different people hold different opinions on this matter.Obviously, the majority of the people believe that ______________. However, others (20%) consider that_______________. Besides, another 5% hold the view that_______________.As far as I am concerned, we should pay more attention to __________. On one hand, ________________. On the other hand, __________________.2.分析数字反映的原因As can be seen from the chart, ____________________(话题). Different people hold different opinions. About 60% of the people ____________, while 25% of the people ______________.The least people, accounting for 15%, _______________.Various reasons are responsible for their different choices. To begin with, ___________. What’s more, ______________.Besides, _____________.As far as I am concerned, I am in favor of the view that_____________. I believe that ___________________.或As far as I am concerned, despite such problems, I hold the view that we should ________________. Only in this way can we _______________.图表类作文实战1:下面的图表显示了你们学校高三学生周末放假的学习生活情况。
高考图表作文英文作文
高考图表作文英文作文The chart shows the percentage of high school graduates attending college from 2010 to 2020. In 2010, the percentage was 65%, and it increased to 70% in 2015. However, it dropped to 68% in 2020.The bar graph illustrates the average monthly income of different age groups in 2019. People aged 25-34 had the highest average monthly income, while those aged 45-54 had the lowest.The pie chart depicts the distribution of leisure activities among teenagers. Watching TV and using social media accounted for the largest proportion, followed by sports and outdoor activities.The line graph displays the trend of air pollution levels in a city from 2015 to 2020. There was a significant decrease from 2015 to 2017, but it started to rise again in 2018 and continued to increase until 2020.The table compares the consumption of fast food in three different countries. The United States had the highest consumption, followed by the United Kingdom and Canada.The scatter plot shows the relationship between hours of study and exam scores. It indicates a positive correlation, as students who studied more hours tended to achieve higher scores.The diagram represents the sources of greenhouse gas emissions. It reveals that the majority of emissions come from the energy sector, followed by agriculture and industrial processes.The flow chart illustrates the process of recycling plastic bottles. It involves collection, sorting, cleaning, shredding, melting, and finally, the production of new plastic products.。
图表描述类英语作文(4篇)
图表描述类英语作文(4篇)图表描述类英语作文篇一The above bar chart informs us of the phenomenon that there exist some differences in additional working hours among diverse careers, especially between self-employed businessmen and civil servants. Self-employed businessmen spend nearly 2 hours per day in working overtime. On the contrary, civil servants’ additional working hours is the shortest, only less than 50 minutes per day. The overtime of scientific researchers, cultural and sports workers and teachers is 80 minutes, 70 minutes and 55 minutes respectively.Ample reasons can account for this phenomenon. Firstly, to make more profits, self-employed businessmen have to spend more time in manufacturing products, attracting customers, providing after-sale services and managing staff. Moreover, with the competition becoming fiercer, they have no alternative but to work overtime to avoid being eliminated by the market and their rivals. When it comes to civil servants, things have gone otherwise. Confronted with less risks as well as pressures and leading a steady and routine life, they don’t have to work overtime frequently.Working overtime is a two-bladed sword. Surely, it will generate considerable benefits. However, it will give rise to some damages, especially to our health. We should balance our work, life and health or we will eventually become a machine and salve of work.四级英语作文图表类篇二图片模板:It seems to me that the cartoon / drawing issending a message about ____________(图画内容),which reveals ____________(稍作评价).In myperspective of view, ____________ (表明个人观点)。
高考图表类英语作文
高考图表类英语作文In the chart, we can see that the number of people using smartphones has been increasing steadily over the years. This trend is not surprising considering the rapid advancements in technology and the increasing accessibility of smartphones to people of all ages.Looking at the data, it is clear that younger people are more likely to use smartphones compared to older generations. This could be due to the fact that younger individuals are more tech-savvy and are more likely to embrace new technologies compared to their older counterparts.One interesting point to note is the difference in smartphone usage between urban and rural areas. It seems that people living in urban areas are more likely to use smartphones compared to those living in rural areas. This could be attributed to the fact that urban areas generally have better access to technology and more resourcescompared to rural areas.Another interesting observation from the chart is the difference in smartphone usage between different income groups. It appears that individuals with higher incomes are more likely to own and use smartphones compared to those with lower incomes. This could be due to the fact that smartphones are considered a luxury item and individuals with higher incomes are more likely to afford them.Overall, the data from the chart paints a clear picture of the increasing prevalence of smartphones in our society. It is evident that smartphones have become an integral part of our daily lives, with more and more people relying on them for communication, entertainment, and information. As technology continues to advance, it will be interesting to see how smartphone usage continues to evolve in the future.。
图表英语作文范文带翻译
图表英语作文范文带翻译Title: The Importance of Graphs and Charts in Presenting Information。
Graphs and charts play a crucial role in conveying complex information effectively. In today's data-driven world, they are indispensable tools for analyzing trends, making comparisons, and illustrating relationships. This essay will explore the significance of graphs and charts in presenting information, examining their various types, and discussing their advantages and limitations.To begin with, graphs and charts offer a visual representation of data, which enhances understanding and interpretation. For instance, a line graph can illustrate changes over time, such as fluctuations in stock prices or temperature variations throughout the year. Similarly, a bar chart can depict comparisons between different categories, like sales figures for various products or the population distribution across different regions. Bypresenting data visually, graphs and charts simplify complex information, making it easier for audiences to grasp key insights at a glance.Moreover, graphs and charts facilitate data analysis by highlighting patterns and trends. Through visualizations, researchers and analysts can identify correlations, outliers, and other significant features in the data. For example, a scatter plot can reveal the relationship between two variables, such as the correlation between study hours and exam scores. By plotting data points on a graph, patterns emerge, enabling researchers to draw conclusions and make informed decisions based on evidence.Furthermore, graphs and charts aid in effective communication by presenting information in a clear and concise manner. In presentations or reports, visual aids like pie charts or histograms can convey key findings more compellingly than lengthy text or numerical tables. Visual representations engage audiences and help them absorb information more readily. Additionally, graphs and charts can be customized with colors, labels, and annotations toemphasize important points or differentiate between data sets, enhancing clarity and impact.However, it is essential to acknowledge the limitations of graphs and charts. While they excel at summarizing large datasets and identifying trends, they can also oversimplify complex phenomena. Misleading visualizations, such as distorted scales or truncated axes, can distort the true nature of the data and lead to erroneous conclusions. Therefore, it is crucial to critically evaluate the design and accuracy of graphs and charts to ensure they accurately represent the underlying information.In conclusion, graphs and charts are invaluable tools for presenting information effectively in various fields, from scientific research to business analytics. They offer visual clarity, facilitate data analysis, and enhance communication by simplifying complex concepts. However, it is essential to use them judiciously and critically evaluate their accuracy to avoid misinterpretation. Ultimately, when used appropriately, graphs and charts are powerful instruments for conveying insights and drivinginformed decision-making.标题,图表在呈现信息中的重要性。